M ultan
Durdana Qaiser Gillani
Rana Ejaz Ali Khan, Muhammad Zahir
Faridi
The informal sector provides income opportunities to its participants in urban areas. The present study estimates the Mincerian earning functions of urban informal sector participants and makes extensions in Mincerian functions. W e have based our study on the primary data that is collected by conducting a household survey in urban areas of district Multan. The informations are obtained from 325 participants in urban informal sector. Mincerian’ s earning function is an appropriate for the participants of urban informal i-e trade, services, manufacturing, and transport and construction sector of district Multan.
1.
Introduction
which are dependent on their health and nutrition are also characterized human capital. Education is regarded as the foremost form of investment in human resources. Education can, by evaluating the learners’ intellect, develop their quality of life; however it may also improve the individuals’ skills and efficiency in producing useful things.
Informal sector contributes to a substantial share of employment and output as well as it provides livelihood to millions of the people in developing countries. The small scale, self-employed activities, with or without hired workers, typically at a low level of organization and technology, with the primary objective of generating employment and incomes are distinguished as informal sector activities.1
In Pakistan economy, the growth in GDP for year 2011-12 has been estimated 3.7 percent against 3.0 percent in the previous fiscal year 2011. The growth of agriculture sector is recorded 3.1 percent against 2.4 percent last year. The growth of Large scale manufacturing (LSM) is observed 1.1 percent during July-March 2011-12 as compare 1.0 percent last year. It is estimated that commodity producing sectors and especially the agriculture sector have shown a better performance. The growth in services sector is pointed out at 4.0 percent in 2011-12. The increase in Per capita income is estimated at 2.3 percent in 2011-12 as compared to 1.3 percent growth last year. Pakistan has experienced an increase of 0.9 million in labour force which is more than the last year. The total number of employed is about 53.8 million during 2010-11 year, which is 0.6 million more than the last year.2
District Multan because this sector is providing income opportunities to its participants.
Multan division comprised of four subdivisions such as Multan Contonment, Multan Sadar, Shujabad, Jalalpur Pirwala. The very district is surrounded on the east by Lodhran and Khanewal districts, on the north by Khanewal districts, on the south by Bahawalpur district dividing the two districts by Sutlej River between and on the west by Chenb across which M uzaffargarh district is situated. There are four tehsils i-e Multan Saddar, Multan city, Shujabad and Jalalpur Pirwala in district Multan. The total area of district is 3,720 square kilometers which indicates a population density of 838 persons per square kilometer. The urban population in the district is observed 42.2 percent of the total population and it indicated a rise at an average rate of 2.9 percent during 1981-98.
The study estimates the earnings functions of human capital variables to see the affect of these variables on income of the participants in urban informal sector. The study also makes an endeavor to estimate the Mincerian earnings function with different categories of education to modernize the work on returns to education.
The purpose of the study is to find out the income determinants of participants of urban informal sector employment especially in Multan district. There is a positive association between higher earnings and human capital variables or higher earnings of urban informal sector participants are positively correlated with higher levels of education and other socio-economic variables.
2.
Literature Review
There is elevated theoretical evidence on earning determinants of urban informal sector participants at national and at international level. In the coming paragraph, we will review some studies related with our topic.
Banergee (1983) analyzed informal sector participation in the process of migration by conducting a survey of migrant heads of household in Delhi. The conventional human capital variables, family and environmental background factors and personal attributes influenced the earnings. The sets of estimates were made by earning functions, logit model of sector of entry, logit estimates of mobility between sectors. The empirical evidence indicated that the migration process postulated in probabilistic models did not seem to be realistitic in the case of Delhi by opportunities in this sector itself. The results of the study showed that actual and potential mobility from the informal to the formal sector was low. In addition, education and urban experience were rewarded at the same rate in both the sectors. Finally, education was one of the significant determinants of mobility between sectors.
Ashraf and Ashraf (1993) used household income and expenditure survey data in 1979 and 1985-86 to analyse the male-female earning differentials in Pakistan. Factors that affected the earnings were age, province of residence and education level and industry. The study was based on the Oaxaca (1973) and Cotton (1988). The results found a decline in the gender earnings gap between 1979 and 1985-1986. The result pointed out that age was statistically significant in favour of equally male and female in both years.4 The author also found an inverse relationship
between age square and earnings of wages in Pakistan. Further, it was found a positive association between all levels of education and earnings of participants in Pakistan.5 The inter-province
earning differential was smallest in the case of NW FP-Sindh as indicated by the statistically insignificant coefficient estimate for Sindh. The coefficient estimate for Balochistan was statistically insignificant in 1979 but was highly significant in 1985-86. The study also found a positive as well as negative relationship between earnings and sector of employment or occupation.
The Pakistan’ s urban informal sector was discussed by Burki and Abbas (1991). The data was taken from the survey of male self-employed in the skill-intensive urban informal sector of Pakistan. The paper used the regression equations. 6 The study results suggested that human capital investment were rewarded in a manner which was extraordinary similar to that existing in the formal sector of Pakistan.
education. In addition, rate of return to female education was higher than male education.
Sargana (1998) examined the urban informal sector in Pakistan economy by using the primary data source and conducting survey in Rawalpindi and Islamabad. The author estimated a Mincerian model in the study and focused on service sector. The results of study highlighted that income increased with an increase in education and experience. 8 Regression results also indicated that schooling paid more to the self-employed as compared to the wage earners.
Nasir (2002) discussed human capital with regard to gender disaggregated analysis in Pakistan. The study used the PIHS data, 1995 for analysis. The important factors influencing the earnings were education, experience, technical training, and numeracy skills. The analysis based on Mincerian model.9 The results revealed that the human capital considerably affected the earning of both male and female workers.10 The results also indicated that higher earnings were positively related with higher levels of education. The effect of literacy and numeracy were found to be large and significant for formal workers but small for female workers. Moreover, technical training positively and significantly affected the male workers’ earnings. In conclusion, the education played a central role in development process of country because it increased the productivity of worker which was an indispensable ingredient of growth.
experience square and age square and earnings were negatively associated with earnings. Finally, female and earnings were negatively correlated.
Manda et al . (2002) analyzed the influence of human capital on earnings and returns to education based on data taken from W elfare Monitoring Survey (W MS) of 1994 undertaken by the government of Kenya. The study followed the Mincer (1974) in estimating semi-logrithemic equations for the determinants of earnings. Findings described that most of the human capital variables were noteworthy and had the expected influence on earnings. The results also revealed that private returns to education generally increased with the level of education. It was concluded that human capital externality had a positive impact on incomes of the participants.
Vencatachellum (2006) emphasized on the rates of returns to education in Cameroon. The informations at both the household and individual levels were obtained from 2001 CHS. Study used the OLS estimations of earning equation. Study results showed that rates of returns were high and convex to education in all sector of employment. Results also indicated the rural dwellers with low earnings as compare to urban dwellers. There was found a positive return to first level of secondary school education in informal sector. It was also found higher return to vocational education in the informal sector than elsewhere.
positively affected the earnings. Results also concluded that earnings tended to increase with human capital externality.
The private returns to education in urban China were found by Hudson (2010) by using data from the China Health and Nutrition Survey (CHNS). The study used the OLS regression technique. The results showed that there was noticeable increase in rates of return to education especially from 1997 to 2000. Moreover, education reduced the gender earning’ s gap and enhanced ability of the labour.12
3.
Data and Methodological Issues
a)
Data Collection and Sources
The present study of the urban informal sector relies on the primary source of data. The data was gathered by conducting survey during the year (2012). W e have developed a questionnaire consisting on the relevant information regarding the objective of the study. Informations are obtained by interview method .The district Multan is chosen to do a research because the urban area of district Multan absorbs majority of the informal workers. For the purpose, two tehsils i-e Multan and Shujabad were selected from the District Multan. A sample of 326 urban informal workers (both male & female) in the age group 18-64 years was randomly drawn. Usually studies regarding urban informal sector were based on very small sample but this study is based on large sample size and includes trade, service, manufacturing, transport and construction sectors of urban informal sector.
b) Methodology
function of human capital variables like completed years of education, educational categories, training / skills, age and other socio-economic variables. In the present study, an econometric analysis of urban informal sector workers is modeled in the framework of the traditional Human capital theory of Mincer (1957) by using the Mincerian model.
Rather a few studies have already used Mincerian earnings function in the urban informal sector of Pakistan. These include Burki and Abbas (1991), Sargana (1998) and Nasir (2002) and in case of other countries, Manda et al. (2002) have used the regression model to estimate the rates of returns of human capital variables in the urban informal sector with small surveys. W hereas, Kozel and Alderman (1990), Ashraf and Ashraf (1993), and Hudson (2010) have extended the Mincerian earnings model (1974) to estimate the effect of other variables on earnings of informal sector workers by conducting small surveys.
W e have applied ordinary least square method in order to estimate the earnings determents.
y = f(x1,x2,… … … … ,x4)
y =
α
+β
1x1+ , … … … .β
kxk+ε
where
α
= Intercept termβ
1,β
2, … … ..β
k are coefficientε
= error termModel Specification
W e have specified our model into two forms. In the present study our model specification is based on multiple regression models. W e have made to specification for analysis.
study also extended this Mincerian Earning Function by incorporating other variables.
Ln Yi=
α
0 +β
1 AGY +β
2 YED+β
3TRN+β
4SEX+β
5 MRS+β
6HVAT +β
7W HR+μ
iIn order to investigate the individual impact of various levels of education. W e have specified the following model
Ln Yi=
α
0 +β
1 AGY +β
2 EDUII+β
3 EDUIII+β
4 EDUIV +β
5EDUV +β
6TRN+β
7SEX+β
8 MRS+β
9HVAT +β
10W W H+μ
iDescription of the variables
Table 1 presents the description of above mentioned variables
Table1
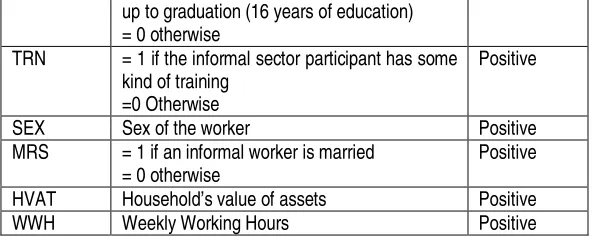
List of variables, Description and their relationship.
Variables Description of variables Relationship
Dependent
YED Complete years of education Positive
EDUII =1 if an informal sector participant’s education is level is up to middle (8 years of education) = 0 Otherwise
Positive
EDUIII =1 if an informal sector participant’s education level is up to metric (10 years of education) = 0 Otherwise up to graduation (14 years of education) =0 Otherwise
Positive
up to graduation (16 years of education) = 0 otherwise
TRN = 1 if the informal sector participant has some
kind of training =0 Otherwise
Positive
SEX Sex of the worker Positive
MRS = 1 if an informal worker is married
= 0 otherwise
Positive
HVAT Household’s value of assets Positive
WWH Weekly Working Hours Positive
4.
Results and Discussion
The made a statistical as well as an empirical analysis for the earning determinants of the participants of urban informal sector.
a)
Descriptive Analysis:
Now we made descriptive analysis.
A)
Table 5.1: Summary Statistics of Explanatory
Variables
Variables Mean S.D Skewness Kurtosis
AGY 37.1534 10.7068 0.223 -0.902
YED 10.4479 4.2232 -0.747 0.558
TRN 0.3558 0.4795 0.605 -1.644
SEX 0.4018 0.4910 0.402 0.269
MRS 0.7025 0.4579 -0.890 -1.216
HVAT 1020294.48 854504.4 0.9333 1.719
WWH 40.3436 12.2419 -0.179 -0.578
year of education, workers are on the average 10.45 percent. The variability about mean is 4.22. The analysis indicates that on average, there are 35.58 percent workers who have some kind of skill training. In the analysis, male participants of urban informal sector are 40 percent on average. The married participants of urban informal sector are 70 percent on average. On average, household value of assets is 1020294.48 and average size of informal workers who are working is 40.34.
(B) Empirical Analysis and Discussion
W e present results in this section. Generally impacts of age, years of education, training facility, sex, marital status, household value of assets and working hours are checked using simple OLS regressions on the income of the participants in urban informal sector. Results are presented in table below.
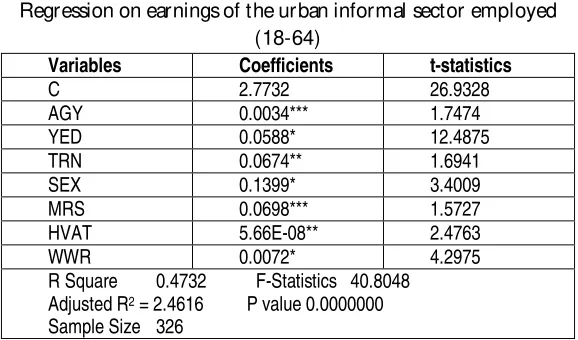
Table 5.2
Regression on earnings of the urban informal sector employed (18-64)
Variables Coefficients t-statistics
C 2.7732 26.9328
AGY 0.0034*** 1.7474
YED 0.0588* 12.4875
TRN 0.0674** 1.6941
SEX 0.1399* 3.4009
MRS 0.0698*** 1.5727
HVAT 5.66E-08** 2.4763
WWR 0.0072* 4.2975
R Square 0.4732 F-Statistics 40.8048 Adjusted R2 = 2.4616 P value 0.0000000
Sample Size 326
Note: Val ues are calculated using the data col l ected from Di stri ct Mul tan * Si gni fi cant at 1% l evel of si gni fi cance
The study results in table 5.2 incorporates age in complete years, complete years of education, training facility, sex, marital status, working hour, household value of asset. Results in equation (5.2) reveal that all human capital variables are highly significant. The results show that income is an increasing function of age and education. Findings indicate that an increase in one year of age (AGY) increases the earnings by 0.08 percent. W hile, the coefficient of complete years of education (YED) is highly significant at 1 percent level of significance. The earnings of the participants of urban informal sector increase by 0.09 percent for an increase of one unit in training skills. The estimates indicate that the coefficient of sex (SEX) is highly significant. Furthermore, the estimated coefficient of marital status (MRS) implies 0.11 percent increase in earnings for each additional married person. Results also highlight that coefficients of the variable on the working hour (W W H) and household assets (HVAT) are also positive and have highly significant influence on earnings. The study results are consistent with Sargana’ s (1998), Burki and Abbas’ s (1991), Kozel and Alderman’ s (1990), Smith and Metzger’ s (1998), W ahba’ s (2002), and Hudson’ s (2010) study results.
W e explain the results of impacts of different levels of education by using simple OLS regressions on income of the participants of urban the informal sector. Results are described in table 5.3.
Table 5.3
OLS regressions on the income of the participants of urban informal sector
Variables Coefficients t-statistics
C 2.9607 28.5941
AGY 0.0030*** 1.4935
EDUII 0.2309* 3.2797
EDUIII 0.3975* 6.2453
EDUIV 0.4553* 6.0183
EDUVI 0.7981* 11.1842
TRN 0.0771*** 1.8927
SEX 0.15008* 3.5047
MRS 0.0867*** 1.9179
HVAT 5.75E-08** 2.4450
WWH 0.0074* 4.3563
R Square 0.4682 F-Statistics 25.1348 Adjusted R2 0.4496 P 0.00000
Size of Sample 326
Note: Val ues are calculated using the data col l ected from district Multan * si gni fi cant at 1% l evel
* * si gni fi cance at 5% l evel * * * si gni fi cant at 10% l evel
Variable for levels of education is described in Table 5.3. Taking into account the results of equations with levels of education in table (5.3), it is clear that returns for levels of education are highly significant for urban informal sector participants in District Multan. This trend indicates that earnings are positively associated with increasing education level. The earnings tend to increase as the level of educational attainment increases in total sample.
It is concluded that education is an essential in the variation of earnings. The positive association of education and earnings confirm the hypothesis that education is an investment that has good returns in labor market. Overall, the results may conclude that all human capital variables and other socio economic variables are significant on the whole in urban informal sector of district Multan.
5.
Conclusion
The present study examines the earning determinants with respect to human capital variables and other socio economic variables by collecting data through sample survey in 2012 district Multan. Findings demonstrate that all of the explanatory variables have a positive influence on earnings of urban informal sector participants. It is found that education is particularly crucial for informal sector participants to boost up their earnings. This study results supports the results of the studies by Kozel and Alderman (1991); Sargana (1998); Samith, (2001) and Hudson, 2010. The study results support the Mincern’ s (1974) specification of the earnings function. On the other hand age, education, training, sex, marital status, and household value of assets and working hours are found to be positive and statistically significant. These
variables have the similar results with above-mentioned authors.
Some policy measures are suggested below
sector in irregular working hours to enhance their efficiency. There is a need to protect the urban informal sector from the harassment of the police and other local authorities in order to improve the growth and working conditions of the participants of urban informal sector in Multan.
Notes and References
Ashraf, J. & Ashraf, B. (1993). An Analysis of the Male-female Earning Differentials in Pakistan. The Paki stan Devel opment revi ew. 32(4). 895-904, winter (1993).
Banerjee, B. (1983). The Role of Informal Sector in the Migration Process: A test of Probabilistic Migration Models and Labor Market Segmentation for India. Oxford Economic Papers 35(1983), 399-422.
Becker, Gary S. (1964). Human Capital. New York: Columbia University Press.
Berlaffa, G; Folloni, G & Ghedini, R.B. (2007). Human Capital and Earnings: The Role of Informality. PRIN 2004-133384, 9 February 2007.
Burki, A. A & Abbas, Q. (1991). Earning functions in Pakistan’ s Urban Informal Sector: A Case study, The Paki stan Devel opment Revi ew. 30(4). 695-706.
Ewoudou, J &Vencatachellum, D. (2006). An Empirical Analysis of the Rates of Returns to Education in Cameroon. Jel Classifications: 121, j31.
Government of Pakistan, (1990). District Census Report of Multan. Population Census Organization, Statistics Division, GOP, Islamabad.
ILO, (1972). Employment, Incomes and Equality: A Strategy for Increasing Productive Employment in Kenya. ILO, Geneva.
Kozel, V & Alderman. H. (1990). Factors Determining W ork participation and Labor Supply Decisions in Pakistan’ s Urban Areas. The Pakistan devel opment Revi ew. 29(1), 1-18.Spring (1990).
for Public policy research and analysis (KIPRA) Discussion paper No.13, April 2002.
Nasir, Z.M. (2002). Human Capital in Pakistan: A Gender Disaggregated Analysis. The Paki stan Devel opment Revi ew. 41(1). 1-28.
Qui & Hudson. (2010). Private Returns to Education in Urban China, Econo Change Restruct. 43: 131-150.
Sargana, M.A. (1998). The Urban Informal Sector in an Adjusting Economy: The case of Pakistan. The Paki stan Devel opment Revi ew.
37(4). 11-27.W inter 1998.
Smith, W .J. (2001). Estimates of the Effects of Education and Training on Earnings, Report No.54 January 2001.
W ahba, J. (2002). The Return to Education and Regional Earnings Differentials in Egypt, Discussion Papers in Economics and Econometrics 2000, Jel: j7, J31.
1 See several authors (ILO, 1972; W eeks, 1975; Bromely; 1978; Castels et al. 1989 and Quientin, 2006).
2 Pakistan Economic Survey 2011-12
3 Regarding education study results support Banergee’ s (1983) results.
4 The result supports Banergee’ s (1983) and Kozel and Alderman’ s (1990) results.
5 The findings support Banergee’ s (1983) and Kozel and Alderman’ s (1990) findings.
6 Similar regression technique was used by Banergee (1983).
7 Similar study was made by Burki and Ubaidullah (1992).
8 W ith regard to experience, the study results are consistent with Banergee’ s (1983) findings.
9 The similar model was used by Sargana (1998).
10 Results support Sargana’ s (1998) study results.
11 Results support methodology adopted by Vencatachelleum (2006).