August 2016 95 *Corresponding author:
E-mail: [email protected] ISSN 0126-0472 EISSN 2087-4634
Accredited by DGHE No: 66b/DIKTI/Kep/2011
Media Peternakan, August 2016, 39(2):95-103 DOI: 10.5398/medpet.2016.39.2.95 Available online at http://medpet.journal.ipb.ac.id/
Polymorphism of Myostatin (MSTN) Promoter Gene and its Association with Growth
and Muscling Traits in Bali Cattle
H. Khasanah
a, A. Gunawan
b, R. Priyanto
b, M. F. Ulum
c,
& Jakaria
b,*
aStudy Program of Animal Production and Technology, Faculty of Animal Science, Graduate School, Bogor Agricultural University
bDepartment of Animal Production and Technology, Faculty of Animal Science, Bogor Agricultural University cDepartment of Clinic, Reproduction and Pathology, Faculty of Veterinary Medicine, Bogor Agricultural University
Jalan Agatis, Kampus IPB Darmaga Bogor 16680, Indonesia (Received 12-05-2016; Reviewed 17-06-2016; Accepted 19-07-2016)
ABSTRACT
Myostatin (MSTN) gene plays a key role in skletal muscle homeostasis such as inducing muscle
athrophy, poliferation of myoblast, increasing ubiquitin-proteasomal, downregulating IGF pathway,
and glucolysis.
Myostatin gene expression is controled by CpG island located in promoter region. The
objectives of this research were to identify polymorphism of MSTN promoter gene and to associate
the polymorphism of SNP with growth and muscling traits in Bali cattle. A total of 48 Bali cattle from
BPTU-HMT Bali island was screened to identify genetic polymorphisms in MSTN promoter region
using sequencing method. The growth and muscling traits were measured at 12 months of age. The
mus-cling traits were evaluated using ultrasound console with linear transducer having frequency 6.5 Hz and
scaning we conducted at 130 mm in deep. Analysis of polymorphism was conducted by using PopGen
1.32 software. The association of MSTN with growth and muscling traits were analyzed by using
General Linear Model (GLM) procedure. This result showed that a total of 20 polymorphic SNPs (seven
SNPs in CpG island) were detected in this region. Although, only 3 SNPs (g.-8078C>T, g.-7996G>C, and
g.-7930A>G) had equilibrium condition in Hardy-Weinberg analysis. The association result showed that
2 SNPs (g.-7799T>C and g.-7941C>T) were significantly associated with intramuscular fat percentage
(P≤0.05) in Bali cattle. Although the 2 SNPs were nominally significant at nominal P≤0.05 threshold, they
were not significant after Bonferroni correction for multiple testing. It could be concluded that MSTN
promoter gene was polymorphic in Bali cattle and there were 2 SNPs associated with carcass quality.
Key words: Bali cattle, CpG island, myostatin gene, polymorphism, SNP
ABSTRAK
Gen myostatin (MSTN) berperan dalam homeostasis otot rangka seperti induksi athrophy otot,
myosblast poliferasi, peningkatan
ubiquitin-proteasomal
, penurunan pathway IGF dan glikolisis.
Ekspresi gen myostatin (MSTN) dikontrol oleh
CpG island
yang berlokasi di
promoter.
Tujuan dari
penelitian ini adalah mengidentifikasi polimorfisme dari
promoter
gen MSTN dan mengasosiasikan
polimorfisme dari SNP dengan sifat pertumbuhan dan perdagingan pada sapi Bali. Sebanyak 48 sapi
Bali yang berasal dari BPTU-HMT pulau Bali diidentifikasi polimorfisme dari gen MSTN bagian
pro-moter
menggunakan metode sekuensing
.
Sifat pertumbuhan dan perdagingan diukur pada umur 12
bulan. Sifat perdagingan diukur menggunakan ultrasonografi dengan linier transduser dan pembacaan
pada frekuensi 6,5Hz dan kedalaman 130 mm. Analisis polimorfisme dilakukan menggunakan software
Popgen 1.32. Asosiasi gen MSTN dengan sifat pertumbuhan dan perdagingan dianalisis dengan
meng-gunakan prosedur
General Linear Model
(GLM). Hasil penelitian ini menunjukkan sebanyak 20 SNP yang
polimorfik ditemukan di daerah ini (7 SNP berada pada posisi CpG island
). Namun, hanya ada 3 SNP,
yaitu g.-8078C>T, g.-7996G>C and g.-7930A>G yang ditemukan dalam keadaan seimbang berdasarkan
analisis Hardy-Weinberg. Hasil asosiasi ditemukan bahwa SNP g.-7799T>C dan g.-7941C>T berasosiasi
nyata dengan sifat persentase lemak intramuskuler (P≤0,05). Meskipun 2 SNP tersebut signifikan pada
P≤0,.05, namun tidak signifikan setelah dikoreksi Bonferroni untuk uji berganda.
Dapat disimpulkan
bahwa gen promotor MSTN polimorfik pada sapi bali dan terdapat 2 SNP yang berasosiasi dengan sifat
kualitas karkas.
INTRODUCTION
The myostatin (MSTN) gene is well-known as
growth and differentiation factor 8 (GDF8) that is
belonging to a member of
transforming growth factor
β
(TGF-β super family). This gene consists of 3 exons
and 2 introns (Kambadur
et al.
, 2004). Myostatin gene
has been located close to the centromere of bovine
chromosome 2 (BTA 2) and encoded 375 amino acids
then produce myostatin protein with 26 kDa molecular
weight (Kambadur
et al.,
2004). Myostatin plays a key
role in skletal muscle homeostasis such as inducing
muscle athrophy, poliferation of myoblast, increasing
ubiquitin-proteasomal, down regulating IGF pathway,
and glukolisis (Elliott
et al.,
2012). The function of MSTN
gene was an inhibitor (negative regulator) of
prolif-eration and differentiation of cell cycle during myogen
-esis in embryonic and adult cell (Miyake
et al.,
2010).
Kambadur
et al.
(2004) have identified that absence of
myostatin affected increasing of skeletal muscle mass.
This increment is due to a combination of hyperplasia
(increasing muscle number) and hypertrophy
(increas-ing muscle size).
Based on gene structure, MSTN has a CpG island,
a region with repetitive of GC sequences that 70%-80%
find in promoter of gene (Illingworth
et al.,
2010). The
distribution of transcription initiation is usually over
a region of 50-100 bp and there are appearance of the
CpG island and lack of TATA box (Carninci et al.,
2006).
The function of genome platforms for regulating
tran-scription associated with promoter especially in a CpG
island which has a role as genomic platforms to regulate
transcription (Deaton
et al.,
2011). In addition, the CpG
island was common for methylation among the region
of the promoter attributing of chromatin condense
and gene silencing (Sellner
et al.,
2007). Methylation
of imprinted gene can increase or decrease the level of
transcription, depending on a positive (suppressor)
or negative (repressor) regulatory (Smith & Meissner,
2013). In vertebrates, the CpG island is distinct owing
to their lack of DNA methylation and absences of CpG
deficiency (Deaton et al.,
2011). Mutation in CpG island
of MSTN gene could change the regulation of expres
-sion via the generated CpG island and/or changed target
sites for transcriptional regulator (Doherty
et al
., 2014).
Mutation in MSTN gene in cattle showed different
characteristics such as increasing of birth weight, higher
muscling, faster growing, hyperplasia and hypertrophy
in muscle (Kambadur
et al.,
2004). Previous research has
identified MSTN gene in cattle intensively such as in
Hanwoo cattle (Han
et al.,
2012), Qinchuan cattle (Zhang
et al.,
2007), Nellore cattle (Grisolia
et al.,
2009), Angus
cattle (Gill
et al.,
2009), and Marchigiana cattle (Sarti
et
al.,
2014).
Bali cattle (Bos javanicus
) is one of Indonesian origin
genetic resources that domesticated from bull (
Bibos
ban-teng) (Martojo et al., 2012). Bali cattle have potential to be
beef cattle because well adapted in harsh environment,
able to grow in marginal feed condition, high
fertil-ity and conception rate than other breeds (Purwantara
et al., 2012). However, the utilization of Bali cattle is
not optimal yet to produce meat in high quantity and
quality. Improving Bali cattle quality by
selection was
conducted based on phenotypics data (conventional
method) which has susceptibility that their
environ-ment impact. Selection using marker assisted selection
(MAS) could be one of promising method for
selec-tion in cattle because it is more accurate, effective and
effisien (Goddard & Hayes, 2007; Gorjanc
et al.,
2015).
Therefore, improving Bali cattle genetic quality based
on MAS using potential gene such as MSTN gene needs
to be done on Bali cattle
.
The objective of this research
was to identify the Single Nucleotide Polymorphism
(SNP) of the MSTN gene in Bali cattle related to growth
and muscling traits using direct sequencing method.
The analyses of genotype and allele frequency were
per-formed to elucidate polymorphism of this gene in Bali
cattle. Association of MSTN with growth and muscling
traits were also performed to identify significant SNP
and its candidate for the genetic marker.
MATERIALS AND METHODS
Animal and Phenotypic Data Source
A total 48 of Bali cattle were used (12-15 month of
ages) in this study that consisted of 24 heifers and 24
steers from BPTU-HMT Denpasar, Bali Province. All
of samples were risen in same paddock and feeding
management. Each cattle was fed with grass (
Pennisetum
purpureum
and
Phaspalum notatum
) in the amount of 10%
of body weight and feed concentrate as much as 1% of
body weight. The phenotypic variables that observed
were growth traits including birth weight (BW),
wean-ing weight (WW), yearlwean-ing weight (YW), average daily
gain (ADG), chest circumference (CC), body length (BL),
and shoulder height (SH). Growth traits were measured
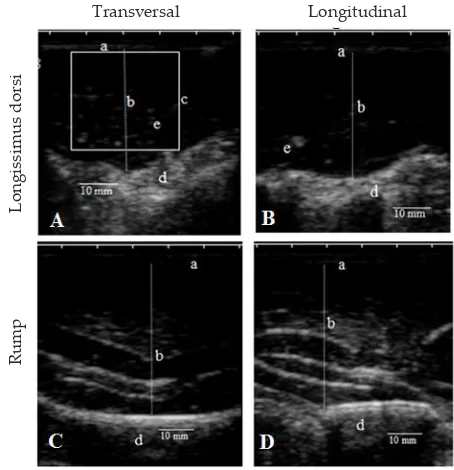
based on BSN (2015). The muscling traits were
evaluat-ed using ultrasound console with linier transducer
hav-ing frequency 6.5 Hz and scnhav-ing were conducted with
deep of 130 mm at transversal and longitudinal views.
The muscling traits of ultrasound longissimus dorsi
thickness (LDT), ultrasound back fat thickness (BFT),
ultrasound rump thickness (RT), ultrasound rump fat
thickness (RFT), ultrasound marbling score (MS) and
Intramuscular fat percentage (PIMF) were assessed in
this study. The measurement of LDT and BFT were
car-ried out on the 12
th-13
rdribs, two third from medial
to lateral side models (Gupta
et al.,
2013; Melendez
& Marchello, 2014) (Figure 1). The variables RT and
RFT were measured between ileum and ischium (Silva
et al.,
2012) modified. In brief, the measurement of MS
carried out according to AUS MET and MSA marbling
reference standard. The percentage of IMF was carried
out according to Deaton
et al.
(2000) on 12
th-13
rdribs with
region of interest by 30 x 30 mm. The image results were
analyzed by using Image-J NIH software (ImageJ ®,
NIH, USA) (Figure 1). The general description of growth
and muscling traits are shown in Table 1.
Genome Extraction and Amplification
Approximately 10 mL blood per cattle was col
August 2016 97
tube containing anticoagulant of EDTA under
tempera-ture of 4°C. Genome extracted by using genomic DNA
mini Kit (GeneAid DNA Ltd, Taiwan). The quality of
total genome extractionswas performed by 1% agarose
gel electrophoresis and was checked using
spectro-photometry. The pairs of primer were used to
am-plify part of MSTN promoter gene. The forward primer:
5’-CCAACTATCCACCAGTAA-3’ and the reverse
primer: 5’-ACGACCAACCCTAACC-’3 were designed
according to bovine MSTN gene (GenBank: AF348479.1)
by using primer designing tool program (http://www.
ncbi.nlm.nih.gov/tools/primer-blast/) and primer
stat program (http://www.bioinformatics.org/sms2/
pcr_primer_stats.html). PCR reaction of MSTN gene was
50 µL consisted of 2 µL DNA sample, 22.6 µL distilled
water, 0.2 µL forward and 0.2 µL reverse primers, and
25 µL GoTaq Promega Green MM. The PCR conducted
in GeneAmp® PCR System 9700 Applied Biosystem
Thermalcycler. Amplification condition consisted of
predenaturation at 95°C 5 min followed by 35 cycles of
denaturation at 95°C for 10 s, amplification at 63
°C for
20 s, extention at 72°C for 30 s, and a final extension at
72°C for 5 min. The DNA amplification products were
checked on 1.5% agarose gels in 0.5 x TBE running buf
-fer and stained with EtBr then were visualized in UV
trans-illuminator.
SNP Identification
Sequencing was performed for all of Bali cattle sam
-ples to define SNP in MSTN promoter region. Forward
and reverse primer fragments were sequenced using
sequencer machine (ABI Prims 3100-Avant Genetic
Analyzer) in 1
stBase Selangor, Malaysia. The
sequenc-ing results were aligned ussequenc-ing MEGA software (Tamura
et al.,
2011) to establish SNP. The BLAST (Basic Local
Alignment Search Tool) program was used to search
reference and homologous sequences in GenBank
database.
Data Analysis
The genotypic and allelic frequencies from SNP,
heterozygosity and Hardy-Weinberg equilibrium were
calculated using PopGen program (Yeh
et al.,
1999).
The association of MSTN gene and growth trait was
analyzed by ANOVA PROC GLM and Duncan multiple
ranget test (DMRT) procedure of SAS (SAS Inst., 2008).
Furthermore, we also conducted Bonferroni correction
for multiple testing. The statistical model used as
fol-lows the formulas below: Y
ijk= µ +
α
i+
β
j+
ε
ijwhere
Y
ijkis the mean value of the trait; µ is the general
mean; α
iis the fixed effect of MSTN genotype (i= 1, 2, 3);
β
jis the fixed effect of sex (j= 1, 2); ε
ijis the random error.
RESULTS
Polymorphism of MSTN Promoter Gene in Bali Cattle
Result of PCR amplification consisting of 535 bp
PCR products with 100 bpmarker was showed in Figure
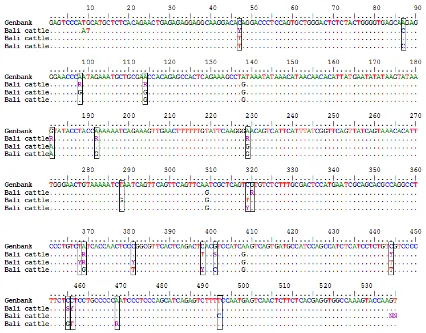
2. Bali cattle sequences of MSTN gene were aligned
with GenBank AF348479 by MEGA blast tools
result-ing 20 polymorphic SNPs in the promoter region. The
polymorphisms of MSTN promoter gene were caused
by transversion mutation at g.-8350C>T, g.-8310A>C,
g.-8299G>A, g.-8283A>G, g.-8216G>A, g.-8205A>G,
g.-8168A>G, g.-8109T>G, g.-8078C>T, g.-8077G>A,
g.-8029T>C,
g.-8028A>G
,
g.-8016C>T
, 7799T>C,
g.-Table 1. Overall growth and muscling traits in Bali cattleTraits n Means SD Max Min
Birth weight (Kg) 48 17.19 1.32 22.00 15.00 Weaning weight (Kg) 48 57.05 10.91 81.02 40.57 Yearling weight(Kg) 48 88.10 19.44 128.65 59.71 Average daily gain
(Kg)
48 0.18 0.08 0.30 -0.05
Shoulder height (cm) 48 91.91 5.48 106.00 82.00 Body length (cm) 48 84.47 6.76 100.00 71.00 Chest circumtance
(cm)
48 108.91 9.18 133.00 94.00
Longissimus dorci thickness (mm)
31 30.02 4.88 38.52 22.26
Back fat thickness (mm)
31 1.27 0.29 2.04 0.83
Rump thickness (mm)
31 36.40 4.82 46.35 28.67
Rump fat thickness (mm)
31 0.94 0.27 1.60 0.46
Marbling score 31 1.87 0.88 3.40 0.00
Percentage of IMF (%)
31 3.13 1.62 6.71 0.51 Figure 1. Ultrasound of muscling traits in Bali cattle (A) and (B)
longissimus dorsi at 12th-13rd rib; (C) and (D) rump; (a) fat thickness, (b) muscle thickness, (c) region of interest of Intramuscular fat percentage (PIMF), (d) bone.
98 August 2016
7953C>T, g.-7941C>T, g.-7930A>G, g.-7905T>C, and
tran-sition mutation at g.-7996G>C and g.-7942C>G (Figure
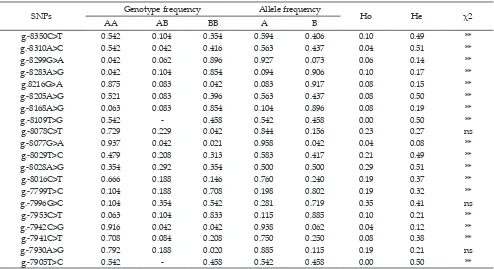
3). The frequencies of genotype and allele were showed
in Table 2. Mostly, SNPs had 3 genotypes except SNP
g.-8109T>G andg.-7905T>C, there were only homozygote
genotype. The highest heterozygosity was found in SNP
g.-7996G>C. In addition, the smallest heterozigosity
were g.-8109T>G and g.-7905T>C having 0.000 value due
to no heterozygote genotype found (Table 2). This
re-search found that only 3 SNP in equilibrium condition,
they were g.-8078C>T, g.-7996G>C, and g.-7930A>G
(Table 2).
CpG Island Prediction in MSTN Promoter Gene
The sequence target of amplification was in pro
-moter region which had CpG island (prediction using
http://www.urogene.org/methprimer/). This prediction
using criteria with minimum sequence length was
>100bp, GC percentageis >50% and Obs/Exp ratio
was >0.6. Seven mutation was found in CpG island
re-gion, they were g.-7799T>C, g.-8078C>T, g.-8077G>A,
8029T>C, 8028A>G, 8016C>T, 8016C>T,
g.-7799T>C. This mutation might be affected the absences
of CpG island in Bali cattle sequence (Figure 4).
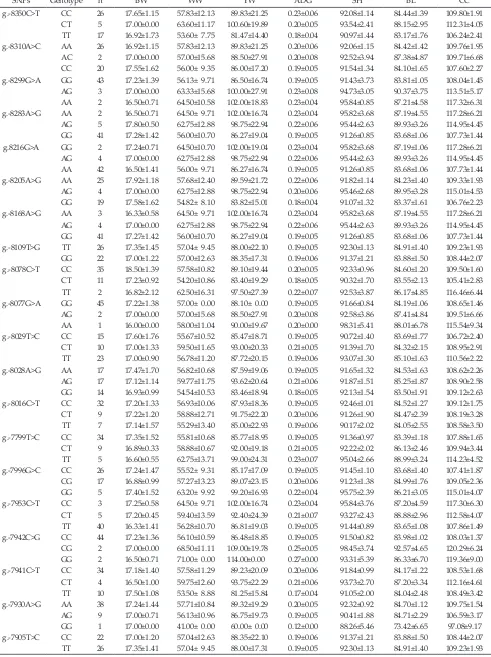
Association Analysis
The association analysis showed that no growth
traits were significantly associated with SNPs in MSTN
promoter gene in Bali cattle (P<0.05) (Table 3). In this
result also showed that SNPs had no association with
muscling traits, except 2 SNPs (
7799T>C and
g.-7941C>T) which had
significant effect on PIMF (P<0.05)
(Table 4). In the SNP
g.-7799T>C, TT genotype has
higher PIMF than CT and CC genotype in the SNP
g.-7941C>T has higher PIMF than TT. Although the 2 SNPs
Figure 2. Amplification myostatin gene promoter in Bali cattle (line 1-4; 535 bp); M: 100bp ladder.
398
399
400
401
402
403
404
405
M 1 2 3 4
1000 bp
500 bp 400 bp
300 bp 200 bp
100 bp
535 bp
Figure 3. SNPs in myostatin promoter gene in Bali cattle
406
407
408
409
410
August 2016 99
SNPs Genotype frequency Allele frequency Ho He χ2
AA AB BB A B
g.-8350C>T 0.542 0.104 0.354 0.594 0.406 0.10 0.49 **
g.-8310A>C 0.542 0.042 0.416 0.563 0.437 0.04 0.51 **
g.-8299G>A 0.042 0.062 0.896 0.927 0.073 0.06 0.14 **
g.-8283A>G 0.042 0.104 0.854 0.094 0.906 0.10 0.17 **
g.8216G>A 0.875 0.083 0.042 0.083 0.917 0.08 0.15 **
g.-8205A>G 0.521 0.083 0.396 0.563 0.437 0.08 0.50 **
g.-8168A>G 0.063 0.083 0.854 0.104 0.896 0.08 0.19 **
g.-8109T>G 0.542 - 0.458 0.542 0.458 0.00 0.50 **
g.-8078C>T 0.729 0.229 0.042 0.844 0.156 0.23 0.27 ns
g.-8077G>A 0.937 0.042 0.021 0.958 0.042 0.04 0.08 **
g.-8029T>C 0.479 0.208 0.313 0.583 0.417 0.21 0.49 **
g.-8028A>G 0.354 0.292 0.354 0.500 0.500 0.29 0.51 **
g.-8016C>T 0.666 0.188 0.146 0.760 0.240 0.19 0.37 **
g.-7799T>C 0.104 0.188 0.708 0.198 0.802 0.19 0.32 **
g.-7996G>C 0.104 0.354 0.542 0.281 0.719 0.35 0.41 ns
g.-7953C>T 0.063 0.104 0.833 0.115 0.885 0.10 0.21 **
g.-7942C>G 0.916 0.042 0.042 0.938 0.062 0.04 0.12 **
g.-7941C>T 0.708 0.084 0.208 0.750 0.250 0.08 0.38 **
g.-7930A>G 0.792 0.188 0.020 0.885 0.115 0.19 0.21 ns
g.-7905T>C 0.542 - 0.458 0.542 0.458 0.00 0.50 **
Note: AA= reference genotype; AB= heterozygote genotype; BB= mutant genotype; A= reference allele; B= mutant alelel; Ho= observed heterozygosis; He= expected heterozygosity; χ2= Hardy-Weinberg equilibrium; (ns) not significant at α 5% (X2 obs≥ 3.84); (**) significant at α 1% (X2 obs≥ 6.64); n= 48 heads.
Table 2. Polymorphisms of myostatin gene promoter in Bali cattle
Figure 4. CpG island prediction in promoter myostatin gene in Bali cattle
are nominally significant at nominal P≤0.05 threshold,
they are not significant after Bonferroni correction for
multiple testing.
DISCUSSION
Polymorphism of Myostatin Promoter Gene
The SNPs in this research was polymorphic which
represented by allele frequency lower than 0.99 or
al-lel frequency higher than 0.01 (Nei & Kumar, 2000).
Heterozygosity value showed that all of SNPs in low
diversity condition (Ho≤0.5) (Allendrof
et al.,
2013).
Based on chi-square
(χ
2) analyses, only 3 SNPs in Bali
cattle were in equilibrium condition (SNPs
g.-8078C>T,
SNPs Genotype n BW WW YW ADG SH BL CC
g.-8350C>T CC 26 17.65±1.15 57.83±12.13 89.83±21.25 0.23±0.06 92.08±1.14 84.44±1.39 109.80±1.91 CT 5 17.00±0.00 63.60±11.17 100.60±19.89 0.20±0.05 93.54±2.41 88.15±2.95 112.31±4.05 TT 17 16.92±1.73 53.60± 7.75 81.47±14.40 0.18±0.04 90.97±1.44 83.17±1.76 106.24±2.41 g.-8310A>C AA 26 16.92±1.15 57.83±12.13 89.83±21.25 0.20±0.06 92.06±1.15 84.42±1.42 109.76±1.95 AC 2 17.00±0.00 57.00±15.68 88.50±27.91 0.20±0.08 92.52±3.94 87.38±4.87 109.71±6.68 CC 20 17.55±1.62 56.00± 9.35 86.00±17.20 0.19±0.05 91.54±1.34 84.10±1.65 107.60±2.27 g.-8299G>A GG 43 17.23±1.39 56.13± 9.71 86.50±16.74 0.19±0.05 91.43±3.73 83.81±1.05 108.04±1.45 AG 3 17.00±0.00 63.33±15.68 100.00±27.91 0.23±0.08 94.73±3.05 90.37±3.75 113.51±5.17 AA 2 16.50±0.71 64.50±10.58 102.00±18.83 0.23±0.04 95.84±0.85 87.21±4.58 117.32±6.31 g.-8283A>G AA 2 16.50±0.71 64.50± 9.71 102.00±16.74 0.23±0.04 95.82±3.68 87.19±4.55 117.28±6.21 AG 5 17.80±0.50 62.75±12.88 98.75±22.94 0.22±0.06 95.44±2.63 89.93±3.26 114.95±4.45 GG 41 17.28±1.42 56.00±10.70 86.27±19.04 0.19±0.05 91.26±0.85 83.68±1.06 107.73±1.44 g.8216G>A GG 2 17.24±0.71 64.50±10.70 102.00±19.04 0.23±0.04 95.82±3.68 87.19±1.06 117.28±6.21 AG 4 17.00±0.00 62.75±12.88 98.75±22.94 0.22±0.06 95.44±2.63 89.93±3.26 114.95±4.45 AA 42 16.50±1.41 56.00± 9.71 86.27±16.74 0.19±0.05 91.26±0.85 83.68±1.06 107.73±1.44 g.-8205A>G AA 25 17.92±1.18 57.68±12.40 89.59±21.72 0.22±0.06 91.82±1.14 84.23±1.40 109.33±1.93 AG 4 17.00±0.00 62.75±12.88 98.75±22.94 0.20±0.06 95.46±2.68 89.95±3.28 115.01±4.53 GG 19 17.58±1.62 54.82± 8.10 83.82±15.01 0.18±0.04 91.07±1.32 83.37±1.61 106.76±2.23 g.-8168A>G AA 3 16.33±0.58 64.50± 9.71 102.00±16.74 0.23±0.04 95.82±3.68 87.19±4.55 117.28±6.21 AG 4 17.00±0.00 62.75±12.88 98.75±22.94 0.22±0.06 95.44±2.63 89.93±3.26 114.95±4.45 GG 41 17.27±1.42 56.00±10.70 86.27±19.04 0.19±0.05 91.26±0.85 83.68±1.06 107.73±1.44 g.-8109T>G TT 26 17.35±1.45 57.04± 9.45 88.00±22.10 0.19±0.05 92.30±1.13 84.91±1.40 109.23±1.93 GG 22 17.00±1.22 57.00±12.63 88.35±17.31 0.19±0.06 91.37±1.21 83.88±1.50 108.44±2.07 g.-8078C>T CC 35 18.50±1.39 57.58±10.82 89.10±19.44 0.20±0.05 92.33±0.96 84.60±1.20 109.50±1.60 CT 11 17.23±0.92 54.20±10.86 83.40±19.29 0.18±0.05 90.32±1.70 83.55±2.13 105.41±2.83 TT 2 16.82±2.12 62.50±16.31 97.50±27.39 0.22±0.07 92.53±3.87 86.17±4.85 116.46±6.44 g.-8077G>A GG 45 17.22±1.38 57.00± 0.00 88.10± 0.00 0.19±0.05 91.66±0.84 84.19±1.06 108.65±1.46 AG 2 17.00±0.00 57.00±15.68 88.50±27.91 0.20±0.08 92.58±3.86 87.41±4.84 109.51±6.66 AA 1 16.00±0.00 58.00±11.04 90.00±19.67 0.20±0.00 98.31±5.41 88.01±6.78 115.54±9.34 g.-8029T>C CC 15 17.60±1.76 55.67±10.52 85.47±18.71 0.19±0.05 90.72±1.40 83.69±1.77 106.72±2.40 CT 10 17.00±1.33 59.50±11.65 93.00±20.33 0.21±0.05 91.39±1.70 84.32±2.15 108.95±2.91 TT 23 17.00±0.90 56.78±11.20 87.72±20.15 0.19±0.06 93.07±1.30 85.10±1.63 110.56±2.22 g.-8028A>G AA 17 17.47±1.70 56.82±10.68 87.59±19.06 0.19±0.05 91.65±1.32 84.53±1.63 108.62±2.26 AG 17 17.12±1.14 59.77±11.75 93.62±20.64 0.21±0.06 91.87±1.51 85.25±1.87 108.90±2.58 GG 14 16.93±0.99 54.54±10.53 83.46±18.94 0.18±0.05 92.13±1.54 83.50±1.91 109.12±2.63 g.-8016C>T CC 32 17.20±1.33 56.93±10.06 87.93±18.36 0.19±0.05 92.46±1.01 84.52±1.27 109.12±1.75 CT 9 17.22±1.20 58.88±12.71 91.75±22.20 0.20±0.06 91.26±1.90 84.47±2.39 108.19±3.28 TT 7 17.14±1.57 55.29±13.40 85.00±22.93 0.19±0.06 90.17±2.02 84.05±2.55 108.58±3.50 g.-7799T>C CC 34 17.35±1.52 55.81±10.68 85.77±18.95 0.19±0.05 91.36±0.97 83.39±1.18 107.88±1.65 CT 9 16.89±0.33 58.88±10.67 92.00±19.18 0.21±0.05 92.22±2.02 86.13±2.46 109.94±3.44 TT 5 16.60±0.55 62.75±13.71 99.00±24.31 0.23±0.07 95.04±2.66 88.99±3.24 114.23±4.52 g.-7996G>C CC 26 17.24±1.47 55.52± 9.31 85.17±17.09 0.19±0.05 91.45±1.10 83.68±1.40 107.41±1.87 CG 17 16.88±0.99 57.27±13.23 89.07±23.15 0.20±0.06 91.23±1.38 84.99±1.76 109.05±2.36 GG 5 17.40±1.52 63.20± 9.92 99.20±16.93 0.22±0.04 95.75±2.39 86.21±3.05 115.01±4.07 g.-7953C>T CC 3 17.25±0.58 64.50± 9.71 102.00±16.74 0.23±0.04 95.84±3.76 87.20±4.59 117.30±6.30 CT 5 17.20±0.45 59.40±13.59 92.40±24.39 0.21±0.07 93.27±2.43 88.88±2.96 112.58±4.07 TT 40 16.33±1.41 56.28±10.70 86.81±19.03 0.19±0.05 91.44±0.89 83.65±1.08 107.86±1.49 g.-7942C>G CC 44 17.23±1.36 56.10±10.59 86.48±18.85 0.19±0.05 91.50±0.82 83.98±1.02 108.03±1.37 CG 2 17.00±0.00 68.50±11.11 109.00±19.78 0.25±0.05 98.45±3.74 92.57±4.65 120.29±6.24 GG 2 16.50±0.71 71.00± 0.00 114.00±0.00 0.27±0.00 93.31±5.39 86.33±6.70 119.36±9.00 g.-7941C>T CC 34 17.18±1.40 57.58±11.29 89.23±20.09 0.20±0.06 91.84±0.99 84.17±1.22 108.53±1.68 CT 4 16.50±1.00 59.75±12.60 93.75±22.29 0.21±0.06 93.73±2.70 87.20±3.34 112.16±4.61 TT 10 17.50±1.08 53.50± 8.88 81.25±15.84 0.17±0.04 91.05±2.00 84.04±2.48 108.49±3.42 g.-7930A>G AA 38 17.24±1.44 57.71±10.84 89.32±19.29 0.20±0.05 92.32±0.92 84.70±1.12 109.75±1.54 AG 9 17.00±0.71 56.13±10.96 86.75±19.73 0.19±0.05 90.41±1.88 84.71±2.29 106.59±3.17 GG 1 17.00±0.00 41.00± 0.00 60.00± 0.00 0.12±0.00 88.26±5.46 73.42±6.65 97.08±9.17 g.-7905T>C CC 22 17.00±1.20 57.04±12.63 88.35±22.10 0.19±0.06 91.37±1.21 83.88±1.50 108.44±2.07 TT 26 17.35±1.41 57.04± 9.45 88.00±17.31 0.19±0.05 92.30±1.13 84.91±1.40 109.23±1.93 Table 3. Association of SNPs in MSTN promoter gene with growth traits in Bali cattle
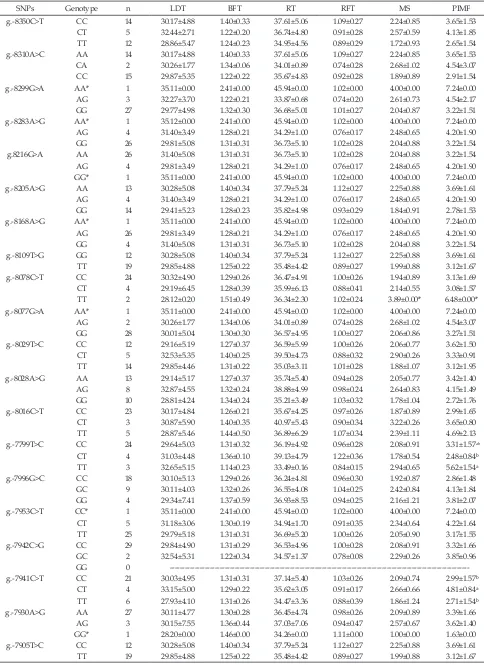
August 2016 101 Table 4. Association of SNPs in MSTN with muscling traits in Bali cattle
SNPs Genotype n LDT BFT RT RFT MS PIMF
g.-8350C>T CC 14 30.17±4.88 1.40±0.33 37.61±5.06 1.09±0.27 2.24±0.85 3.65±1.53 CT 5 32.44±2.71 1.22±0.20 36.74±4.80 0.91±0.28 2.57±0.59 4.13±1.85 TT 12 28.86±5.47 1.24±0.23 34.95±4.56 0.89±0.29 1.72±0.93 2.65±1.54 g.-8310A>C AA 14 30.17±4.88 1.40±0.33 37.61±5.06 1.09±0.27 2.24±0.85 3.65±1.53 CA 2 30.26±1.77 1.34±0.06 34.01±0.89 0.74±0.28 2.68±1.02 4.54±3.07 CC 15 29.87±5.35 1.22±0.22 35.67±4.83 0.92±0.28 1.89±0.89 2.91±1.54 g.-8299G>A AA* 1 35.11±0.00 2.41±0.00 45.94±0.00 1.02±0.00 4.00±0.00 7.24±0.00 AG 3 32.27±3.70 1.22±0.21 33.87±0.68 0.74±0.20 2.61±0.73 4.54±2.17 GG 27 29.77±4.98 1.32±0.30 36.68±5.01 1.01±0.27 2.04±0.87 3.22±1.51 g.-8283A>G AA* 1 35.12±0.00 2.41±0.00 45.94±0.00 1.02±0.00 4.00±0.00 7.24±0.00 AG 4 31.40±3.49 1.28±0.21 34.29±1.00 0.76±0.17 2.48±0.65 4.20±1.90 GG 26 29.81±5.08 1.31±0.31 36.73±5.10 1.02±0.28 2.04±0.88 3.22±1.54 g.8216G>A AA 26 31.40±5.08 1.31±0.31 36.73±5.10 1.02±0.28 2.04±0.88 3.22±1.54 AG 4 29.81±3.49 1.28±0.21 34.29±1.00 0.76±0.17 2.48±0.65 4.20±1.90 GG* 1 35.11±0.00 2.41±0.00 45.94±0.00 1.02±0.00 4.00±0.00 7.24±0.00 g.-8205A>G AA 13 30.28±5.08 1.40±0.34 37.79±5.24 1.12±0.27 2.25±0.88 3.69±1.61 AG 4 31.40±3.49 1.28±0.21 34.29±1.00 0.76±0.17 2.48±0.65 4.20±1.90 GG 14 29.41±5.23 1.28±0.23 35.82±4.98 0.93±0.29 1.84±0.91 2.78±1.53 g.-8168A>G AA* 1 35.11±0.00 2.41±0.00 45.94±0.00 1.02±0.00 4.00±0.00 7.24±0.00 AG 26 29.81±3.49 1.28±0.21 34.29±1.00 0.76±0.17 2.48±0.65 4.20±1.90 GG 4 31.40±5.08 1.31±0.31 36.73±5.10 1.02±0.28 2.04±0.88 3.22±1.54 g.-8109T>G GG 12 30.28±5.08 1.40±0.34 37.79±5.24 1.12±0.27 2.25±0.88 3.69±1.61 TT 19 29.85±4.88 1.25±0.22 35.48±4.42 0.89±0.27 1.99±0.88 3.12±1.67 g.-8078C>T CC 24 30.32±4.90 1.29±0.26 36.47±4.91 1.00±0.26 1.94±0.89 3.13±1.69 CT 4 29.19±6.45 1.28±0.39 35.99±6.13 0.88±0.41 2.14±0.55 3.08±1.57 TT 2 28.12±0.20 1.51±0.49 36.34±2.30 1.02±0.24 3.89±0.00* 6.48±0.00* g.-8077G>A AA* 1 35.11±0.00 2.41±0.00 45.94±0.00 1.02±0.00 4.00±0.00 7.24±0.00 AG 2 30.26±1.77 1.34±0.06 34.01±0.89 0.74±0.28 2.68±1.02 4.54±3.07 GG 28 30.01±5.04 1.30±0.30 36.57±4.95 1.00±0.27 2.06±0.86 3.27±1.51 g.-8029T>C CC 12 29.16±5.19 1.27±0.37 36.59±5.99 1.00±0.26 2.06±0.77 3.62±1.50 CT 5 32.53±5.35 1.40±0.25 39.50±4.73 0.88±0.32 2.90±0.26 3.33±0.91 TT 14 29.85±4.46 1.31±0.22 35.03±3.11 1.01±0.28 1.88±1.07 3.12±1.95 g.-8028A>G AA 13 29.14±5.17 1.27±0.37 35.74±5.40 0.94±0.28 2.05±0.77 3.42±1.40 AG 8 32.87±4.55 1.32±0.24 38.88±4.99 0.98±0.24 2.64±0.83 4.15±1.49 GG 10 28.81±4.24 1.34±0.24 35.21±3.49 1.03±0.32 1.78±1.04 2.72±1.76 g.-8016C>T CC 23 30.17±4.84 1.26±0.21 35.67±4.25 0.97±0.26 1.87±0.89 2.99±1.65 CT 3 30.87±5.90 1.40±0.35 40.97±5.43 0.90±0.34 3.22±0.26 3.65±0.80 TT 5 28.87±5.46 1.44±0.50 36.89±6.29 1.07±0.34 2.39±1.11 4.69±2.13 g.-7799T>C CC 24 29.64±5.03 1.31±0.32 36.19±4.92 0.96±0.28 2.08±0.91 3.31±1.57ab
CT 4 31.03±4.48 1.36±0.10 39.13±4.79 1.22±0.36 1.78±0.54 2.48±0.84ᵇ TT 3 32.65±5.15 1.14±0.23 33.49±0.16 0.84±0.15 2.94±0.65 5.62±1.54ᵃ g.-7996G>C CC 18 30.10±5.13 1.29±0.26 36.24±4.81 0.96±0.30 1.92±0.87 2.86±1.48
GC 9 30.11±4.03 1.32±0.26 36.55±4.08 1.04±0.25 2.42±0.84 4.13±1.84 GG 4 29.34±7.41 1.37±0.59 36.93±8.53 0.94±0.25 2.16±1.21 3.81±2.07 g.-7953C>T CC* 1 35.11±0.00 2.41±0.00 45.94±0.00 1.02±0.00 4.00±0.00 7.24±0.00 CT 5 31.18±3.06 1.30±0.19 34.94±1.70 0.91±0.35 2.34±0.64 4.22±1.64 TT 25 29.79±5.18 1.31±0.31 36.69±5.20 1.00±0.26 2.05±0.90 3.17±1.55 g.-7942C>G CC 29 29.84±4.90 1.31±0.29 36.53±4.96 1.00±0.28 2.08±0.91 3.32±1.66 GC 2 32.54±5.31 1.22±0.34 34.57±1.37 0.78±0.08 2.29±0.26 3.85±0.96 GG 0 ---g.-7941C>T CC 21 30.03±4.95 1.31±0.31 37.14±5.40 1.03±0.26 2.09±0.74 2.99±1.57ᵇ
CT 4 33.15±5.00 1.29±0.22 35.62±3.05 0.91±0.17 2.66±0.66 4.81±0.84ᵃ TT 6 27.93±4.10 1.31±0.26 34.47±3.36 0.88±0.39 1.86±1.24 2.71±1.54ᵇ g.-7930A>G AA 27 30.11±4.77 1.30±0.28 36.45±4.74 0.98±0.26 2.09±0.89 3.39±1.66
AG 3 30.15±7.55 1.36±0.44 37.03±7.06 0.94±0.47 2.57±0.67 3.62±1.40 GG* 1 28.20±0.00 1.46±0.00 34.26±0.00 1.11±0.00 1.00±0.00 1.63±0.00 g.-7905T>C CC 12 30.28±5.08 1.40±0.34 37.79±5.24 1.12±0.27 2.25±0.88 3.69±1.61 TT 19 29.85±4.88 1.25±0.22 35.48±4.42 0.89±0.27 1.99±0.88 3.12±1.67
Note: Means in the same column with different superscripts differ significantly (P<0.05); LTD= Longissimus dorsi thickness; BFT= Back fat thickness; RT= Rump thickness; RFT= Rump fat thickness; MS= Marbing score; PIMF= Intramuscular fat percentage.
superior bull.
The mutation in Bali cattle is likely due to
the efforts of these cattle to adapt harsh environmental
conditions. The
Ho value lower than He indicated that
an inbreeding probability were occured in this
popula-tion (Nassiry
et al.,
2009). Polymorphism in promoter
region was also identified by He
et al.
(2013) at locus
-371 of MSTN promoter gene which has 18 polymorphic
SNPs in Qinchuan cattle.
The most valuable meat is
from longissimus dorsi which is in this research overall
average of LDT and BFT were 33.047±5.077 mm and
1.455±0.348 mm, respectively. Putri
et al.
(2015) showed
that LTD and BFT in adult Bali cattle (more than 3 years)
was 57.577 mm to 63.818 mm and 1.935 mm to 2.324
mm, respectively.
Association of Single Nucleotide Polymorphism
(SNPs) in Myostatin Promoter Region with
Growth and Muscling Traits in Bali Cattle
The study revealed that there were no SNPs in
promoter region of MSTN gene in Bali cattle had sig
-nificant association with growth traits (P<0.05). Zhang
et
al.
(2007) also found no significant association between
MSTN promoter with birth weight, body weight at 6,
12, 18, and 24 mo. The lack of association between the
SNPs in MSTN gene and growth traits was also found
in Hanwoo cattle (Han
et al.,
2012). Furthermore,
asso-ciation of MSTN promoter gene showed no significant
effect on morphological measurement as performed by
Sarti
et al.
(2014).
Two SNPs in MSTN promoter region (
g.-7799T>C
and g.-7941C>T)
showed significant association with
PIMF (P<0.05) (Table 4).
Han
et al.
(2012) found
as-sociation between MSTN promoter gene with meat
quality index and fat colour index in Hanwoo cattle. The
genotype of AA and AT in Hanwoo cattle had higher
meat quality index and fat colour index than AA geno
-type.
The expression of MSTN gene is inversely related
to the
other myogenic expression (Shibata
et al.,
2006).
However, MSTN expression did not disturbed
other
myogenic expressions, such as Myog, Myf5, and MyoD
and increased muscle mass. Futhermore, this
muta-tion was able to reduce adiposity both of white fat and
brown fat affected by neighboring muscle fiber (Li et al.,
2015). Myostatin significantly inhibited differentiation
of preadipocyte by cytokine from muscle fiber (Li
et
al.,
2015). Moreover, they play cross role in muscle-fat
which might regulate fat ratio in muscle such as IMF
percentage (Sun
et al.,
2016). Promoter sequence was
analysed in mammalian like cattle, pig, sheep, goat, hu
-man and mice. The mutation in TATA, CACCC, and AT1
has significantly decreased promoter activity, although
mutation in AT2 and PAL likely to increase promoter
activity (Allen & Du, 2008).
CONCLUSION
It could be concluded that myostatin (MSTN)
promoter gene was polymorphic in Bali cattle and there
were 2 SNPs (g.-7799T>C and g.-7941C>T) associated
with carcass quality.
ACKNOWLEDGEMENT
This research was financially supported by
Ministry of Research Technology and Higher Education
(12/SEK/INSINAS/PPK/IV/2015) and Indonesia
Endowment Fund for Education. Authors also greatly
acknowledged the Bali cattle Breeding Centre
(BPTU-HMT) Bali Province for providing growth trait data and
blood sample of Bali cattle that used in this study.
REFERENCES
Allen, D. L. & M. Du. 2008. Comparative functional analy-sis of the cow and mouse myostatin genes reveals novel regulatory elements in their upstream promoter regions. Compar. Biochem. Physi. 150:432–439. http://dx.doi. org/10.1016/j.cbpb.2008.05.002
Allendrof, F. W., G. Luikart, & S. N. Aitken. 2013. Conserva-tion and the genetics of populaConserva-tions. 2nd Ed.
Wiley-Black-well Publishing, Chicester, UK.
[BSN] National Standarization Agency of Indonesia (in In-donesian: Badan Standarisasi Nasional). 2015. Bibit Sapi potong. Bagian 4: Bali. SNI 7651.4:2015. Badan Standarisasi Nasional, Jakarta.
Carninci, P., A. Sandelin, B. Lenhard, S. Katayama, K. Shi-mokawa, J. Ponjavic, C. A. Semple, M. S. Taylor, P. G. Engstrom, & M. C. Frith. 2006. Genome-wide analysis of mammalian promoter architecture and evolution. Nat. Genet. 38:626–635. http://dx.doi.org/10.1038/ng1789 Deaton, A. M. & A. P. Bird. 2011. CpG island and the regulation
of transcription. Genes Dev. 25:1010-1022.
Deaton, A. V., D. Wilson, & G. Rouse. 2000. USOFT: An ultra-sound image analysis software for beef quality research. Beef research report. A.S. Leaflet R1437. Iowa University. Iowa. http://dx.doi.org/10.1101/gad.2037511
Doherty, R., C. O’ Farrelly, & K. G. Meade. 2014. Comparative epigenetics: relevance to the regulation of production and health traits in cattle. Anim Genet. 45:3–14. http://dx.doi. org/10.1111/age.12140
Elliott B., D. Renshaw, S. Getting & R. Mackenzie. 2012. The central role of myostatin in skeletal muscle and whole body homesostasis. Acta Physiologica 205:324-340. http:// dx.doi.org/10.1111/j.1748-1716.2012.02423.x
Gill, J. L., S. C. Bishop, C. Mc Corquodale, J. L. Williams, & P. Wiener. 2008. Associations between the 11-bp deletion in the myostatin gene and carcass quality in Angus-sired cattle. Anim Genet. 40:97–100. http://dx.doi.org/10.1111/ j.1365-2052.2008.01790.x
Goddard, M. E. & B. J. Hayes. 2007. Genomic selection. J. Anim. Breed. Genet. 124:323–330. http://dx.doi.org/10.1111/ j.1439-0388.2007.00702.x
Gorjanc, G., M. A. Cleveland, R. D. Houston & J. M. Hickey. 2015. Potential of genotyping-by-sequencing for genomic selection in livestock populations. GSE. 47:1-13. http:// dx.doi.org/10.1186/s12711-015-0102-z
Grisolia, A. B., G. T. D’Angelo, L. R. P. Neto, F. Siqueira, & J. F. Garcia. 2009. Myostatin (GDF8) single nucleotide poly-morphisms in Nellore cattle. Genet. Mol. Rese. 8:822-830. http://dx.doi.org/10.4238/vol8-3gmr548
Gupta, S., A. Kumar, S Kumar, Z. F. Bhat, H. R. Hakeem, & A. P. S. Abrol. 2013. Recent trends in carcass evaluation techniques-a review. J. Meat. Sci. Tech. 1:50-55.
August 2016 103
He, Y. L., Y. H. Wu, F. S. Quan, Y. G. Liu, & Y. Zhang. 2013. Comparative analysis of myostatin gene and promoter se-quences of Qinchuan and Red Angus cattle. Genet. Mol. Res. 12:3398-3406. http://dx.doi.org/10.4238/2013.Septem -ber.4.6
Illingworth, R. S., U. Gruenewald-Schneider, S. Webb, A. R.
W. Kerr, K. D. James, D. J. Turner, C. Smith, D. J. Harri -son, R. Andrews, & A. P. Bird. 2010. Orphan CpG islands identify numerous conserved promoters in the mamma-lian genome. PLoS Genet. 6:1-15. http://dx.doi.org/10.1371/ journal.pgen.1001134
Kambadur, R., A Bishop, M. S. Salerno, S. McVroskery, & M. Sharma. 2004. Role of myostatin in muscle growth. P. 297-312. In: M. F. W Te Pas, M. E. Everts & H. P. Haagsman (ed). Muscle development of livestock animals physioly, genetic and meat quality. CABI, USA.
Li, N., Q. Yang, G. W. Ryan, B. Thomas, D. Min, & D. R. Buel.
2015. Myostatin attenuation in vivo reduces adiposity, but
activates adipogenesis. Endocrinology. 157:1-10.
Martojo, H. 2012. Indigenous Bali cattle is most suitable for sustainable small farming in Indonesia. Reprod. Dom. Anim. 47: 10–14. http://dx.doi.org/10.1111/j.1439-0531.2011.01958.x
Melendez, L. J. & J. A. Marchello. 2014. The efficacy of ultra -sound to determine certain carcass traits in grain-fed beef cattle. Inter. J. Sci. Comm. Hum. 2:145-154.
Miyake, M., S. Hayashi,Y. Taketa, S. Iwasaki, K. Watanabe, S.
Ohwada, H. Aso, & T. Yamaguchi. 2010. Myostatin down-regulates the IGF-2 expression via ALK-Smad signaling during myogenesis in cattle. Anim. Sci. Jour. 81:223–229. http://dx.doi.org/10.1111/j.1740-0929.2009.00725.x
Nassiry, M. R., A. Javanmard, & R. Tohidi. 2009. Application of statistical procedures for analysis of genetic diversity in domestic animal populations. American J. Anim. Vet. Sci. 4:136-141. http://dx.doi.org/10.3844/ajavsp.2009.136.141 Nei, M. & S. Kumar. 2000. Molecular Evolution and
Phyloge-netics. Oxford Univ Pr., New York.
Purwantara, B., R. R. Noor, G. Anderson, & H. Rodriguez-Martinez. 2012. Banteng and Bali cattle in Indonesia: status and forecasts. Reprod. Dom. Anim. 47:2-6. http:// dx.doi.org/10.1111/j.1439-0531.2011.01956.x
Putri, R., R. Priyanto, A. Gunawan, & Jakaria. 2015. Associa-tion of calpastatin (CAST) gene with growth traits and carcass characteristics in Bali cattle. Med Pet. 38:145-149. http://dx.doi.org/10.5398/medpet.2015.38.3.145
Sarti, F. M., E. Lasagna, S. Ceccobelli, P. Di Lorenzo, F. Filip-pini, F. Sbarra, & A. Giontella. 2014. Influence of single nucleotide polymorphism in myostatin and myogenic factor 5 muscle growth-related genes on the performance traits of Marchigiana beef cattle. J. Anim. Sci. 92:3804-3810. http://dx.doi.org/10.2527/jas.2014-7669
SAS Institute Inc. 2008. SAS/STAT® 9.2 User’s Guide The GLM Procedure(Book Excerpt). SAS Institute Inc. SAS Campus Drive, Carolina.
Sellner, E. M., J. W. Kim, M. C. Mc Clure, K. H. Taylor, R. D. Schnabel, & J. F. Taylor. 2007. Board-invited review: ap-plications of genomic information in livestock. J. Anim. Sci. 85:3148-3158. http://dx.doi.org/10.2527/jas.2007-0291 Shibata, M., K. Matsumoto, K. Aikawa, T. Muramoto, S.
Fu-jimura, & M. Kadowaki. 2006. Gene expression of myo -statin during development and regeneration skeletal muscle in Japanese Black Cattle. J. Anim. Sci. 84:2983–2989. http://dx.doi.org/10.2527/jas.2006-118
Silva, S. L., J. U. Tarouco, J. B. S. Ferraz, da C. Gomes, P. R. Leme, & E. A. Navajas. 2012. Prediction of retail beef yield, trim fat and proportion of high-valued cuts in Nel-lore cattle using ultrasound live measurements. R. Bras.
Zootec. 41:2025-2031.
http://dx.doi.org/10.1590/S1516-35982012000900009
Smith Z. D. & A. Meissner. 2013. DNA methylation: roles in mammalian development. Nat. Review Genet. 14: 204-220. http://dx.doi.org/10.1038/nrg3354
Sun, W. X., V. Dodson, Z. H. Jiang, S. G. Yu, W. W. Chu, & J. Chen. 2016. Myostatin inhibits porcine preadipocyte
differentiation in vitro. Domes. Anim. Endocri. 55: 25-31.
http://dx.doi.org/10.1016/j.domaniend.2015.10.005
Tamura, K., D. Peterson, N. Peterson, G. Stecher, M. Nei, & S. Kumar. 2011. MEGA5: molecular evolutionary
genet-ics analysis using maximum likelihood. evolutionary dis
-tance. and maximum parsimony methods. Mol. Biol. Evol. 28:2731–2739. http://dx.doi.org/10.1093/molbev/msr121 Yeh, F. C., R. C. Yang, & T. Boyle. 1999. POPGENE
32-Ver-sion1.31. Population genetics software. [ 2016 Jan 20].
https://www.ualberta.ca/~fyeh/popgene.pdf.
Zhang, R. F., H. Chen, C. Z. Lei, C. L. Zhang, X. Y. Lan, Y. D. Zhang, H. J. Zhang, B. Bao, H. Niu, & X. Z. Wang. 2007. As-sociation between polymorphisms of mstn and myf5 genes and growth traits in three chinese cattle breeds. AJAS. 20:1798 – 1804. http://dx.doi.org/10.5713/ajas.2007.1798