Kriteria Evaluasi Supplier
Possibilities for evaluating
suppliers’ offers
Harga termurah
total cost
total cost
of ownership terendah
Weighted scoring
Value
judgement
ITC
?
1. Harga terendah
♦
Penawaran supplier diuji dengan persyaratan minimum
♦
Jika mereka memenuhi kritreria tersebut, evaluasi dalam basis
harga:
Apakah memenuhi spesifikasi
?
Dapatkah supplier mengirim tepat waktu?
harga:
ITC
Evaluating offers for supply of office PCs
Meets minimum:
Supplier
Registered
supplier?
Specification
Delivery
schedule
Price
Selected:
A Yes Yes No
B Yes Yes Yes $ 42,300 No
C Yes Yes Yes $ 47,500 No
D No
E Yes No
F Yes Yes Yes $ 38,900 Yes
G Yes No
Action Point
4.2-1Evaluation based on lowest price
Requirements for copy
Supplier X offer Supplier Y offer Supplier Z offer
Jika ada tiga Supplier X, Y, and Z telah memenuhi persyratan
minimum, mana yang harus dipilih jika pemilihan didasarkan pada harga
terendah?
ITC
Requirements for copy
machine
Supplier X offer Supplier Y offer Supplier Z offerMinimum speed:
200 copies per minute
180
210
300
2 Years
2 years
30 months
3 years
Purchase Price
$22,000
$28,000
$35,000
Selected supplier:
Minimum Warranty:
2. total cost of ownership (TCO)
Terendah
Supplier pertama-tama dievaluasi apakah
telah memenuhi persyaratan minimum
telah memenuhi persyaratan minimum
Jika ya, evaluasi mereka dengan total cost of
ownership dari penawaran yang mereka
tawarkan
ITC
Definisi Life Cycle Costing atau
TCO
• Life cycle cost: ‘cost of an asset, or its parts
throughout its life cycle, while fulfilling the
performance requirements’ (ISO 15686-5)
6
• Life cycle costing: ‘methodology for systematic
economic evaluation of life cycle costs over a
What is Life Cycle Cost (LCC)
Analysis?
Sebuah metode untuk menghitung
biaya suatu sistem sepanjang umur
hidupnya, meliputi biaya pembelian,
hidupnya, meliputi biaya pembelian,
biaya perawatan, biaya operasional dan
biaya disposal.
Istilah lain :
Total Cost of Ownership
Whole Life Costing
Whole Life Value
Pengertian Life cycle costing
(LCC)
• Metode evalusi ekonomi
• Mempertimbangkan semua biaya yang
relevan
8
• Sepanjang periode/horison waktu tertentu
• Memperhitungkan nilai waktu dari uang
Tujuan LCC Analysis
Mengevaluasi alternatif investasi dari berbagai
pilihan yang bersifat mutually exclusive
Memutuskan alternatif terbaik secara ekonomi dengan
mempertimbangkan semua biaya yang muncul.
mempertimbangkan semua biaya yang muncul.
Metode Analisis LCC
Present Worth
Equivalent Uniform Annual Cost
Future Worth
Internal Rate of Return
Benefit/Cost Ratio
Benefit/Cost Ratio
Payback Period
Purchase cost
Operating costs
Preventive maintenance costs
Repair costs
KomponenTCO
Repair costs
Cost of disposal
Capital costs
Other costs, e.g. insurance
Other considerations, e.g.: output levels
ITC
Contoh
Purchase price
Electricity
Maintenance contract
Disposal
65%
21%
11%
3
%
Kuantifikasi masing-masing
Biaya
Breakdown of total cost of ownership a HV electric motor
Element of cost
Year 1
Year 2
Year 3
Year 4
Year 5
Purchase price
$50,000
Electricity
$30,000
$30,000
$30,000
$30,000
$30,000
Maintenance
$5,000
$5,000
$5,000
$5,000
$5,000
Disposal
$7,000
ITC
Quantifying each cost
kuantifikasi dan tabulasikan menurut
waktu hidup produk
dalam banyak kasus, tidak cukup melihat
dalam banyak kasus, tidak cukup melihat
total biaya tahunan
ITC
Tingkat penting dari waktu pembiayaan
♦
Lihat contoh tabel dibawah dimana total
biaya sama
♦
Keduanya berbeda dalam harga jual dan
biaya tahunan
♦
Pilih sesuai strategi penganggaran
♦
Pilih sesuai strategi penganggaran
perusahaan
ITC
Purchase of production machinery: Summary of costs over time
Offers
Year 0
Year 1
Year 2
Year 3
Total cost
Supplier
X
Purchase price:
$60,000
$5,000
$20,000
$5,000
$90,000
Supplier
Y
Purchase price:
$80,000
$3,000
$3,000
$4,000
$90,000
Penghitungan TCO dengan Pendekatan
Net Present Value (NPV)
NPV menggunakan waktu-nilai uang
dalam penghitungan the total cost
of ownership
Menyatakan semua biaya dalam
12
3
6
9
=
Menyatakan semua biaya dalam
ekuaivalen nilai sekarang
ITC
Contoh . Pada bunga 15%, nilai $23,000 satu tahun
yad = $20,000 nilai sekarang
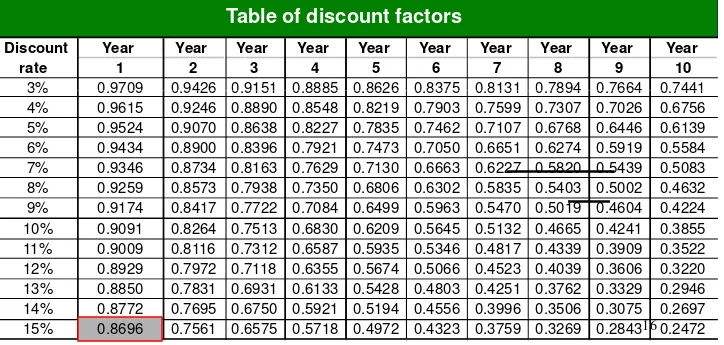
NPV
Tabel:
Present-day = (future cost) x ( applicable discount
cost factor)
Year Year Year Year Year Year Year Year Year Year
1 2 3 4 5 6 7 8 9 10
3% 0.9709 0.9426 0.9151 0.8885 0.8626 0.8375 0.8131 0.7894 0.7664 0.7441
Discount rate
Table of discount factors
3% 0.9709 0.9426 0.9151 0.8885 0.8626 0.8375 0.8131 0.7894 0.7664 0.7441 4% 0.9615 0.9246 0.8890 0.8548 0.8219 0.7903 0.7599 0.7307 0.7026 0.6756 5% 0.9524 0.9070 0.8638 0.8227 0.7835 0.7462 0.7107 0.6768 0.6446 0.6139 6% 0.9434 0.8900 0.8396 0.7921 0.7473 0.7050 0.6651 0.6274 0.5919 0.5584 7% 0.9346 0.8734 0.8163 0.7629 0.7130 0.6663 0.6227 0.5820 0.5439 0.5083 8% 0.9259 0.8573 0.7938 0.7350 0.6806 0.6302 0.5835 0.5403 0.5002 0.4632 9% 0.9174 0.8417 0.7722 0.7084 0.6499 0.5963 0.5470 0.5019 0.4604 0.4224 10% 0.9091 0.8264 0.7513 0.6830 0.6209 0.5645 0.5132 0.4665 0.4241 0.3855 11% 0.9009 0.8116 0.7312 0.6587 0.5935 0.5346 0.4817 0.4339 0.3909 0.3522 12% 0.8929 0.7972 0.7118 0.6355 0.5674 0.5066 0.4523 0.4039 0.3606 0.3220 13% 0.8850 0.7831 0.6931 0.6133 0.5428 0.4803 0.4251 0.3762 0.3329 0.2946 14% 0.8772 0.7695 0.6750 0.5921 0.5194 0.4556 0.3996 0.3506 0.3075 0.2697 15% 0.8696 0.7561 0.6575 0.5718 0.4972 0.4323 0.3759 0.3269 0.2843 0.2472
ITC
NPV
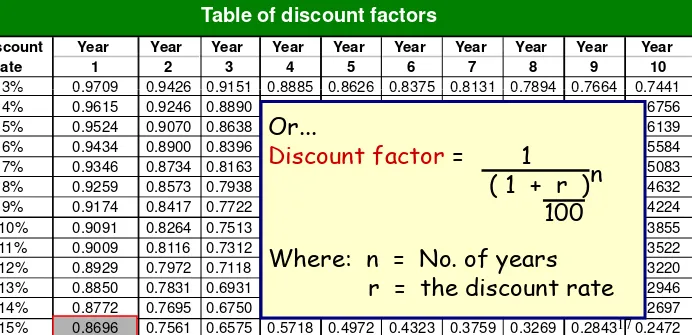
Tabel:
Present-day = (future cost) x ( applicable discount
cost factor)
Year Year Year Year Year Year Year Year Year Year
1 2 3 4 5 6 7 8 9 10
3% 0.9709 0.9426 0.9151 0.8885 0.8626 0.8375 0.8131 0.7894 0.7664 0.7441
Discount rate
Table of discount factors
3% 0.9709 0.9426 0.9151 0.8885 0.8626 0.8375 0.8131 0.7894 0.7664 0.7441 4% 0.9615 0.9246 0.8890 0.8548 0.8219 0.7903 0.7599 0.7307 0.7026 0.6756 5% 0.9524 0.9070 0.8638 0.8227 0.7835 0.7462 0.7107 0.6768 0.6446 0.6139 6% 0.9434 0.8900 0.8396 0.7921 0.7473 0.7050 0.6651 0.6274 0.5919 0.5584 7% 0.9346 0.8734 0.8163 0.7629 0.7130 0.6663 0.6227 0.5820 0.5439 0.5083 8% 0.9259 0.8573 0.7938 0.7350 0.6806 0.6302 0.5835 0.5403 0.5002 0.4632 9% 0.9174 0.8417 0.7722 0.7084 0.6499 0.5963 0.5470 0.5019 0.4604 0.4224 10% 0.9091 0.8264 0.7513 0.6830 0.6209 0.5645 0.5132 0.4665 0.4241 0.3855 11% 0.9009 0.8116 0.7312 0.6587 0.5935 0.5346 0.4817 0.4339 0.3909 0.3522 12% 0.8929 0.7972 0.7118 0.6355 0.5674 0.5066 0.4523 0.4039 0.3606 0.3220 13% 0.8850 0.7831 0.6931 0.6133 0.5428 0.4803 0.4251 0.3762 0.3329 0.2946 14% 0.8772 0.7695 0.6750 0.5921 0.5194 0.4556 0.3996 0.3506 0.3075 0.2697 15% 0.8696 0.7561 0.6575 0.5718 0.4972 0.4323 0.3759 0.3269 0.2843 0.2472
Or...
Discount factor
= 1
( 1 + r )n
100
Where: n = No. of years
r = the discount rate
ITC
Summary of costs
Supplier
Today’s
purchase
cost
End of
Year 1
End of
Year 2
End of
Year 3
End of Year 4
Supplier A’s
offer
$35,000
$5,000
$7,000
$7,000
Net cash inflow of
$5,000
Supplier B’s
offer
$38,000
$3,000
$3,000
$3,000
Net cash inflow of
$1,000
Contoh...
offer
$1,000
Year
Year
Year
Year
1
2
3
4
8%
0.9259
0.8573
0.7938
0.7350
Discount
rate
Discount factors
Pada discount rate 8%:
ITC
Supplier A
Period
Cost
8% Discount
rate
Equivalent present-day value
Today –
purchase cost
35,000
N/A
35,000
Year 1
5,000
0.9259
5,000 x 0.9259 =
4,630
Year 2
7,000
0.8573
7,000 x 0.8573 =
6,001
The result for...
Year 2
7,000
0.8573
7,000 x 0.8573 =
6,001
Year 3
7,000
0.7938
7,000 x 0.7938 =
5,557
Year 4
-5,000
0.7350
-5,000 x 0.7350 =
- 3,675
Net present
value
35,000 + 4,630 + 6,001 + 5,557 –
3675
= $47,513
ITC
Hasil...
Supplier B
Period
Cost
8% Discount
rate
Equivalent present-day value
Today –
purchase cost
38,000
N/A
38,000
Year 1
3,000
0.9259
2,778
Year 2
3,000
0.8573
2,572
Year 2
3,000
0.8573
2,572
Year 3
3,000
0.7938
2,381
Year 4
-1,000
0.7350
-735
Net present
value
$44,996
Kesimpulan :
NPV Supplier B lebih rendah, maka dipilih
supplier B.
ITC
Dengan informasi pada tabel dibawah, tentukan nilai NPV dan
tentukan supplier yang terpilih. Gunakan bunga 12%.
Summary of costs
Supplier
Today’s
purchase
cost
End of
Year 1
End of
Year 2
End of
Year 3
End of Year 4
4.3-4
Net present value peralatan
Action Point
NPV of Supplier A’s offer:______________
NPV of Supplier B’s offer:______________
Selected Supplier: ______
cost
Supplier A’s
offer
$45,000
$7,000
$5,000
$7,000
Net cash inflow of
$5,000
Supplier B’s
offer
$56,000
$6,000
$6,000
$6,000
Net cash inflow of
$8,000
ITC
3. Weighted scoring models
Suppliers diskor berdasar pada kriteria yang telah
diberi bobot yang merefleksikan tingkat kepentingan
supplier dengan skor tertinggi dipilih
Biaya diberlakukan sama dengan kriteria yang lain
Masalah jika skor tertinggi bukan merupakan yang
ITC
Masalah jika skor tertinggi bukan merupakan yang
termurah
Scoring capability: some criteria…
Ability to meet essential and desirable requirements
(specifications, quantity, lead-time…)
Quality assurance
Customer service
Supply capacity
Past performance
ITC
Past performance
Strategic issues (location, distribution network…)
Supplier innovation
Financial strength
Risk management (including insurance)
Contoh:
Evaluating offers - Purchase item: measuring equipment
Bid evaluation criteria
(
and components with allocated weights)
Overall weight
(1-10)
1. Technical performance
♦
♦
♦
♦
Precision in measurement
(10)
10
2. Product reliability
♦
♦
♦
♦
Low meantime between failures
(3)
♦
♦
♦
♦
10
ITC♦
♦
♦
♦
Low meantime between failures
(3)
♦
♦
♦
♦
Low outage rate
(3)
♦
♦
♦
♦
Durability of the equipment
(4)
10
3. Lead-time to delivery
♦
♦
♦
♦
Delivery of the main equipment
(9)
9
4. Continued availability of spares
♦
♦
♦
♦
Offer of continuity of supply
(1)
♦
♦
♦
♦
Financial stability
(3)
♦
♦
♦
♦
Core product for supplier
(3)
♦
♦
♦
♦
Sustainable market position
(3)
10
5. Technical support
♦
♦
♦
♦
In installation and commissioning
(2)
♦
♦
♦
♦
Training of staff on-site
(3)
♦
♦
♦
♦
Response time to queries
(2)
♦
♦
♦
♦
Response time to maintenance and repair
(3)
10
6. Life-cycle cost
♦
♦
♦
♦
Purchase price
(2)
Contoh:
♦
♦
♦
♦
Purchase price
(2)
♦
♦
♦
♦
Cost of spare parts
(2)
♦
♦
♦
♦
Cost of staff training
(1)
♦
♦
♦
♦
Cost of maintenance support
(2)
7
TOTAL:
56
ITC
Contoh:
Scoring suppliers’ offers –
Measuring equipment
Evaluation criterion: meantime between failures
Not acceptable – has not met
the required criteria
May not be acceptable – only barely meets minimum requirements Acceptable (baseline) Acceptable – has met all requirements and exceeded some Acceptable – has well exceeded all requirements
0
1
2
3
4
ITC
Avge. less than 100 days between failures Avge. 100-119 days between failures Avge. 120-129 days between failures Avge. 130-149 days between failures
Avge. 150 or more days
between failures
Supplier A
X
Supplier B
X
Supplier C
X
Contoh:
Evaluating offers - Purchase item: measuring equipment
Supplier
A
Supplier
B
Supplier
C
Bid evaluation criteria
(
and components with allocated weights)
Score Wtd.Score Score Score ScoreWtd. ScoreWtd.
1. Technical performance ♦
♦ ♦
♦ Precision in measurement (10) 4
40
110
220
2. Reliability
3. Lead-time to delivery
♦ ♦ ♦
♦ Delivery of the main equipment (9) 2
18
436
327
4. Supply horizon – continuity of spares
♦ ♦ ♦
♦ Offer of continuity of supply (1) 3
3
33
44
♦ ♦ ♦
♦ Financial stability (3) 3
9
39
13
♦ ♦ ♦
♦ Core product for supplier (3) 4
12
26
39
♦ ♦ ♦
♦ Sustainable market position (3) 4
12
26
00
2. Reliability
♦ ♦ ♦
♦ Low meantime between failures (3) 3
9
26
39
♦ ♦ ♦
♦ Low outage rate (3) 3
9
26
26
♦ ♦ ♦
♦ Durability of the equipment (4) 4
16
28
312
ITC
Contoh:
Evaluating offers - Purchase item: measuring equipment
Supplier
A
Supplier
B
Supplier
C
Bid evaluation criteria
(
and components with allocated weights)
Score Wtd.Score Score Score ScoreWtd. ScoreWtd.
5. Technical support
♦ ♦ ♦
♦ In installation & commissioning (2) 2
4
36
36
♦ ♦ ♦
♦ Training of staff on-site (3) 2
6
412
39
♦ ♦ ♦
♦ 3
6
36
4
Max. score possible =
224
Total weighted score:
160
148
129
6. Life-cycle cost
♦ ♦ ♦
♦ List price (2) 1
2
36
48
♦ ♦ ♦
♦ Cost of spare parts (2) 1
2
36
12
♦ ♦ ♦
♦ Cost of staff training (1) 1
1
44
22
♦ ♦ ♦
♦ Cost of maintenance support (2) 1
2
36
12
♦ ♦ ♦
♦ Response time to queries (2) 3
6
36
24
♦ ♦ ♦
♦ Response time to maintenance & repair (3) 3
9
412
26
Scores (as % of 224) =
71%
66%
58%
ITC
Value judgement
Membandingkan aspek non biaya terbobot terhadap
biaya yang ditawarkan
Biaya dapat berupa harga atau total cost of
ownership
Akhirnya,
skor dibandingkan dengan biaya
ITC
Akhirnya,
skor dibandingkan dengan biaya
untuk men-judge
kombi
nasi mana
mewakili nilai terbaik
Weig
hted
score
Thank You