Consumtivism on Touring Master’s Students In Jakarta
LINDA K. WEDARI
Universitas Katolik Indonesia Atma Jaya, Faculty of Economics and Business, Jakarta 12930, Indonesia Email correspondence: [email protected]
Abstract
This study about the factors that influence he decision on tourism destination of Master’s students from 9 (nine) Universities in Jakarta. Around 199 questionnaires that were returned, had been processed by using binary logistic regression, for tour in Java, tour outside of Java, domestic tourism, and tour overseas. The researcher finds that, First, respondents make expenditures for meals, snacks, entrance fees, game with consumptive. While spending on hotels, their clothes, clothes for gift, souvenirs and snacks for gift with highly consumptive. Second, factors that encourage a trip decision to Java and outside Java, are income and plan (respondents prepared it by their monthly saving) while factors that influence them to have trip in the country (domestic)or overseas, are motivation, spending, and income. Third, for both trip to Java Island and outside Java Island, and also tourism domestic destinations as well as overseas, most respondents choose to pay their cost by their own cash or by their own credit card for the range of 1-6 months payment.
Key words: Tourism destination, motivation, financing and buying behavior.
Konsumtivisme pada Tur Para Mahasiswa Master Di Jakarta
Abstrak
Penelitian ini tentang faktor-faktor yang mempengaruhi keputusan ia tentang tujuan wisata dari para mahasiswa master dari 9 (sembilan) Perguruan Tinggi di Jakarta. Sekitar 199 kuesioner yang dikembalikan, telah diolah dengan menggunakan regresi logistik biner, untuk tur di Jawa, tur di luar Jawa, pariwisata domestik, dan tur di luar negeri. Peneliti menemukan bahwa, Pertama, responden melakukan pengeluaran untuk makanan, makanan ringan, biaya masuk, game dengan konsumtif. Sementara menghabiskan hotel, pakaian mereka, pakaian untuk hadiah, souvenir dan makanan ringan untuk hadiah dengan sangat konsumtif. Kedua, faktor yang mendorong keputusan perjalanan
ke Jawa dan luar Jawa, adalah pendapatan dan rencana (responden disiapkan dengan tabungan bulanan) sedangkan
faktor yang mempengaruhi mereka untuk memiliki perjalanan di dalam negeri (domestik) maupun di luar negeri, yang motivasi, belanja, dan pendapatan. Ketiga, untuk kedua perjalanan ke Pulau Jawa dan luar Pulau Jawa, dan juga pariwisata tujuan domestik maupun luar negeri, sebagian besar responden memilih untuk membayar biaya
mereka dengan uang mereka sendiri atau dengan kartu kredit mereka sendiri untuk berbagai pembayaran 1-6 bulan.
INTRODUCTION
Consumptivism is the decision processes and acts of people involved in buying and using products. Berkman and Gilson (1978) argued that a purchasing behavior is the sequential activity from buying intention to actual purchasing behavior. A consumptive person perceives that the measurement of pleasure or happiness is when he can buy goods or services without considering whether he really needs
them or not.
For some people, especially those who love travelling, vacation is a necessity. It is caused by some factors such as the high buying power, sense of concern towards the quality of family relationship or social relationship which can be established through refreshment, especially refreshment in an open space, internet connection, and promotion program or interesting package of vacation provided by travel agent (e.g. year end holidays package), etc.
According to Ali (2010), the highest spending for vacation among all demographic age groups is on the youth group (20 – 24 years old) which is 10.4 % per
month. Young people in this group usually do not have
their own income and still depend on their parents.
Although most of them are student, their spending on
vacation and entertainment is the highest among all age groups. In this initial study, the researcher wants to identify what factors that underlie someone’s preference on touring. Analysis will be conducted on three groups of tourism destinations which are Java
Island, Outside of Java Island, and Overseas.
Referring to those backgrounds, this study will try to answer the research questions i.e. What factors that determine in chosing the destination? How is the consumptive behavior of master’s students? And how do they finance their tour? The purposes of this study are to identifies the factors in determining tourism destination and to analyze how they finance their tour, so the marketers could consider thepromotion
strategies.
LITERATURE REVIEW
The need of recreation
Life of human being is marked and structured by
some main factors which define who we are and how we live. Basically, human being need to be individual and social being. Human basic needs as individual are breathing, eating, drinking, sleeping, showering, defecating, and urinating. If those needs are not fulfilled, then they could not live. As a creature who has senses, those needs not only have to be fulfilled but also have to create self-satisfaction. The need for pleasure or fun are basically found on the needs of our five senses such as eyes, nose, ears, tounge, and skin, until it reaches the certain level of satisfaction.
Sense of sight can be satisfied by seeing attractive and beautiful shape. Sense of hearing can be pleased by listening to beautiful and melodious voice. Sense of smell can be met by sniffing fragrant and fresh smell. Sense of taste can be delighted by feeling the temperature and tasting pleasing objects. If the needs are filled continously with the same treatments, then there will be a sick situation that at some point can create depression and even craziness for the person. Therefore, someone has to please its five senses to swap away the sickness of routines activities by going on tour to a near place or a far place. Recreation is essential to meet the psychological need that is able to reduce stress by doing activities such as crafting or carving (Hurd&Anderson., 2011).
Consumptivism is an expression of culture and manifestation of consumptive action. Consumptivism is patterns of consumption characteristics such as spending spree, extravagance of money, and the change of satisfication feeling on things which can be delayed to be things that need to be fulfilled quickly (Lamarto, 1985). Consumptive behavior causes someone to always feel unsatisfied and being neglected on how to get it.
Consumptive behavior is someone’s manner which is controlled by a desire to meet his secular happiness. Lubis (1993) mentions that consumptive behavior is a buying action which is no longer based on the rational considerations but because there is a need to reach irrational level of satisfication.
Motivation is fundamental in study of tourist and tourism because it is the trigger of vacation process, although it is often not realized by the tourist
Consumtive Behavior of Youth Tourist in Tourism Destination
Higgins-Desbiolles (2010) examines the cultural ideology of consumerism in relation to the sustainability of tourism. Their research ensuring ideological implications of consumerism culture
theory remains useful in the issue of sustainable
tourism. Mullins (1999) stated that researchers regard to urban researchers in substance ignores the link among consumerism, tourism and urban.
Young age is usually identical to consumtivism because of its identities which are like a short-term thinker and an easy person to be influenced by some stimuli. Someone can be very consumptive because he gets some stimuli from his environment. Young people are susceptible of those stimuli because they still involve in many activities in society, in which it make them become part of society who can easily act very consumptive. Young people who stay in the tourism areas have higher level of consumptive behavior than those who stay in non-tourism places. It is understandable because those who stay in tourism area get direct stimuli from their environment.
Previous Study
In Ismail, Panni and Talukde (2006), Ismail and
Panni (2008) about consumer perception on their purchasing behavior on food industry in Malaysia, found that consumerism relates to the buying behavior of the consumers. Ismail and Panni (2008) investigated consumer perceptions on the issues and its influence on their purchasing behavior: a
view from Malaysia Food Indusry. They found that
consumerism relates to the buying behavior of the consumers. Similar with the study of Imail, Panni and Talukder (2006) about consumer perceptions on the environmental consumerism issue and its influence on their purchasing behavior. Ismail et.al (2006) found that consumerism behavior has positive relation to the buying behavior of the consumenrs (on food products).
Ware (2002) in the study of consumerism with credit card by collage student found that system of technology with profit orientation, laxity of government’s profit regulation, adolescent social pressure, reduction of parent’s saving and increase of spending have been worsening this bad situation. However, the use of
credit card unwisely by the students themselves have proved that it is the main cause on this problem. Orel, Demirci, and Zeren (2011) stated there are different consumptivism behaviors between the students and the government’s regulations in Poland and Turkey. However, business still needs to identify and deal with every consumer’s significant complaint that probably shows up and offers possible solutions which can be developed. If consumers’ benefits are the main purpose, the awareness of consumptivism shall have been developed in both countries.
Enrico, Aron and Oktavia (2014) investigated the factors that influenced consumptive behavior: A
Survey of University Students in Jakarta. They found
that There are some dominant causes that affect consumptive’s behavior such as buying power and the use of product, social status, satisfaction, and prestige. It is quite similar to the research by Hotpascaman except for hypothesis on family lifestyle which can be accepted.
Ali and Wisniesk (2010) found in the study that
participants in UEA scored high both in consumtivism and consumers’ ethics. However, tendency of buying and enjoying shopping is not shown on the low score of consumers’ ethics. On the other hand, there seems a positive relation between consumptivism and scale of consumers’ ethics. Demeter and Bratucu (2014)
stated that there are some kinds of tourism done by youth tourists. European young tourists show
tendency that a bit different from Rumanian tourists. European tourists tend to do culture exchange and
be volunteer while Rumanian tourist prefer to do adventure and sport travel. However both of them
like education tourism.
Jones, Hillier, Comfort and Eastwood (2005) in the
study sustainable retailing and consumerism, found
that retailer believes that the sustainability of long
term economic is on the interests of all stakeholders, and if their businesses’ continuity are integrated, they will be in better positions to provide financial
and long term growth to all stakeholders.
consumerism.
Hypothesis Development
Gender and Tourism Destination
Women are considered as being warm, expressive, compassionate, and understanding. For women, the promotions emphasised beauty and youth. Men
tend to buy instrumental and leisure items otherwise
women tend to buy symbolic and self expressive goods. Women’s perception stated that there is a
pride in the ability to be prudent and get the best
products for the best prices. Marketers empathize greatly by placing selective deals to offer a sense of accomplishment for women’s shopping experience. Marketers can not promote to men the same way they do to women due to the fact that both genders are “different biologically, psychologically, and socially. According to Solomon (2012), there is a difference in gender buyer behavior which lead to differences in gender buyer decisions. Such as tourism destination, kind of food, hotels, etc.
H1: Gender (X1) influence the Tourism Destination.
Motivation and Tourism Destination
In making decision of tourism destination, responden motivated by curiosity of the new tourism places. Motivation is the trigger of the process of travel, even if the motivation is often not realized in full by tourists (Sharpley, 1994). The motivation can be grouped into: physiological motivation, cultural motivation, social motivation (interpersonal motivation), and fantasy motivation. Grande (2005) stated that consumers seek variety as a break from routine and that it is a process which varies in intensity according to the exploratory tendency of each individual. This variety seeking continues until the consumers reach the level of sensation or enjoyment in the process that suits their own characteristics. People who are clearly identified with their innate exploratory tendency possess an intrinsic motivation. Litvin (2008) suggests that sensation seeking has often been considered by tourism researchers.
H2: Motivation (X2) influence the Tourism Destination.
Financing and Tourism Destination
The old rule of thumb is that a once-a-year vacation
should cost about one week’s salary, but there’s really no algorithm that’s right for everyone. It’s a personal decision that depends on one’s fixed expenses (housing, cars, student loans, insurance) and lifestyle choices. To make choices of tourism destination, one’s would prefer to use credit card rather than cash so they can make long distance trip (abroad).
H3: Financing (X3) influnce the Tourism Destination.
Buying Behavior and Tourism Destination
Life style is an individual’s system regarding his/ her interests, ideas, opinions, actions, consuming habits. As the purchase and consumption of the tourism product is often separated by space and time (Litvin & Ling, 2000). Potential first time visitors are unable to fully examine product attributes prior to purchase and therefore increase their reliance on image in destination choice (Chon, 1990). Only those destinations that offer an appropriate product, at an appropriate price, communicate these attributes effectively and sell the product through appropriate distribution channels will be considered for purchase.
H4: Buying Behavior (X4) influence the Tourism Destination.
Income and Tourism Destination
The economic factors are the most sensitive to environmental change and, as a result, they have been very affected by the economic situation of the
past two years. For some people, travel is important
enough that they choose to live in a smaller house and keep a lot of their discretionary expenses down so they can see the world. Profession also has a great impact on choosing tourism behavior because profession is related to the education level and their income level (Fratu, 2011).
The low income, the economic and financial instability had an impact on the European consumer, especially regarding tourism consumption. Given these conditions of economic instability, the European tourism consumer has changed his behavior looking for shorter trips, special offers and discounts, short distance trips, eventually city-breaks. Also, tourists have become very careful when spending money for
want to be sure that they benefit of the maximum of services (Fratu, 2011).
H5: Income (X5) influence the Tourism Destination.
Plan on Tourism Spending and Tourism Destination
Tourism agencies promote cheaper tourism packages and special offers. The early-booking concept became very popular because tourists prefer to pay in advance for a trip in order to benefit from a discount. Also e-tourism has developed a lot because tourists can create their own tourism packages on the internet, at the desired costs.
Romanian tourists reduced the budget allocated for
travel. If in 2008 lots of tourists took loans in order
to go on vacation, in 2009 and 2010 their behavior changed considerably. They think twice before taking a decision, regarding the fact that the amount of money used for the vacation can be used in other purposes. Some even gave up the thought of vacation. The low income, the rising prices, the instability of the work place, all these are reasons for which people think twice before deciding to spend money (Radbata, 2010). Given these conditions, travelling becomes for
many Romanians a luxury.
of these students as youth tourist respondents is
because it is assumed that they have been working and have stable income so that they have power to define and plan its tour, and also have ability to finance themselves for the tour. The sampling technique in this study is Multi Stage Random Sampling which means the sampling technique is performed in stages
and usually is based on the division of labor. This
sampling techniqe is part of probability sampling technique.
Method of Data Analysis
First Test of Validity and Reliability, second Descriptive Statistical Data and Analysis of Binary Logistic
Regression, third Mean score.
Analysis of Binary Logistic Regression is used to see the factors that influence the decision making on
touring. The format of double regression model on this study is as follows:
g(x1) = Tourism destinations are Java Island and
Outside of Java Island
g(x2) = Tourism destinations are domestic and
overseas.
Variable Value g(x) will be predicted based on Independent Variable (X) consist of:
X1 = Gender
Mean Score is used to analyze buying behavior and the tourism spending. The researcher analyzes by using mean score from each question.
DISCUSSION
Test of Reliability and Validity
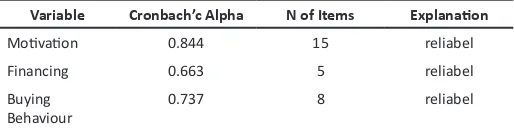
Before the questionnaires distributed, the researcher had examined the validity and reliability of each questions with 30 answers from initial distribution (Ferdinand,2014). Reliability test will use Cronbach’s Alpha Test, in which according to Sekaran (2010:157), if the value of Cronbach’s Alpha is over 0.6, the
statement or variable made is reliable. The result of reliability test is as follow:
Table 4.1 Result of Reliability Test
Variable Cronbach’c Alpha N of Items Explanation
Motivation 0.844 15 reliabel
Financing 0.663 5 reliabel
Buying Behaviour
0.737 8 reliabel
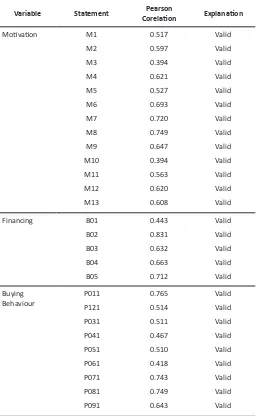
The question is valid if it has p-value < alpha 0.05 or has value of Pearson correlation more than table of
R value (0,361). The following table is the result of validity test that has been done.
Table 4.2 Result of Validity
Variable Statement Pearson
statements used are valid, so that all data that have
been taken by using questionnaire have already met the requirements.
Descriptive Statistics
TOURISM DESTINATION IN JAVA ISLAND AND OUTSIDE OF JAVA ISLAND (DOMESTIC)
Based on table 4.3, it can be seen that the youngest
respondent is 22 years old and the eldest respondent is 57 years old, with the average respondents are on their 32 years old. It means that the respondents are
still in their productive stage. The minimum income
of respondent is 1.000.000 IDR and the highest
income is 50.000.000 IDR, and the average income is
7.898.148,15 IDR.
Tabel 4.3 Descriptive Statistic 1
N Min Max Mean Std. Deviation
Age 189 22 57 32.2 8.598
Income 189 1000 50000 7898.14 5808.729
Motivation 189 26 58 43.709 5.62621
Financing 189 10 27 18.8042 2.64148
Buying Behaviour
189 9 44 26.5767 6.62207
Mounthly Saving
189 0 10000 606.878 1124.263
Valid N (list wise)
189
For the variable of motivation, the lowest score of respondents’ answer is 26, and the highest score is 58, with the average score is 43, so the respondents’ answers tend to be high. In the variable of financing, the lowest score is 10 and the highest score is 27 with the average score is 18.8, which means the score of respondents’ answers tend to be high. The lowest score of variable of buying behavior is 9, and the highest score is 44 with the average score of respondent is 26.57 which means it tends to be low.
There are some respondents who do not reserve fund for tour, but there are also others respondents
who make advanced saving with the highest number
is 10.000.000 IDR and the average reserved fund is 606.787,31 IDR.
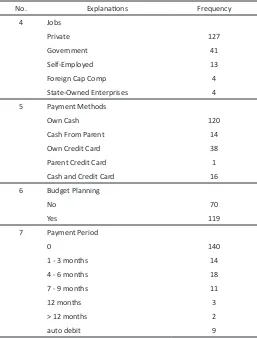
Tabel 4.4 Descriptive Statistic 2
Continue of Tabel 4.4 Descriptive Statistic 2
Cash and Credit Card 16
6 Budget Planning respondents, there are 18.5 % of them having vacation in Java Island and 81,5 % of them having vacation
in the Outside of Java Island. Thus, the majority of respondents, about 154 respondents, have been travelling to the outside of Java Island.
Around 54.5 % of respondents have been married, 45
% is still single, and 0.5% is widow. Therefore, it can be concluded that majority of these respondents is
married. The female respondents are about 44.4%, and male respondents are 55.6%, so that the majority of respondents is male.
The respondents’ majority is working in private companies with score of 67.2 %, in government (civil servant) with score of 21.7%, in its own private business is 6.9%, in foreign capital companies with score of 2.1%, and domestic owned-enterprises with score of 2.1%.
Out of 189 respondents, there are 63.5% respondents
who pay their tourism spending by their own cash
money, and 20.1% who pay by using their own credit card. It is only few respondents who pay their tourism spending by using financial support or credit card of their close friend/family. There are 37% respondents who do not make budget planning for vacation and
63 % respondents who make budget planning for its
vacation scheme. It can be concluded that majority
of these respondents have saved their money every month for their planned trip. Around 72% respondents
use cash and only few of them that finance its tourism by using credit card.
TOURISM DESTINATION DOMESTIC AND OVERSEAS
Tabel 4.5 Descriptive Statistic 3
N Min Max Mean Std. Deviation
Age 197 22 57 32.38 8.48
Income 197 1000 50000 8094.16 583.0009
Motivation 197 26 60 43.9289 5.83576
Financing 197 10 40 18.9797 3.10851
Buying Behaviour
197 9 44 26.5228 6.60594
Mounthly Saving
197 0 10000 621.065 1112.062
Valid N (list wise)
197
Based on table 4.5. it can be seen that the youngest
respondent is 22 years old and the oldest respondent is 57 years old, with the average age is 32 years
old. It means that the respondents are still in their productive age. The minimum income of respondents is 1,000,000 IDR and the highest income is 50,000,000
IDR, and with the average is 8,094,160.15 IDR.
For the variable of motivation, the lowest score of respondents’ answer is 26, and the highest score is 60, with the average score is 43, so the respondents’ answers tend to be high. In the variable of financing, the lowest score is 10 and the highest score is 40 with the average score is 18.97, which means the score of respondents’ answers tend to be high. The lowest score of variable of buying behavior is 9, and the highest score is 44 with the average score of respondent is 26.52 which tends to be low. There are
some respondents who does not have reserved fund
for vacation, but there are also others respondents who make advanced saving with the highest number
621.065,99 IDR.
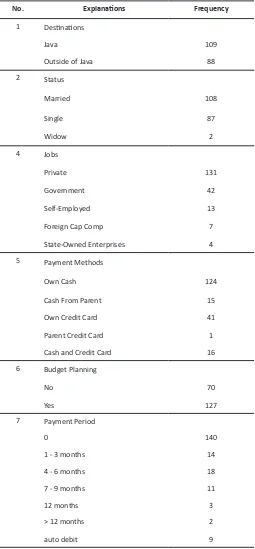
Tabel 4.6 Descriptive Statistic 4
No. Explanations Frequency
Cash and Credit Card 16
6 Budget Planning
respondents, there are 54.8% who are married, 44.2% who are single, and only 1% who are widow. Therefore, the majority of respondents is married. The
respondents’ majority work is in private companies with score of 66.5 % and in government (civil servant)
with score of 21.3%. The rest of repsondents are
working in its own private business is 6.6%, in foreign
capital companies with score of 3.6%, and domestic owned-enterprises with score of 2.0%.
There are 62.9% respondents who pay their tourism
spending by their own cash money, and 20.8% who pay by using their own credit card. It is only few
respondents who pay their tourism spending by using
financial support or credit card of their close friend/
family. The majority of respondents who pay by using
cash money is 71.1%, anf only few of them who finance its vacation by using credit card. From the total of all respondents, the highest percent of respondent with economic background is 35 % and then follows by the psychology background with 17.3%.
MODEL TESTING
Y (tourism destination) : Java and Outside of Java
Goodness of Fit Test
Tabel 4.7 Goodness of Fit Result
Step Chi-Square df Sig. Number = 1, because of the impairment, it means this regression model is fit with the data.
Table 4.8 Result of Overall Model Test Block 0: Beginning Block
a. Constant is included in the model. b. Initial -2 Log Likelihood: 180.714
Coefficient of Determination
The value of Nagelkerke R-Square on table 4.10
below, shows the ability of independent variable on explaining dependent variable is 21,5%, and there are
other factors, 100% - 21,5% = 78,5%, outside of the model that can describe the dependent variable.
Table 4.10 Result of Pseudo R-Square Test Model Summary
Step -2 Log likelihood Cox & Snell R2 Nagel kerke R2
1 153.911a 0.133 0.215
Factors Determine Tourism Destination
Tabel 4.9 Result of Overall Model Test Block 1: Method = Enter
Iteration Likelihood-2 Log Coefficient
Constant Motivation Expend Behaviour Sex Income Plan Step 1 1 167.147 2.392 0.006 0.032 -0.024 -0.404 0 -0.727
2 157.288 2.706 0.017 0.048 -0.04 -0.632 0 -1.104
3 154.132 2.138 0.032 0.048 -0.047 -0.713 0 -1.23
4 153.912 2.028 0.036 0.048 -0.05 -0.747 0 -1.263
5 153.911 2.019 0.036 0.047 -0.05 -0.75 0 -1.266
6 153.911 2.019 0.036 0.047 -0.05 -0.75 0 -1.266 Iteration Historya,b,c,d
a. Method: Enter
b. Constant is included in the model. c. Initial -2 Log Likelihood: 180.714
d. Estimation terminated at iteration number 6 because parameter estimates changed by less than .001.
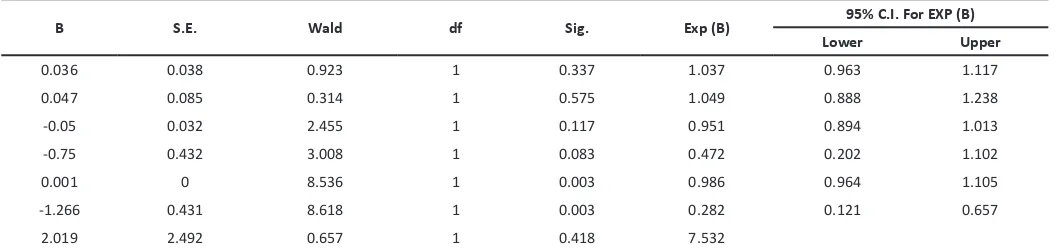
Tabel 4.11 Hasil Pengujian Variabel Variables in the Equation
B S.E. Wald df Sig. Exp (B) 95% C.I. For EXP (B)
Lower Upper
0.036 0.038 0.923 1 0.337 1.037 0.963 1.117
0.047 0.085 0.314 1 0.575 1.049 0.888 1.238
-0.05 0.032 2.455 1 0.117 0.951 0.894 1.013
-0.75 0.432 3.008 1 0.083 0.472 0.202 1.102
0.001 0 8.536 1 0.003 0.986 0.964 1.105
-1.266 0.431 8.618 1 0.003 0.282 0.121 0.657
2.019 2.492 0.657 1 0.418 7.532
a. Variable(s) entered on step 1: Motivation, Expend, Behavior, Sex, Income, Plan.
Based on table 4.11. can be seen that income variable and plan (planning on tourism activities that is supported by allocating certain amount of money per month) is significant at α = 10%. Motivation Variable, financing variable, and buying behavior variable in tourism activities do not have any influence on the
decision making of tourism destinations to Java Island and outside of Java Island. Income variable had positive effect on tourism activities which means the higher income is the higher possibility for someone to have tourism activities to the outside of Java, instead of in Java Island. The explanation for this is because when the respondents have high income, they have more capability to finance their wishes travelling to the outside of Java. Plan variable affected negatively, which means the more likely a person saves his money for vacation, the smaller possibility that he will choose to do tourism activities to the outside of Java. Otherwise, he prefers to have vacation in Java Island only. It is possible because the respondent wants to have vacation only in Java Island, and have allocated
his money to spend night in a comfort hotel and to enjoy the vacation itself comfortably.
Feasibiliy Study of Regression Model
Ho : Model which is hypothesized fit the data Ha : Model which is hypothesized unfit the data
The test is conducted by using Test of Hosmer and Lemeshow. Because the statistic value of Hosmer
and Lemeshow Test is 0,583 > 0,05 then the Ho is
accepted and Ha is rejected. It means the model is able to predict its observation value.
Table 4.12 Result of Goodness of Fit Hosmer and Lemoshow Test
Step Chi-Square df Sig.
1 8.219 8 0.412
Overall Model Test :
By comparing the value between -2 Log Likehood on Block Number = 0 and -2 Log Likehood on Block Number = 1, because of the impairment, it means this regression model is fit with the data.
Table 4.13 Result of Overall Model Test Block 0: Beginning Block
Iteration -2 Log likelihood Coefficients Constant
Step 0 1 269.239 -0.224
2 269.239 -0.225 a. Constant is included in the model.
b. Initial -2 Log Likelihood: 269.239
c. Estimation terminated at iteration number 2 because parameter estimates changed by less than .001.
Coefficient of Determination
Value of Nagelkerke R-Square on table 4.15 below,
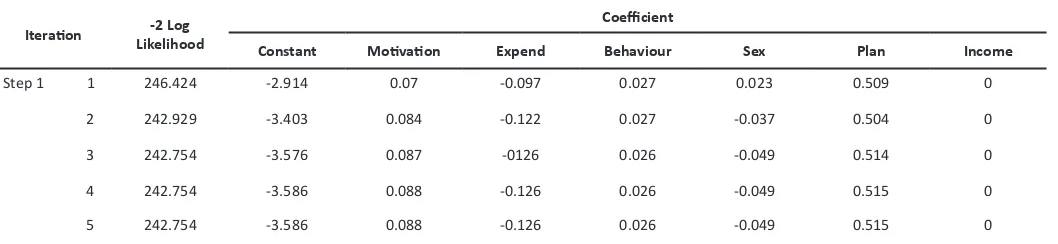
Tabel 4.14 Result of Overall Model Test Block 1: Method=Enter
Iteration Likelihood-2 Log Coefficient
Constant Motivation Expend Behaviour Sex Plan Income
Step 1 1 246.424 -2.914 0.07 -0.097 0.027 0.023 0.509 0
2 242.929 -3.403 0.084 -0.122 0.027 -0.037 0.504 0
3 242.754 -3.576 0.087 -0126 0.026 -0.049 0.514 0
4 242.754 -3.586 0.088 -0.126 0.026 -0.049 0.515 0
5 242.754 -3.586 0.088 -0.126 0.026 -0.049 0.515 0
a. Method: Enter
b. Constant is included in the model. c. Initial -2 Log Likelihood: 269.239
d. Estimation terminated at iteration number 5 because parameter estimates changed by less than .001.
shows the ability of independent variable on explaining dependent variable is 16,9%, and there are
other factors, 100% - 21,5% = 83,1%, outside of the model that can describe the dependent variable. It is probably because this study is the first study in which there have not been any similar research previously.
Table 4. 15 Result of Pseude R-Square Test Model Summary
Step -2 Log likelihood Cox & Snell R2 Nagel kerke R2
1 242.754a 0.126 0.169
a. Estimation terminated at iteration number 5 because parameter estimates changed by less than .001
Factors Determine Tourism Destination
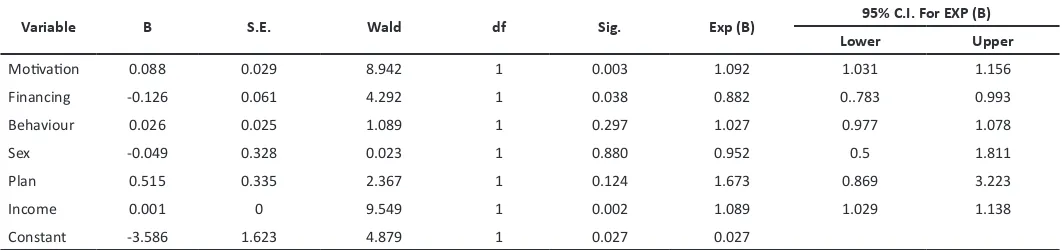
Based on table 4.16. it can be seen that variable of motivation, variable of financing, and variable of income are significant at α=5%. Parameter of motivation and income have positive value which means if the respondents’ motivation and income
gets higher, then there will be high possibility for
them to have vacation overseas. It is possible since
the respondents also want to enjoy the beauty of
tourism overseas, so when their income increases
the possibility to travel abroad will rise. Variable of
financing for travelling affected negatively, which
means when the respondents tend to pay for their
tour by using cash money, they will prefer to travel in
the state rather than travelling abroad. It is possible
because the fund needed to travel in the state is cheaper than that to travel abroad even though the
Table 4.16 Variable Test Result Variables in the Equation
Variable B S.E. Wald df Sig. Exp (B) 95% C.I. For EXP (B)
Lower Upper
Motivation 0.088 0.029 8.942 1 0.003 1.092 1.031 1.156
Financing -0.126 0.061 4.292 1 0.038 0.882 0..783 0.993
Behaviour 0.026 0.025 1.089 1 0.297 1.027 0.977 1.078
Sex -0.049 0.328 0.023 1 0.880 0.952 0.5 1.811
Plan 0.515 0.335 2.367 1 0.124 1.673 0.869 3.223
Income 0.001 0 9.549 1 0.002 1.089 1.029 1.138
Constant -3.586 1.623 4.879 1 0.027 0.027
a. Variable(s) entered on step 1: Motivation, Expend, Behavior, Sex, Income, Plan. Buying Behavior
To analyze the buying behavior, the researcher will calculate the mean score of each question, and then define the position of each group as tabulated in the table 4.17. The result of grouping of mean score value for each question can be seen on the table 4.18 in order to emphasize the buying behavior for each indicator.
Table 4.17 Range of Group Consumptivism
Group Range
Not Consumtive 0 - 1
Little bit Consumtive 1.1 - 2
Consumtive 2.1 - 3
High Consumtive 3.1 - 4
Very High Consumtive 4.1 - 5
Table 4.18 Consumptive Behavior on Types of Spending
Types of Spending Total Score Mean Score Meaning
Hotel 638 3.24 HC
Food 522 2.65 C
Snack 427 2.17 C
Entrance Ticket 577 2.93 C
Games/Entairtain 562 2.85 C
Own Cloths 610 3.10 HC
Souvenir 607 3.10 HC
Snack as Gift 627 3.16 HC
Cloths as Gift 659 3.35 HC
Remark : C = Consumptive HC = High Consumptive
The table shows that averagely the students of
Master’s Degree very consumptive on spending for hotel, clothes, souvenirs, and gifts. On the other
hand, the spending for food, snacks, entrance ticket, and games, is categorized as consumptive only.
Ways to finance tourism activities
In the analysis and discussion about how to finance tourism activities, the researcher do not distinguish between consumptive behavior during the vacation
in Java Island, outside of Java Island, and Overseas.
Table 4.19 Result of Mean Score Value
Financing Total Score Mean Score Meaning
Monthly Alocation 667 3.39 VA
Self Financing 781 3.96 VA
Parent Financing 464 2.36 RA
Office Financing 620 3.15 VA
Cash 749 3.8 VA
Credit Card 458 2.32 RA
VA = Very Agree RA = Relatif Agree
Table 4.19. that provides the result of grouping of
mean score value for each question, can show the big picture of how to finance tourism activities.
First respondents ‘very agree’ towards the statement of “monthly allocation” which means the respondents tend to allocate their money every month to finance their vacation planning. It also means that respondents have prepared good financial plan to pay its vacation which usually needs huge amount of money.
Second respondents “very agree” with the statement of ‘self-financing’, which means the respondents tend to finance its tourism activities by themselves.
respondents which mostly are married, so they have responsibility towards its family needs, including tourism activities.
Third respondents ‘quiet disagree’ with the statement “parents’ financing” This statement is a repeated statement from the previous negative statement. The result of “quiet disagree’ which is similar to the
previous result proves that the respondents answered
the question appropriately and conistently.
Fourth respondents very agree with statement
“office’s financing”, which means if the office offers for vacation by using office money, then the respondents will definitely take that chance.
Fiveth respondents very agree with statement
“cash payment” which means they prefer to pay its vacation’s cost by using cash rather than using credit card. It probably relates to the fact on point ‘a’ that respondents have allocated money to finance its vacation so they can pay the cost by cash.
Sixth respondents ‘quiet disagree’ with the statement “paying by using credit card” This statement is a repeated statement from the previous negative statement. The result of “quiet disagree’ which
is similar to the previous result proves that the
respondents answered the question appropriately and consistently.
Overall, it can be concluded that the respondents have made planning on doing vacation as shown on table 4.19. In addition, the respondents also have allocated their money to finance its tourism activities regularly, even though the tourism activities here mean activities conducted by their office. Mostly payment for vacation is paid by cash and do not use parents’ money.
CONCLUSION
This study is the first study in touring consumtivism that previously there have not been any researches in this field, especially in Indonesia. The data collected was gained by giving questionnaire to the Master’s Degree Students in 9 (nine) Universities in Jakarta. The researchers handed out 216 questionnaires and received 199 questionnaires that were returned by
the respondents.
This study is about the selection of tourism destination which is affected by some independent variables such as motivation, spending, buying behavior, gender, income and plan for tourism spending. The independent variable, tourism destination, is analyzed by using binary logistic regression. Analysis was conducted two times, the first one is to the tourism destination in Java Island and outside of Java Island, and the second one is tourism destination in
the state and overseas.
Based on the result of discussion and data analysis, it can be emphasized that: The first, respondents are consumptive on spending their money for food, snacks, entrance ticket, and entertainment. In addition, they are very consumptive on spending money on hotel, clothes for themselves and for family/ friends, souvenirs, and snacks as gifts. The second, income and plan (respondents’ preparation by saving their income monthly to finance their vacation) are factors that stimulate them to decide whether they will have vacation in Java Island or outside of Java Island, whereas the factors that encourage them to have vacation in the state or overseas are motivation, funding, and income. The third, whether the tourism destination is in Java Island or outside Java Island, as well as domestic or overseas, mostly respondents chose to pay their cost by using their cash own money or by using credit card for the range of 1 – 6 months payment. It is possible because they have planned its vacation and have saved money monthly for that vacation.
By this study, researchers have aim to tourism marketers should understand the sensation-seeking
desires of their guests and visitors and should not
only tailor their advertising and promotional efforts
to the desired level of arousal of their market but also
adapt their environment to best satisfy these desires.
Recomendation
For the next research, the researcher suggest as
follows:
First to add the number of respondents and to expand
the scope area for questionnaire to be not only in
Second to continue this study for digging further and expanding the scope of study so other variables can
be found and put into this model of study.
Third to conduct similar study with the respondents from group which has different background such as Doctoral students of High school’s students, and then compare the result of those two groups.
REFERENCES
Enrico, A., Aron, R., & Oktavia, W. (2014). The Factors that Influenced Consumptive Behavior: A
Survey of University Students in Jakarta.
International Journal of Scientific and
Research Publications, Volume 4, Issue 1.
Ali, A. J., & Wisniesk, J. M. (2010). Consumerism and
ethical attitudes: an empirical study.
International Journal of Islamic and Middle
Eastern Finance and Management. Vol. 3
No. 1.
Berkman, H. C., & Gilson, C. C. (1978). Consumer behavior- Concepts and strategies.
Dickensoublishing Company, Inc, 521-524
Chon, K. (1990). The role of destination image in tourism: A review and discussion, The
Tourist Review, February, pp. 2-9.
Demeter, T. & Brautucu, G. (2014). Typologies Of Youth Tourism. Bulletin of Transilvania
University of Brasov. Series V: Economics
Sciences, Vol 7 (56).
Ferdinand, A. (2014). Metode Penelitian. Undip Press. Edisi 5.
Fratu, D. (2011). Factors of Influence and changes in
the Tourism Consumer Behavior. Bulletin of
the Transilvania University of Brasov. Vol.
4 (53). No. 1 – 2011. Series V: Economic Sciences.
Grande, I. (2005). Dimensions in scales for measuring exploratory tendencies and stimulation levels in consumers: a cross-cultural comparison of the USA and Spain. Journal
of Consumer Behavior. Vol 4 (5), 363-373.
Higgins, F. & Desbiolles. (2010). The Elusiveness of Sustainability in Tourism: The Culture-Ideology of Consumerism and its
Implications. Tourism and Hospitality
Research. Vol 10, 2.
Ismail, H. B. & Panni, M. F. A. K. (2008). Consumer
perceptions on the issues and its influence on their purchasing behavior: a view from
Malaysia Food industry. Journal of Legal,
Ethical and Regulatory Issues, Volume 11,
Number 1.
Ismail, H. B., Panni, M. F. A. K., & Talukder, Di. (2006).
Consumer perceptions on the environmental consumerism issue and its influence on their purchasing behavior. Allied Academies
International Conference.
Jones, P., Hillier, D., Comfort, Daphne, & Eastwood, I. (2005). Sustainable Retailing and
Concumerism. Management Research
News, Vol 28, 1.
Lamarto, (1985) Prinsip Pemasaran., Jilid I., Jakarta: Erlangga.
Litvin, S. W. (2008). Sensation seeking and its measurement for tourism research. Journal
of Travel Research. Vol 46, 440-445.
Litvin, S. & Ling, S. (2000). The destination attribute management model: an empirical application to Bintan, Indonesia, Tourism
Management, 22, pp. 481-492.
Lubis, Y. (1993). Pola Hidup Konsumtif: Antara
Kapitalisme dan Nafsu Prestise. Ekonomika.
1..XVII.47.Yogyakarta
Mullins, P. (1999). Managing Tourism in Cities: Policy, Process and Practice. Urban Studies, Vol 36, 11; ProQuest.
Comparative Study of Poland and Turkey.
International Journal of Business and Social
Science. Vol. 2 No. 19.
Radbata, A., & Fratu, D. (2010). Place Branding. Case
Study: Branding Romania. Brasov.
In: International Conference Business Excellence. No.2, p. 110-114
Sekaran, U., & Bougie, R. (2010). Research Methods For Business A Skill Building Approach.
Chichester, West Sussex: John Wiley & Sons
Ltd.
Sharpley, R. (1994). Tourism, Tourist and Society.
Chambridgeshire: ELM Publication.
Solomon, M. R. (2012). Consumer Behavior. Prentice
Hall. 10th Edition.
Ware, C. L. (2002). Consumerism, Credit Cards and
College Student. A Dissertation submitted to
the faculty of the department of humanities in candidacy for the degree of doctor of