PAPER • OPEN ACCESS
Predicted stand volume for Eucalyptus plantations by spatial analysis
To cite this article: Siti Latifah et al 2018 IOP Conf. Ser.: Earth Environ. Sci.126 012117
View the article online for updates and enhancements.
Predicted stand volume for
Eucalyptus
plantations by spatial
analysis
Siti Latifah1, Teodoro RV2, Myrna GC2, Nathaniel CB2 and Leonardo M F3
1
Forestry Faculty, Universitas Sumatera Utara, Medan, Indonesia 2
Forest Resources Management, University of the Philippines Los Banos, Los Banos, Philippines
3
Environmental Science, University of the Philippines Los Banos, Los Banos, Philippines
E-mail: sitilatifah [email protected]
Abstract. The main objective of the present study was to assess nonlinear models generated by integrating the stand volume growth rate to estimate the growth and yield of Eucalyptus. The primary data was done for point of interest (POI) of permanent sample plots (PSPs) and inventory sample plots, in Aek Nauli sector, Simalungun regency,North Sumatera Province,Indonesia. from December 2008- March 2009.Today,the demand for forestry information has continued to grow over recent years. Because many forest managers and decision makers face complex decisions, reliable information has become the necessity. In the assessment of natural resources including plantation forests have been widely used geospatial technology.The yield of Eucalyptus plantations represented by merchantable volume as dependent variable while factors affecting yield namely stands variables and the geographic variables as independent variables. The majority of the areas in the study site has stand volume class 0 - 50 m3/ha with 16.59 ha or 65.85 % of the total study site.
Keywords: merchantable volume, geographic, yield, Eucalyptus
1. Introduction
Forest management in the world is moving towards an ecosystem management framework. Thus, data on forest resources representing a defined ecosystem are needed. Forest inventory is one method of getting data that describe forest over broad. To design an appropriate forest inventory system, the application of the technique requires most of the investment. Observations and measurements are the basis for all data analysis and estimations in forest assessments. It is therefore imperative to guarantee a high level of data quality.
The challenge for development of forest plantations is to expose and identify various possibilities in the development of forest plantations regarding matching species, appropriate and environmentally sound technology, incentives and potential markets [3] . The maintenance of records of the extent and forest management activities greatly helps provide continuity of activity when individual forest managers change [2].Well-managed plantations of fast growing species are expected to yield higher than natural forests. The objective is to provide an estimate of the actual and potential yield of successfully established in the forest plantations. The fundamental for the success of plantation establishment is growth and yield Growth.
Geospatial technology considered an efficient tool for the capture, storage, retrieval and interactive analysis of complex information layers. Through computer modeling applied to an
Content from this work may be used under the terms of theCreative Commons Attribution 3.0 licence. Any further distribution of this work must maintain attribution to the author(s) and the title of the work, journal citation and DOI.
integrated forest resource database. It is possible to obtain reliable projections of such dynamics as timber and pulp supply, plantation inventory and monitoring [9].
2. Method
2.1. Study site
The research was conducted in Aek Nauli sector of Porsea subdistrict, Simalungun, North Sumatera Province, Indonesia. It is in the Industrial Timber Estate (Hutan Tanaman Industri - HTI) Medan, which is geographically situated between 02° 40’00” to 02° 50’00” north latitude and 98° 50’00” to
99° 10’00” east longitude [5].
2.2. Materials
The primary data and secondary data were digitally encoded. Secondary data were combined with primary data to develop stand volume for Eucalyptus spp. Data collection for primary data was done through a field survey. The primary data was done for point of interest (POI) of permanent sample plots (PSPs) and inventory sample plots [ 7 ]. Thera are 106 permanent sample plots (PSPs) which have an area of 3.44 ha and 544 inventory plots with area of 21.76 ha. The plots size are from 0.02 to 0.04 ha. The total area of this study site is 25.2 ha. Each selected sample plot was located in an area where the stand was of even age, uniformly spaced, and disease free. The validation of the predicted stand volume used ten percent (10%) of total plots equal to sixty- five (65) rhombic plots were taken with random samples.
2.3 Data analysis
Focus concentrated on physical measures of growth and yield in this study area namely, merchantable volume, because it forms the basis of value measures. Multiple Regression analysis are used for the modeling and analysis of numerical data consisting of values of a dependent variable (response variable) and independent variables (explanatory variables). This method enables one to determine whether the models follow the real world, can be examined using chi-square test of goodness of fit.
DB = dummy variable for group of soil dystropepts, Systran depts one if type of soil DB, 0 otherwise
DC = dummy variable for group of soil dystropepts, hapludults, one if type of soil DC, 0 otherwise
DD = dummy variable for group of soil dystropepts, humitropepts, one if type of soil DC, 0 otherwise
Logarithmically transforming variables in a regression model is a very common way to handle situations where a non-linear relationship exists between the independent and dependent variables.The recent development of growth and yield models for Eucalyptus plantations have already been generated by some research such as [1], [4], [6] and [7]
Transformation of the attribute data in the geodata base was made according to various mathematical functions of the variables. Regression analyses were done to derive the equation of
Eucalyptus at stand level using SAS. The results from the best model were used to develop GIS of
growth and yield in this study area. All relevant data were processed using the view-add theme, and land features were updated with the Arc View Xtools function. The maps were intersected using the Geoprocessing Wizard Extension[ 10]. The area with similar attributes were grouped to comprise one landscape unit.
3. Results and Discussions
There are three subsections to be discussed in this study area; they are species groups, the best model and spatial analysis of predicted stand volume of Eucalyptus stands.
3.1. Species groups
In this study area, we grouped the genetic variation among them into species namely Eucalyptus.
hybrid, Eucalyptus grandis, Eucalyptus pellita, Eucalyptus urophylla, and Mixed eucalyptus.
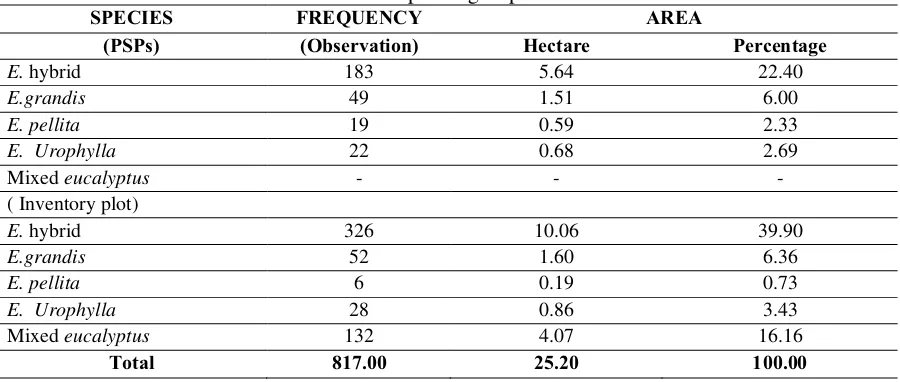
Distribution of species groups are shown in Table 1. Most areas are dominated by Eucalyptus hybrid with area 5.64 ha or 22.4% of the total study area for PSPs and 10.06 ha or 39.9 % of the total study area for inventory plots. The lowest area is predominated by Eucalyptus pellita with 0.59 ha or 2.33% of the total study area for PSPs and 0.19 ha or 0.73 % % of the total study area.
3.2. The best model for predicted stand volume
Base on the creieria for assesing the best model, model 2 of the stepwise procedure was found consistently for predicted stand volume .This is caused by the highest total score of weighted = 0.6541, R2 = 0.9033 and r = 0.9504, and the lowest of MSE = 0.7763 and C(p) = 2.2983. All of the independent variables are significant, and7/8 of the independent variables is not multicollinearity ( Table2).
Table 1. Distribution of species groups in Aek Nauli sector.
SPECIES FREQUENCY AREA
(PSPs) (Observation) Hectare Percentage
Table 2. The criteria for assesing the best model for predicted stand volume.
The final model for all species is:
V = exponential [(-1.07511) + 0.50996 ( ln Basal Area *ln Total High) -1.39383 (Age-1) - 0.51483 (Side Index -1)+ 0.11307 ( Spacing) + 0.04181 ( Top Soi) + 0.00103 ( Rain fall) -0.22406 (DA)] (2)
Some of the more important factors such as standing age, site quality, genetic variation, stand density, management regime and environmental conditions affect growth and yield of Eucalyptus plantations. The yield of Eucalyptus plantations represented by merchantable volume as dependent variable while factors affecting yield namely stands variables and the geographic variables as independent variables. To show all these factors in the map is very important as the database for the research area and useful for managing activities.
3.3 Spatial analysis of predicted stand volume of Eucalyptus stand
The integration of GIS and regression analysis to predict growth and yield models is the least explored and implemented in GIS software environment using vector data models [11]. Regarding the
regression equations were tested to determine the best model to predict growth and yield of stand used
the criteria as mentioned before. In GIS, assessment, monitoring, and evaluation take on a spatial perspective, and the process is facilitated through the different GIS functionalities [2]. Furthermore, tables are saved as *.dbf (dbase-file) and used Arc View GIS software to process the spatial model [10]. The result of the best model to predict growth and yield of Eucalyptus plantations are shown in Table 3 and Figure 1.
Figure 1. Map of predicted stand volume in Aek Nauli sector, North Sumatra, Indonesia.
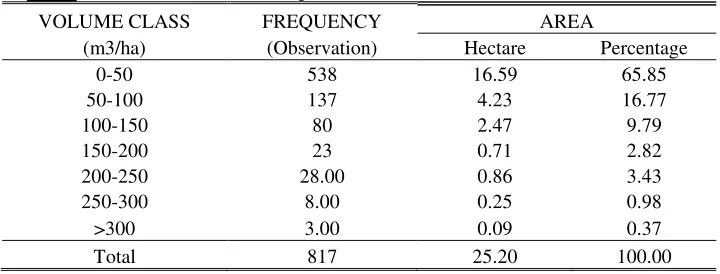
The majority of the areas in the study site has stand volume class 0 - 50 m3/ha with 16.59 ha or 65.85 % of the total study site and the smallest area has greater than 300 m3/ha with 0.09 ha or 0.13% of the total study site. The yield averages are 45.64 m3/ha fall in 50-100 m3/ha, the maximum and minimum are 331. 06 m3/ha, and 0.028 m3/ha respectively, and the most extensive area is very low productivity of yield ( Table 3 .and figure2)
Table 3. Distribution of predicted stand volume in Aek Nauli sector.
VOLUME CLASS FREQUENCY AREA
(m3/ha) (Observation) Hectare Percentage
0-50 538 16.59 65.85
50-100 137 4.23 16.77
100-150 80 2.47 9.79
150-200 23 0.71 2.82
200-250 28.00 0.86 3.43
250-300 8.00 0.25 0.98
>300 3.00 0.09 0.37
Total 817 25.20 100.00
4. Conclusions
Forest growth models have become indispensable tools for forest management. Informed plantation management requires a good data base, since the quality of information depends on the quality of data, growth models and other planning tools. There is considerable potential to link GIS, environmental modeling and forest growth and yield modeling. This research has identified some of the opportunity for such applications. The use of GIS facilitates for the assessment of forest resources that can serve as basis for sound planning at better solutions for forest resources management.
Acknowledgments
The authors extend deeply acknowledgment to the Ministry of Education and Culture – Republics
Indonesia for scholarship and appreciation is also extended to the anonymous reviewer for correction and comments.
References
[1] Dube T, Mutanga O, Rahman EMA, Ismail R and Slotow R 2015 Predicting Eucalyptus spp. stand volume in Zululand, South Africa: an analysis using a stochastic gradient boosting regression ensemble with multi-source data sets International Jounal of Remate sensing vol
36 (2015)
[2] Fabrízzio Alphonsus A M N Soares, Edna Lúcia Flôres, Christian Dias Cabacinha, Gilberto Arantes Carrijo, Antônio Cláudio Paschoarelli Veiga.2011. Recursive diameter prediction and volume calculation of eucalyptus trees using Multilayer Perceptron Networks. Computers and Electronics in Agriculture 78 (2011) 19–27
[3] Hua, L Z, J Morris, X B He and X D Jiang 2007 Predicting Eucalyptus production in Southern China using The 3-PG Model Journal of Tropical Forest Science (Jul 2007) 19.3. 127 pg [4] JA Blanco and E González. 2010. Exploring The Sustainability of Current Management
Prescriptions For Pinus Caribaea Plantations In Cuba: A Modelling Approach. Journal of
Tropical Forest Science vol 22 no 2 (April 2010) pp 139-54
[5] PERSEROAN TERBATAS TOBA PULP LESTARI (PT. TPL) 2008 Summary of the Annual Work Plan Efforts Timber Forest Products Utilization in the Industrial Timber Plantation Forests
[6] Packalen P, Maltamo M, Mehtatalo L 2011 ALS-based estimation of plot volume and site index in a Eucalyptus plantation with a nonlinear mixed-effect model that accounts for the clone effect Ann For Sci. 2011 (68) 1085–92 doi: 10.1007/s13595-011-0124-9
[7] Pereira Aj, Helio G L, Joao C C C and Agostinho L S 2006 Use Data from Permanent Sampling
Point in Growth and Yield Modeling http://www.scielo.br/scielo.php
[8] Silva, A L, Joao, C C C, Helio, G L Agustinho, L D S and Pablo, F L 2007 Growth and Yield Prediction Using The Modified Buckman Model Revista Árvore vol 30 no 5 Viçosa Sept/Oct 2006
[9] Sheng Zheng,Chunxuang Cao,Yongfeng Dang, Haibing Xiang, Jian Zhao, Yuxing Zhang, uejun Wang, and Hongwen Guo 2013 Retrieval of forest growing stock volume by two different methods using Landsat TM images International Journal of Remote Sensing vol 35 (2014) Issue 1
[10] Sohrabi, H 2012 Estimating Mixed Broadleaves Forest Stand Volume Using Dsm Extracted From Digital Aerial Images 2012 International Archives of the Photogrammetry, Remote Sensing
and Spatial Information Sciences vol XXXIX-B8 (2012)
[11] Weiskitted A R, Kenefic, L S, Seymour, R S and L R Philips 2009 Long term effects of precommercial thinning on the stem dimension, form and branch chaacteristics of red spruce
and balsam fir crop trees in Maine, USA (Silva Fennica) 43 (3) 397-409