Making
Standards
Useful
i n t h e
c l a s s r o o m
marzano
Robert J.
Mark W.
haystead
• What are the steps to follow in “unpacking” and rewriting standards so they are
• What is a “measurement topic,” and what kind of content should it include?
• How can measurement topics be organized into a coherent system for learning
• Why is averaging a flawed method for calculating grades?
Making
Standards
Useful
i n t h e
Making
Standards
Useful
i n t h e
c l a s s r o o m
marzano
Robert J.
J.
Mark W.
haystead
Association for Supervision and Curriculum Development
Association for Supervision and Curriculum Development 1703 N. Beauregard St. • Alexandria, VA 22311-1714 USA Phone: 800-933-2723 or 703-578-9600 • Fax: 703-575-5400 Web site: www.ascd.org • E-mail: [email protected] Author guidelines: www.ascd.org/write
Gene R. Carter, Executive Director; Nancy Modrak, Publisher; Julie Houtz, Director of Book Editing & Production; Darcie Russell, Project Manager; Reece Quiñones, Senior Graphic Designer;Valerie Younkin, Desktop Publishing Specialist; Dina Murray Seamon, Production Specialist/Team Lead
Copyright © 2008 by the Association for Supervision and Curriculum Development (ASCD). All rights reserved. No part of this publication may be reproduced or transmitted in any form or by any means, electronic or mechanical, including photocopy, recording, or any information storage and retrieval system, without permission from ASCD. Readers who wish to duplicate material copyrighted by ASCD may do so for a small fee by contacting the Copyright Clearance Center (CCC), 222 Rosewood Dr., Dan-vers, MA 01923, USA (phone: 978-750-8400; fax: 978-646-8600; Web: www.copyright.com). For requests to reprint rather than photocopy, contact ASCD’s permissions office: 703-575-5749 or permissions@ ascd.org. Translation inquiries: [email protected].
Printed in the United States of America. Cover art copyright © 2008 by ASCD. ASCD publications pres-ent a variety of viewpoints. The views expressed or implied in this book should not be interpreted as official positions of the Association.
All Web links in this book are correct as of the publication date below but may have become inac-tive or otherwise modified since that time. If you notice a deactivated or changed link, please e-mail [email protected] with the words “Link Update” in the subject line. In your message, please specify the Web link, the book title, and the page number on which the link appears.
PAPERBACK ISBN: 978-1-4166-0648-2 ASCD product #108006 s3/08
Also available as an e-book through ebrary, netLibrary, and many online booksellers (see Books in Print for the ISBNs).
Quantity discounts for the paperback edition only: 10–49 copies, 10%; 50+ copies, 15%; for 1,000 or more copies, call 800-933-2723, ext. 5634, or 703-575-5634. For desk copies: [email protected].
Library of Congress Cataloging-in-Publication Data Marzano, Robert J.
Making standards useful in the classroom / Robert J. Marzano and Mark W. Haystead. p. cm.
Includes bibliographical references.
ISBN 978-1-4166-0648-2 (pbk. : alk. paper) 1. Education—Standards—United States. 2. Educational evaluation—United States. 3. Grading and marking (Students)—United States. I. Haystead, Mark W., 1969– II. Association for Supervision and Curriculum Development. III. Title.
LB3060.83.M379 2008 379.1’59—dc22
2007042402
18 17 16 15 14 13 12 11 10 09 08 1 2 3 4 5 6 7 8 9 10 11 12
To my family—Jana, Todd and Whitney, Christine
and Mark, Carmen and Tomi, Ashley, Cecilia, Aida,
and Jacob
—Robert
J.
Marzano
To my family—Christine, my wife and best friend,
you are truly the wind beneath my wings. Cecilia and
Aida, I am so proud to be your dad; keep reaching
for the stars.
Making
Standards
Useful
i n t h e c l a s s r o o m
Part I: Using Standards and Measurement Topics
1. Standards in Education . . . 3
2. Unpacking Standards and Designing Measurement Topics . . . 12
3. A Scale Format for Measurement Topics . . . 28
4. A Formative Assessment System Using Measurement Topics . . . 36
5. Grades and Report Cards Using Measurement Topics . . . 44
Part II: Scoring Scales
Language Arts . . . 56
Writing . . . 57
Language . . . 75
Reading . . . 88
Listening and Speaking . . . 104
Mathematics . . . 116
Numbers and Operations . . . 117
Algebra . . . 133
Geometry . . . 143
Measurement . . . 155
Science . . . 178
Earth and Space Sciences . . . 179
Life Sciences . . . 192
Physical Sciences . . . 210
Nature of Science . . . 224
Social Studies . . . 234
Citizenship, Government, and Democracy . . . 235
Culture and Cultural Diversity . . . 248
Economics . . . 253
History . . . 263
Geography . . . 272
Life Skills . . . 278
Participation . . . 279
Work Completion . . . 282
Behavior . . . 285
Working in Groups . . . 288
References . . . 291
Using Standards
3
The standards movement in the United States has a long and interesting
his-tory. Many trace its genesis back to the publication of
A Nation at Risk
, which
sounded the following alarm: “The education foundations of our society are
presently being eroded by a rising tide of mediocrity that threatens our very
future as a nation and a people. . . . We have, in effect, been committing an
act of unthinking, unilateral educational disarmament” (National Commission
on Excellence in Education, 1983, p. 5). These ominous words sparked a flood
of impassioned pleas to upgrade the K–12 educational system in the United
States.
In September 1989, President George H. W. Bush convened the nation’s
governors at an Education Summit in Charlottesville, Virginia. The summit
identified six broad national goals that were to be reached by the year 2000.
In general terms, those goals called for U.S. students to master complex
aca-demic content in English, mathematics, science, history, and geography. The
goals were showcased in the 1990 State of the Union address.
That same year, the National Education Goals Panel (NEGP) was
estab-lished; the following year, the National Council on Education Standards and
Testing (NCEST) was established. Together these two groups were to deal
with such implementation issues as which standards would be addressed,
the performance levels that would be expected for these standards, and the
types of assessments that would be used. Subject matter organizations were
called upon to identify the knowledge that all students would be expected to
learn within their domains. The National Council of Teachers of
Mathemat-ics (NCTM) took the lead in these efforts by publishing its
Curriculum and
Evaluation Standards for School Mathematics
in 1989. Other subject matter
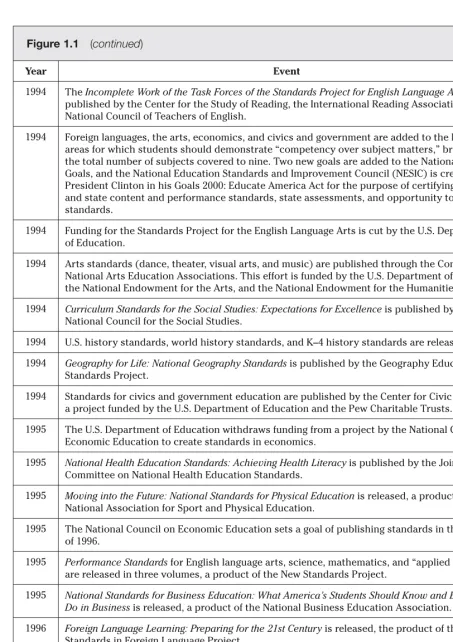
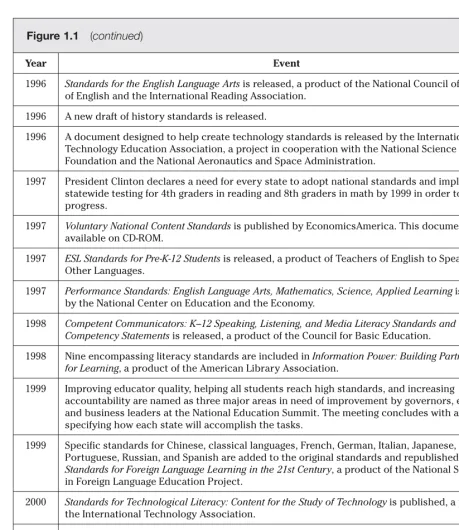
organizations followed suit. Figure 1.1 outlines the major events in the design
of standards documents in the subject areas from 1989 through 2000, at which
time the major national and state-level standards documents were in place.
Standards in Education
4
Figure 1.1 Major Events in the Development of Subject Matter Standards, 1989–2000
Year Event
1989 The 50 governors and President George H. W. Bush identify English, mathematics, science, history, and geography as subjects in need of challenging national achievement standards in National Education Goals for the year 2000.
1989 The National Council of Teachers of Mathematics publishes Curriculum and Evaluation Standards for School Mathematics.
1989 Project 2061 of the American Association for the Advancement of Science (AAAS) publishes Science for All Americans, outlining which “understandings and habits of mind are essential for all citizens of a scientifically literate society.”
1990 President Bush announces the National Education Goals for the year 2000 and works with Congress to establish a National Education Goals Panel (NEGP).
1990 To determine the skills young people need for success in the working world, the U.S. secretary of labor appoints the Secretary’s Commission on Achieving Necessary Skills (SCANS).
1990 The National Center on Education and the Economy and the Learning Research and Development Center create the New Standards Project to define standards for student achievement in a number of areas.
1991 The knowledge and skills essential for the working world are described in a SCANS document titled What Work Requires of Schools.
1992 The U.S. Department of Education teams up with the National Endowment for the Humanities to provide funding for the National History Standards Project.
1992 The National Association for Sport and Physical Education develops Outcomes for Quality Physical Education Programs, setting a foundation for physical education standards.
1992 The U.S. Department of Education teams up with the National Endowment for the Arts and the National Endowment for the Humanities to fund the writing of standards for the arts through the Consortium of National Arts Education Associations.
1992 Standards for civics and government are written by the Center for Civic Education with financial help from the U.S. Department of Education and the Pew Charitable Trusts.
1992 The Geography Standards Education Project writes the first standards for geography.
1992 The American Cancer Society funds the Committee for National Health Education.
1992 The federal government provides funds to the National Council of Teachers of English, the International Reading Association, and the Center for the Study of Reading at the University of Illinois to create English language arts standards.
1993 Foreign language standards are formed with federal funding through the National Standards in Foreign Language Project.
1993 AAAS’s Project 2061 publishes Benchmarks for Science Literacy.
1993 “The Malcolm Report,” also known as Promises to Keep: Creating High Standards for American Students, is released. The document is compiled by the NEGP and recommends creating a National Education Standards and Improvement Council (NESIC) whose presence would enable voluntary national standards to exist.
1993 Standards development, teaching, and assessment are overseen by the National Committee on Science Education Standards and Assessment (NCSESA) with funding from the U.S. Department of Education, the National Research Council, and the National Science Foundation.
Standards in Education 5
Figure 1.1
(
continued
)
Year Event
1994 The Incomplete Work of the Task Forces of the Standards Project for English Language Arts is published by the Center for the Study of Reading, the International Reading Association, and the National Council of Teachers of English.
1994 Foreign languages, the arts, economics, and civics and government are added to the list of areas for which students should demonstrate “competency over subject matters,” bringing the total number of subjects covered to nine. Two new goals are added to the National Education Goals, and the National Education Standards and Improvement Council (NESIC) is created by President Clinton in his Goals 2000: Educate America Act for the purpose of certifying national and state content and performance standards, state assessments, and opportunity to learn standards.
1994 Funding for the Standards Project for the English Language Arts is cut by the U.S. Department of Education.
1994 Arts standards (dance, theater, visual arts, and music) are published through the Consortium of National Arts Education Associations. This effort is funded by the U.S. Department of Education, the National Endowment for the Arts, and the National Endowment for the Humanities.
1994 Curriculum Standards for the Social Studies: Expectations for Excellence is published by the National Council for the Social Studies.
1994 U.S. history standards, world history standards, and K–4 history standards are released.
1994 Geography for Life: National Geography Standards is published by the Geography Education Standards Project.
1994 Standards for civics and government education are published by the Center for Civic Education, a project funded by the U.S. Department of Education and the Pew Charitable Trusts.
1995 The U.S. Department of Education withdraws funding from a project by the National Council on Economic Education to create standards in economics.
1995 National Health Education Standards: Achieving Health Literacy is published by the Joint Committee on National Health Education Standards.
1995 Moving into the Future: National Standards for Physical Education is released, a product of the National Association for Sport and Physical Education.
1995 The National Council on Economic Education sets a goal of publishing standards in the winter of 1996.
1995 Performance Standards for English language arts, science, mathematics, and “applied learning” are released in three volumes, a product of the New Standards Project.
1995 National Standards for Business Education: What America’s Students Should Know and Be Able to Do in Business is released, a product of the National Business Education Association.
1996 Foreign Language Learning: Preparing for the 21st Century is released, the product of the National Standards in Foreign Language Project.
1996 National Science Education Standards is released, a product of the National Research Council.
Making Standards Useful in the Classroom 6
Figure 1.1
(
continued
)
Year Event
1996 Standards for the English Language Arts is released, a product of the National Council of Teachers of English and the International Reading Association.
1996 A new draft of history standards is released.
1996 A document designed to help create technology standards is released by the International Technology Education Association, a project in cooperation with the National Science Foundation and the National Aeronautics and Space Administration.
1997 President Clinton declares a need for every state to adopt national standards and implement statewide testing for 4th graders in reading and 8th graders in math by 1999 in order to monitor progress.
1997 Voluntary National Content Standards is published by EconomicsAmerica. This document is also available on CD-ROM.
1997 ESL Standards for Pre-K-12 Students is released, a product of Teachers of English to Speakers of Other Languages.
1997 Performance Standards: English Language Arts, Mathematics, Science, Applied Learning is released by the National Center on Education and the Economy.
1998 Competent Communicators: K–12 Speaking, Listening, and Media Literacy Standards and Competency Statements is released, a product of the Council for Basic Education.
1998 Nine encompassing literacy standards are included in Information Power: Building Partnerships for Learning, a product of the American Library Association.
1999 Improving educator quality, helping all students reach high standards, and increasing
accountability are named as three major areas in need of improvement by governors, educators, and business leaders at the National Education Summit. The meeting concludes with a goal of specifying how each state will accomplish the tasks.
1999 Specific standards for Chinese, classical languages, French, German, Italian, Japanese, Portuguese, Russian, and Spanish are added to the original standards and republished as Standards for Foreign Language Learning in the 21st Century, a product of the National Standards in Foreign Language Education Project.
2000 Standards for Technological Literacy: Content for the Study of Technology is published, a product of the International Technology Association.
2000 National Educational Technology Standards for Students: Connecting Curriculum and Technology is published, a product of the International Society for Technology in Education.
2000 Principles and Standards for School Mathematics is released, a product of the National Council of Teachers of Mathematics.
Figure 1.1 adds some detail to the rich history of the modern standards
movement and attests to the prominence of the movement in the 1980s and
1990s. Discussing the movement’s impact, Robert Glaser and Robert Linn
(1993) explain:
Standards in Education 7
concentrated press for national educational standards emerged. The press for standards was evidenced by the efforts of federal and state legislators, presi-dential and gubernatorial candidates, teachers and subject-matter specialists, councils, governmental agencies, and private foundations. (p. xiii)
Glaser and Linn made their comments at the end of the 20th century. There
is no indication that the standards movement has lost any momentum at the
beginning of the 21st century.
Flaws in the Standards
Given the power of the standards movement, one might assume that national
standards and state standards have enhanced the daily practice of K–12
education. Although it is true that in many states teachers are aware of the
content of their state standards because school districts have aligned
grade-level curriculums with state and national standards, it is not necessarily true
that the standards movement has enhanced the life of the classroom teacher.
In fact, a case can be made that state and national standards, as currently
designed, detract from a teacher’s ability to teach effectively. At least two
rea-sons account for this unfortunate situation: the standards articulate too much
content, and they lack unidimensionality.
Too Much Content
State and national standards articulate far too much content. To illustrate,
researchers at Mid-continent Research for Education and Learning (McREL)
identified some 200 standards and 3,093 benchmarks in national and
state-level documents across 14 subject areas (Kendall & Marzano, 2000). They
then asked classroom teachers how long it would take to address the content
in those standards and benchmarks. When the researchers compared the
estimated amount of time it would take to teach the content in the standards
documents with the amount of time that is available for classroom
instruc-tion, they found that addressing the mandated content would require 71
percent more instructional time than is now available (Marzano, Kendall, &
Gaddy, 1999). Looking at this situation in another way, schooling, as currently
configured, would have to be extended from kindergarten to grade 21 or 22 to
accommodate all the standards and benchmarks in the national documents.
Certainly this is not possible.
Making Standards Useful in the Classroom 8
have not identified the state. In fact, just about any state document could have
been used to make the same point.)
Given that the state document has more than 120 statements like those in
Figure 1.2 and that the school year comprises only 180 days, a teacher would
have to teach and assess the content in one statement every one-and-one-half
days to address all the statements in one year. This situation is troublesome
for classroom teachers. Even though their schools or districts might have
organized the content in the state standards into a set of learning objectives
for students and perhaps even sequenced those objectives, teachers have
little option other than to select the content they will actually teach, leaving
the rest untaught; or they must attempt the impossible task of covering all the
content while effectively teaching none of it.
Lack of Unidimensionality
Even if state and national standards did not have too much content, they
still suffer from a major flaw as written: they typically mix multiple dimensions
in a single statement. Multiple dimensions make it almost impossible to
effec-tively assess the content in standards, particularly if teachers use formative
assessment (we discuss formative assessment in more depth shortly).
A basic principle underlying measurement theory is that a single score on
a test should represent a single dimension or trait that has been assessed; this
is referred to as the principle of unidimensionality (Hattie, 1984, 1985; Lord,
1959). Unfortunately, standards documents are not written with
unidimen-sionality or effective assessment in mind. To illustrate, consider the following
benchmark statement from the mathematics standards document published
by the National Council of Teachers of Mathematics (2000), which articulates
what students should know and be able to do by the end of the 5th grade:
Figure 1.2 Sample Competency Statements for 5th Grade
Language Arts from a State Document
1. Apply prior knowledge and experience to make inferences and respond to new information presented in text.
2. Draw inferences and conclusions about text and support them with textual evidence and prior knowledge.
3. Describe elements of character development in written works (e.g., differences between main and minor characters; stereotypical characters as opposed to fully developed characters; changes that characters undergo; the importance of character’s actions, motives, and appearance to plot and theme).
4. Make inferences or draw conclusions about characters’ qualities and actions (e.g., based on knowledge of plot, setting, characters’ motives, characters’ appearances, other characters’ responses to a character).
Standards in Education 9
• Develop fluency in adding, subtracting, multiplying, and dividing whole numbers. (p. 392)
The information and skills in the benchmark are certainly related—they all
involve computation with whole numbers. However, the underlying processes
are not the same and, in fact, might be quite different (Anderson, 1983). This
single benchmark most probably addresses four separate dimensions:
• The process of adding whole numbers
• The process of subtracting whole numbers
• The process of multiplying whole numbers
• The process of dividing whole numbers
This “unpacking” is informative in itself because it demonstrates how much
subject matter content might be embedded in standards documents.
Specifi-cally, the NCTM standards document contains only 241 benchmarks that span
grades K through 12. One might assume that the NCTM document therefore
addresses 241 dimensions. However, when the benchmarks in the document
were unpacked as demonstrated here, more than 741 unique elements were
revealed (Marzano, 2002).
In addition to making effective assessment difficult for the classroom
teacher, the lack of unidimensionality of standards in state and national
docu-ments causes problems for classroom instruction. Consider again the single
NCTM benchmark that includes addition, subtraction, multiplication, and
division. Obviously these four operations are not to be taught simultaneously.
In effect, districts, schools, or individual teachers must unpack this single
benchmark statement to determine the scope and sequence of instruction for
the content embedded within it.
In summary, national and state standards documents, as written, pose
serious barriers to effective instruction and effective assessment for
class-room teachers. This book provides a viable way of overcoming those barriers
and rendering standards a vital, positive force in the work of classroom
teach-ers. Although our recommended solution will positively affect instruction,
our main emphasis in this book is a particular form of classroom assessment:
formative assessment.
The Benefits of Formative Assessment
Making Standards Useful in the Classroom 10
report data on every student for specific areas of knowledge and skill that are
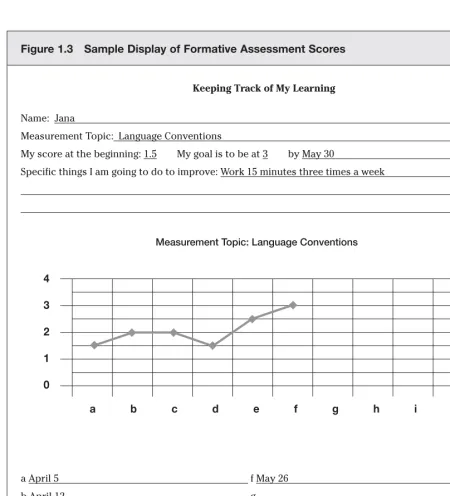
referred to as “measurement topics.” Figure 1.3 depicts how data might be
displayed for one measurement topic for a specific student.
Figure 1.3 displays six formative assessment scores for a student named
Jana on a specific language arts measurement topic, Language Conventions.
(In Chapter 4, we consider how these scores are obtained and used.) The
benefits of a system like this are many. First, the visual display itself will most
Figure 1.3 Sample Display of Formative Assessment Scores
Keeping Track of My Learning
Name: Jana
Measurement Topic: Language Conventions
My score at the beginning: 1.5 My goal is to be at 3 by May 30
Specific things I am going to do to improve: Work 15 minutes three times a week
a April 5 f May 26
b April 12 g
c April 20 h
d April 30 i
e May 12 j
Measurement Topic: Language Conventions
4
3
2
1
0
Standards in Education 11
likely enhance both the teacher’s interpretation of formative data and the
student’s ability to see her progress (Fuchs & Fuchs, 1986). Second, a display
like this allows for tracking and celebrating knowledge gain. That is, a student
who has advanced from a score of 1.0 to a score of 2.5 on a measurement
topic has gained 1.5 scale points. Likewise, a student who began with a score
of 2.0 and advanced to a score of 3.5 has gained 1.5 scale points. We can
cel-ebrate knowledge gain for both students. This is not to say that we should not
acknowledge and also celebrate “status.” That is, we should recognize those
students who have obtained high scores of 4.0 and 3.0 on a scale of 0 through
4.0. However, it is equally important to acknowledge those students who have
demonstrated gains in knowledge regardless of where they began.
A system of classroom formative assessment like that described in
Class-room Assessment and Grading That Work
(and in Chapter 4 of this book) allows
for a type of report card that provides specific information to parents and
students regarding areas where students are progressing well versus areas
where additional help must be provided. We discuss such report cards in
Chapter 5.
Reconstituting Standards Documents
As formidable as these barriers to the usefulness of standards documents
might seem, they can be overcome if a district or school is willing to
recon-stitute the knowledge in their standards documents. The need to reconrecon-stitute
state standards and benchmarks has been addressed by many researchers,
theorists, and consultants who work with districts and schools to implement
standards-based education (see Ainsworth, 2003a, 2003b; Reeves, 2002;
Wig-gins & McTighe, 2005). In this book we present a system that translates
stan-dards documents into a format that is designed to make stanstan-dards useful for
formative assessment and to guide classroom instruction.
Summary
12
Unpacking Standards and
Designing Measurement Topics
2
The first step in reconstituting standards documents is to unpack the
marks with the intent of designing measurement topics. Unpacking
bench-marks simply involves identifying the unique elements of information and skill
in each benchmark statement. We have found that subject matter specialists
are quite skilled and efficient at doing this task. Consequently, a district need
only assemble its expert mathematics teachers and curriculum specialists to
unpack the mathematics standards, assemble the expert science teachers and
curriculum specialists to unpack the science standards, and so on.
To illustrate, consider the following 5th grade benchmark for the
Measure-ment standard from the Ohio state standards docuMeasure-ment titled
Academic
Con-tent Standards: K–12 Mathematics
(Ohio Department of Education, 2001):
1. Identify and select appropriate units to measure angles; i.e., degrees. 2. Identify paths between points on a grid or coordinate plane and compare the lengths of the paths; e.g., shortest path, paths of equal length.
3. Demonstrate and describe the differences between covering the faces (sur-face area) and filling the interior (volume) of three-dimensional objects. 4. Demonstrate understanding of the differences among linear units, square units and cubic units.
5. Make conversions within the same measurement system while performing computations.
6. Use strategies to develop formulas for determining perimeter and area of triangles, rectangles and parallelograms, and volume of rectangular prisms. 7. Use benchmark angles (e.g., 45°, 90°, 120°) to estimate the measure of angles, and use a tool to measure and draw angles. (pp. 72–73)
Unpacking Standards 13
essential, delete content that is not amenable to classroom assessment, and
combine content that is highly related. Following these guidelines, a district’s
mathematics teachers and curriculum specialists might restate the seven
ele-ments as follows:
1. Demonstrate a basic understanding of degrees and use of benchmark angles (i.e., 45°, 90°, and 120°) to estimate and draw angles.
2. Demonstrate an understanding of various types of units of measure (e.g., linear units, square units) and convert between units within the same mea-surement.
3. Identify and compare paths between points on a grid or a coordinate plane.
4. Demonstrate an understanding of the difference between covering the faces (surface area) and filling the interior (volume) of three-dimensional objects. 5. Develop formulas for determining perimeter and area of triangles, rect-angles, and parallelograms, and volume of rectangular prisms.
This listing of benchmark elements is somewhat more condensed than the
previous listing. The original Statements 1 and 7 have been combined (see
new Statement 1) because they both address degrees and angles—concepts
that would probably be taught together. Original Statements 4 and 5 have been
combined (see new Statement 2) because they both address units of measure.
As we shall see in subsequent chapters, these new statements can be pared
further when levels of complexity are considered.
One common convention not illustrated in this example is that often
state-ments are dropped when benchmarks are reconstituted. To illustrate,
con-sider the following examples, which are representative of statements found in
state and national documents:
• Explore the use of mathematical patterns.
• Demonstrate an interest in reading a variety of genres.
• Make observations of scientific interest.
• Participate in discussions regarding issues of social interest.
These statements are simply too general to be amenable to effective
measure-ment or instruction. In effect, we have found that the process of rewriting
benchmark statements commonly results in trimming the amount of content
in standards documents considerably.
Finally, we should note that many times curriculum specialists and subject
matter teachers find benchmark statements perfectly useful as stated. To
illus-trate, consider the following 8th grade science statements regarding motions
and forces from the Oklahoma state standards:
1. The motion of an object can be measured. The position of an object, its speed and direction can be represented on a graph.
Making Standards Useful in the Classroom 14
These statements are clear and focused and consequently quite useful for
assessment and instruction as written.
It is hard to overemphasize the importance of dramatically decreasing
the number of benchmark statements explicit and implicit in standards
docu-ments. Recall from Chapter 1 that unpacking the 241 benchmark statements
from the national NCTM standards document led to the identification of 741
dimensions. This massive array of content must be pared substantially to fit
into the time available for instruction. Again, this can be done fairly efficiently
by using expert teachers and curriculum specialists.
To illustrate, consider the aforementioned study regarding mathematics
(Marzano, 2002). Specifically, 10 mathematics educators were shown the 741
mathematics dimensions drawn from the national mathematics standards
(National Council of Teachers of Mathematics, 2000) and asked to identify
those that were essential for all students to learn. Each educator
indepen-dently rated each of the 741 dimensions. Combining the ratings produced
a list of 404 essential dimensions—a reduction of 46 percent. Following this
same basic process, a district or school might convene its subject matter
specialists and give them the task of dramatically paring the content as they
unpack and rewrite the standards.
Forming Measurement Topics
Once benchmark statements have been restated and their number
dramati-cally reduced, the next step is to organize the statements identified as
essen-tial into categories of related elements referred to as “measurement topics.”
Of course, the critical aspect of this step is clarity about what we mean when
we say that dimensions are “related.” The concept of “covariance” clarifies
this issue nicely.
Covariance means that as ability in one dimension increases, so does
that in another. (For a more technical discussion of covariance, see Marzano,
2006.) One thing to keep in mind regarding the covariance of dimensions is
that it is partly a function of instruction. To illustrate, reconsider the
dimen-sions that were embedded in the NCTM benchmark:
• The process of adding whole numbers
• The process of subtracting whole numbers
• The process of multiplying whole numbers
• The process of dividing whole numbers
Unpacking Standards 15
a measurement topic, overlap in their component parts and are commonly
taught together or are taught in relationship to one another.
To get a sense of a measurement topic composed of covarying dimensions,
consider Figure 2.1, which lists the covarying dimensions for the measurement
topic Reading for Main Idea. (It is important to note that Figure 2.1 does not
represent the final format for a measurement topic. Chapter 3 presents a
pre-ferred, rubric-based format.) For grade 8, the measurement topic states that
while engaged in grade-appropriate reading tasks, the student demonstrates
an ability to do the following:
• identify complex causal relationships (
e.g., observing that the plight of
Anne Frank in
The Diary of Anne Frank
is the result of causes ranging from the
policies of the Nazis in Amsterdam to the childhood of Adolph Hitler
);
• identify and react to textual arguments (
e.g., summarizing the argument
presented and explaining why he was persuaded or not
);
• identify problems that cannot or will not be solved in the text (
e.g.,
observing that a story about the fate of Native Americans will not include a
solu-tion to the problem of the U.S. government taking their lands
); and
• identify complex plots with multiple story lines (
e.g., observing that
understanding a story following people in different social classes during a
spe-cific time involves understanding not only the stories of those spespe-cific people, but
how their stories interact
).
At the heart of this measurement topic is the ability to identify patterns of
information in texts. One might say that this dynamic operationally defines
“reading for main idea.” For example, if an 8th grade student reads
The Red
Badge of Courage
, an important part of understanding the main idea of the
book is identifying the various aspects of the plot and discerning the various
story lines (i.e.,
identify complex plots with multiple story lines
). If a student
reads an editorial on the benefits of strictly enforced laws regarding the
envi-ronment, understanding the main idea of the editorial is synonymous with
discerning the basic aspects of the implicit and explicit arguments laid out by
the author of the editorial (i.e.,
identify and react to textual arguments
).
Including these dimensions in the same measurement topic asserts that as
a student’s ability to identify patterns of information involving complex plots
with multiple story lines increases, so too does her ability to identify patterns
of information involving textual arguments, as does her ability to identify
pat-terns of information involving complex causal relationships, and so on.
Making Standards Useful in the Classroom 16
Figure 2.1 Measurement Topic: Reading for the Main Idea
Stem While engaged in grade-appropriate reading tasks, the student demonstrates an ability to . . .
Grade 8 • identify complex causal relationships(e.g., observing that the plight of Anne Frank in The Diary of Anne Frank is the result of causes ranging from the policies of the Nazis in Amsterdam to the childhood of Adolph Hitler);
• identify and react to textual arguments (e.g., summarizing the argument presented and explaining why he was persuaded or not);
• identify problems that cannot or will not be solved in the text (e.g., observing that a story about the fate of Native Americans will not include a solution to the problem of the U.S. government taking their lands); and
• identify complex plots with multiple story lines (e.g., observing that understanding a story following people in different social classes during a specific time involves understanding not only the stories of the specific people, but how their stories interact).
Grade 7 • identify complex causal relationships(e.g., when reading about the Japanese internment camps in the United States during World War II, identifying the Japanese attack on Pearl Harbor and the subsequent propaganda against Japanese Americans as causal factors);
• identify and react to basic textual arguments (e.g., observing specific reasons why she was or was not persuaded by the argument);
• identify problems with complex solutions (e.g., observing while reading about the civil rights movement that achieving racial equality has been a long and difficult process); and
• identify plots with multiple story lines (e.g., observing that although The Sisterhood of the Traveling Pants follows the stories of four very different girls, in each story the traveling pants help them resolve a difficult issue).
Grade 6 • identify complex causal relationships(e.g., observing all the ways Old Dan and Little Ann in Where the Red Fern Grows affect Billy’s family);
• identify complex chronologies (e.g., recounting the events in a book such as The Lion, the Witch, and the Wardrobe);
• identify problems that only an outside source or person can solve (e.g., observing that Helen Keller’s problem of communication could not have been solved without her teacher); and • identify plots with two parallel story lines (e.g., observing that Seabiscuit follows the life of both a man and a horse and that these story lines both represent the growth, courage, and change central to the story’s plot).
Grade 5 • identify complex causal relationships (e.g., observing that many events in Harry Potter and the Sorcerer’s Stone seem strange until the book reveals their causes);
• identify complex chronologies (e.g., observing that many of the events affecting Harry in Harry Potter and the Sorcerer’s Stone happened before the story takes place);
• identify problems that only a character can solve (e.g., observing that Malfoy will always bully Harry in Harry Potter and the Sorcerer’s Stone unless Harry stands up to him); and • identify plots with single story lines (e.g., observing that a biography or an autobiography follows the story of one person’s life and explains the important details of that person’s life).
Grade 4 • identify basic cause and effect(e.g., observing that Charlie in Charlie and the Chocolate Factory wins the contest because he behaves well while the other children behave badly); • identify simple chronologies (e.g., recalling the order and cause of each child’s exit from the story in Charlie and the Chocolate Factory);
• identify problems with simple solutions (e.g., observing that the problem of poverty within Charlie’s family in Charlie and the Chocolate Factory is only solved by having more money); and
• identify plots with single story lines (e.g., observing that the plot of Charlie and the
Unpacking Standards 17
Figure 2.1
(
continued
)
Grade 3 • identify basic cause and effect(e.g., observing that in Because of Winn-Dixie, the entrance of a dog into a young girl’s life causes many changes that help the girl grow);
• identify simple chronologies (e.g., recalling the correct order of the people Opal meets in Because of Winn-Dixie);
• identify problems with basic solutions (e.g., observing that Gloria Dump’s problem of blindness is solved by seeing with her heart in Because of Winn-Dixie); and
• identify plots with single story lines (e.g., observing that the story line of Because of Winn-Dixie follows the adventures of a young girl and her dog and that the plot involves her growth throughout the story and her coming to peace with her mother’s absence).
Grade 2 • identify basic cause and effect(e.g., observing that Amelia Bedelia does not produce the right effects at her job as a maid); and
• identify simple story lines (e.g., observing that Mike Mulligan and His Steam Shovel follows a man trying to find out what he is supposed to do).
Grade 1 • identify simple story lines(e.g., observing that the story line of Are You My Mother? follows a baby bird who is searching for his mother).
Grade K Not applicable.
begins, “while engaged in grade-appropriate reading tasks, the student
dem-onstrates an ability to . . .”. Thus the assumption is that identifying complex
causal relationships and complex plots with multiple story lines is done with
more sophistication at 8th grade than it is at 7th. These differing expectations
should be spelled out for teachers in the examples that are provided for each
covarying element as depicted in Figure 2.1.
To illustrate, the 8th grade example for identifying complex causal
rela-tionships involves students linking the plight of Anne Frank not only to the
behavior of the Nazis but also to the childhood of Adolf Hitler—a diverse
and complex set of causal factors. At 7th grade, the expectation is less. Here
students are expected to identify the Japanese attack on Pearl Harbor and the
resulting propaganda against Japanese Americans as being causally related to
Japanese internment camps during World War II—a much less subtle causal
pattern than that in the 8th grade example. Thus when bulleted items are
identical at two grade levels, the examples provided for teachers should
dem-onstrate the differing expectations regarding students’ knowledge and skill.
The remaining three elements at 7th and 8th grade in Figure 2.1 are slightly
different. At 8th grade, students are expected to identify and react to textual
arguments; at 7th grade, students are expected to identify and react to
basic
Making Standards Useful in the Classroom 18
From one grade level to another, then, the covarying dimensions within a
measurement topic become more sophisticated and more complex. Teachers
should receive specific guidance regarding how expectations differ from grade
level to grade level.
Guidelines for Designing
a System of Measurement Topics
The process for identifying measurement topics and covarying elements
within those topics is fairly straightforward. Over years of working with
districts and schools, we have identified the following general guidelines for
designing measurement topics:
• Limit the number of measurement topics to 20 or fewer per subject area,
per grade level.
• Limit the number of bulleted elements within each measurement topic.
• Include measurement topics for life skills.
• Change the structure of measurement topics at the high school level.
• Possibly allow for a “teacher’s choice” measurement topic.
Let’s consider each of these in succession.
Limiting the Number of Measurement Topics
Given that one of the main barriers to implementing standards is that they
contain too much content, it would be counterproductive to identify too many
measurement topics. We recommend no more than 20 measurement topics
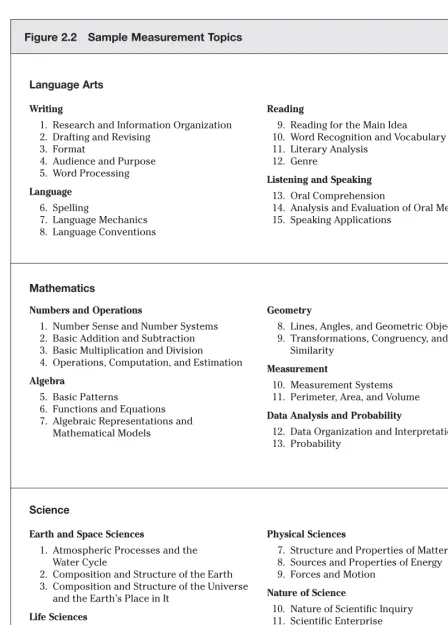
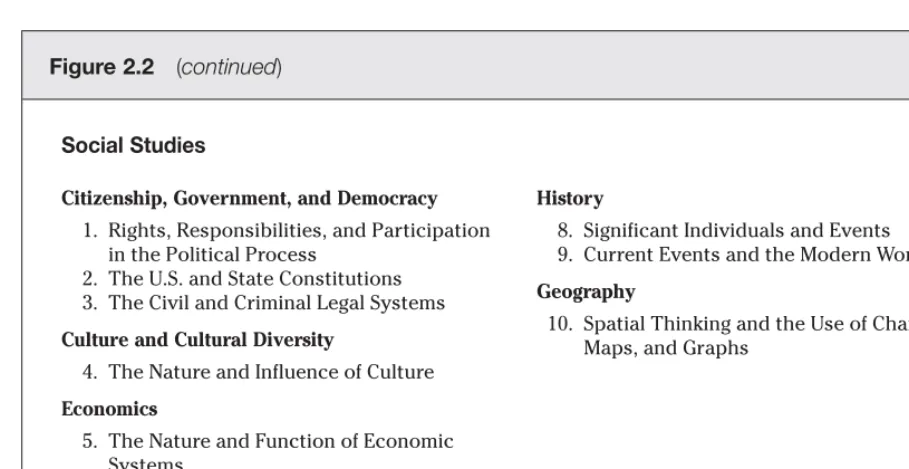
per subject, per grade level—ideally, about 15. To illustrate, Figure 2.2
pro-vides a list of sample K–8 measurement topics for language arts, mathematics,
science, and social studies found in the scoring scales in Part II of the book. It
is important to note that the list in Figure 2.2 is a sample only. Districts must
articulate their own topics to reflect the content in their state standards and
the priorities of their teachers and the community.
Notice that the list has 15 topics for language arts, 13 for mathematics,
12 for science, and 10 for social studies. Although not shown in Figure 2.2,
all measurement topics do not span all grade levels. For example, the
mea-surement topics in mathematics of basic addition and subtraction and basic
multiplication and division begin in kindergarten and end at grade 6. Also
note that the topics are grouped under categories. In language arts, the first
five measurement topics are organized under the category “Writing.” Districts
and schools use different terms to refer to these categories, such as
strands
,
themes
, and even
standards
. For reporting purposes, districts and schools
might use strands (themes or standards), measurement topics, or both.
Unpacking Standards 19
Figure 2.2 Sample Measurement Topics
Writing
1. Research and Information Organization 2. Drafting and Revising
3. Format
4. Audience and Purpose 5. Word Processing
Language
6. Spelling
7. Language Mechanics 8. Language Conventions
Reading
9. Reading for the Main Idea
10. Word Recognition and Vocabulary 11. Literary Analysis
12. Genre
Listening and Speaking
13. Oral Comprehension
14. Analysis and Evaluation of Oral Media 15. Speaking Applications
Numbers and Operations
1. Number Sense and Number Systems 2. Basic Addition and Subtraction 3. Basic Multiplication and Division
4. Operations, Computation, and Estimation
Algebra
5. Basic Patterns
6. Functions and Equations 7. Algebraic Representations and
Mathematical Models
Geometry
8. Lines, Angles, and Geometric Objects 9. Transformations, Congruency, and
Similarity
Measurement
10. Measurement Systems 11. Perimeter, Area, and Volume
Data Analysis and Probability
12. Data Organization and Interpretation 13. Probability
Earth and Space Sciences
1. Atmospheric Processes and the Water Cycle
2. Composition and Structure of the Earth 3. Composition and Structure of the Universe
and the Earth’s Place in It
Life Sciences
4. Principles of Heredity and Related Concepts
5. Structure and Function of Cells and Organisms
6. Relationships Between Organisms and Their Physical Environment
Physical Sciences
7. Structure and Properties of Matter 8. Sources and Properties of Energy 9. Forces and Motion
Nature of Science
10. Nature of Scientific Inquiry 11. Scientific Enterprise
Language Arts
Mathematics
Making Standards Useful in the Classroom 20
Figure 2.2
(
continued
)
Citizenship, Government, and Democracy
1. Rights, Responsibilities, and Participation in the Political Process
2. The U.S. and State Constitutions 3. The Civil and Criminal Legal Systems
Culture and Cultural Diversity
4. The Nature and Influence of Culture
Economics
5. The Nature and Function of Economic Systems
6. Economics Throughout the World 7. Personal Economics
History
8. Significant Individuals and Events 9. Current Events and the Modern World
Geography
10. Spatial Thinking and the Use of Charts, Maps, and Graphs
Social Studies
measurement topics Basic Addition and Subtraction and Basic
Multiplica-tion and Division might be addressed each quarter, whereas the topic Lines,
Angles, and Geometric Objects might be addressed in one quarter only. We
consider this issue in more depth in Chapter 3.
Limiting the Number of Bulleted Elements
The benefits gained by keeping the number of measurement topics small
can be undone if the number of bulleted items for each measurement topic
becomes too large.
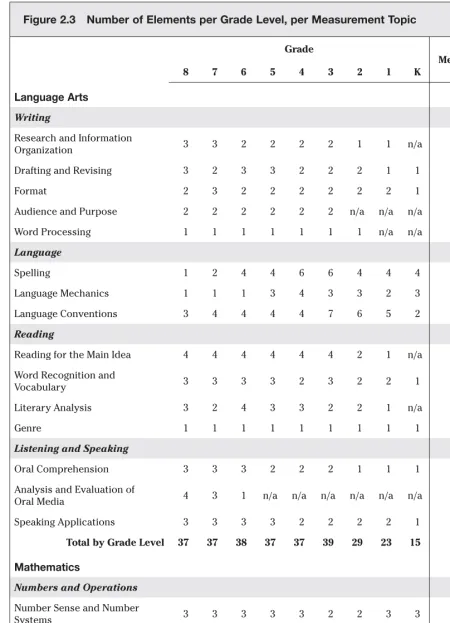
Figure 2.3 depicts the number of bulleted elements per
grade level, per measurement topic, for the sample measurement topics in the
scoring scales in Part II.
We recommend about three or four elements per grade level. Figure 2.3
indicates that this is typically the case—with notable exceptions. For example,
the language arts measurement topics of Language Conventions and Spelling
commonly have more elements, particularly at lower grades. In these cases, it
is typical for specific elements to be taught during different grading periods.
To illustrate, consider Language Conventions at 3rd grade. It has seven
ele-ments, two of which might be taught in the first quarter, two in the second
quarter, two in the third quarter, and one in the fourth quarter.
A well-articulated set of measurement topics goes a long way toward
implementing what Marzano has referred to elsewhere as “a guaranteed and
viable curriculum.” This concept is described in depth in the book
What Works
in Schools
(Marzano, 2003). Briefly, a district that has such a curriculum can
Unpacking Standards 21
guarantee to be
viable
, the district must have few enough measurement
top-ics to ensure that the process of keeping track of the toptop-ics is possible in the
time available. This is why it is necessary to limit the number of measurement
topics and the bulleted elements within each topic.
Including Measurement Topics for Life Skills
One area that has not been mentioned in the discussion thus far is “life
skills”—information and skills that are not specific to traditional academic
subject areas (such as mathematics, science, and language arts) but are
important to success in a variety of situations. The importance of these skill
areas has been affirmed by several studies and reports over the last few
decades, such as the 1991 report by the Secretary’s Commission on Achieving
Necessary Skills (SCANS) titled
What Work Requires of Schools: A SCANS Report
for America 2000
(1991),
Workplace Basics: The Essential Skills Employers Want
(Carnevale, Gainer, & Meltzer, 1990), and
First Things First: What Americans
Expect from Public Schools
(Farkas, Friedman, Boese, & Shaw, 1994), sponsored
by the polling firm Public Agenda. Additionally, in a general survey of adults
in the United States conducted by the Gallup Corporation under the direction
of McREL researchers, respondents rated life skills higher than 13 academic
subject areas (including mathematics, science, history, language arts, and
physical education) as definitely required for all students to learn before high
school graduation (Marzano, Kendall, & Cicchinelli, 1998).
Given the perceived importance of life skills and the apparently solid
man-date from the world of work to teach and reinforce them in schools, we
rec-ommend the design of measurement topics to address selected life skills. The
following are life skills topics that districts commonly identify as important:
• Participation refers to the extent to which students make an effort to be engaged in class and respond to the tasks presented to them.
• Work completion involves the extent to which students adhere to the requirements regarding the tasks assigned to them. Work completion involves students turning in assignments in a timely fashion and following the conven-tions that have been established by the teacher (e.g., format consideraconven-tions for a report).
• Behavior involves the extent to which students adhere to the rules for con-duct and behavior. This includes rules set by individual teachers and those established schoolwide.
• Working in groups addresses the extent to which students actively partici-pate in the accomplishment of group goals. It should be noted that this cate-gory does not include student behavior within a group, since that is addressed by the category of “behavior.” Rather, working in groups is focused on the extent to which students participate in the accomplishment of group goals as opposed to focusing only on their own goals. (Marzano, 2006, p. 26)
Making Standards Useful in the Classroom 22
Figure 2.3 Number of Elements per Grade Level, per Measurement Topic
Grade Total by
Measurement Topic
8 7 6 5 4 3 2 1 K
Language Arts
Writing
Research and Information
Organization 3 3 2 2 2 2 1 1 n/a 16
Drafting and Revising 3 2 3 3 2 2 2 1 1 19
Format 2 3 2 2 2 2 2 2 1 18
Audience and Purpose 2 2 2 2 2 2 n/a n/a n/a 12
Word Processing 1 1 1 1 1 1 1 n/a n/a 7
Language
Spelling 1 2 4 4 6 6 4 4 4 35
Language Mechanics 1 1 1 3 4 3 3 2 3 21
Language Conventions 3 4 4 4 4 7 6 5 2 39
Reading
Reading for the Main Idea 4 4 4 4 4 4 2 1 n/a 27
Word Recognition and
Vocabulary 3 3 3 3 2 3 2 2 1 22
Literary Analysis 3 2 4 3 3 2 2 1 n/a 20
Genre 1 1 1 1 1 1 1 1 1 9
Listening and Speaking
Oral Comprehension 3 3 3 2 2 2 1 1 1 18
Analysis and Evaluation of
Oral Media 4 3 1 n/a n/a n/a n/a n/a n/a 8
Speaking Applications 3 3 3 3 2 2 2 2 1 21
Total by Grade Level 37 37 38 37 37 39 29 23 15 292
Mathematics
Numbers and Operations
Number Sense and Number
Systems 3 3 3 3 3 2 2 3 3 25
Basic Addition and Subtraction n/a n/a 1 3 3 2 3 3 2 17
Basic Multiplication and Division n/a n/a 2 2 3 3 3 2 2 17
Operations, Computation, and
Unpacking Standards 23
Figure 2.3
(
continued
)
Grade Total by
Measurement Topic
8 7 6 5 4 3 2 1 K
Algebra
Basic Patterns n/a n/a n/a n/a 2 2 2 2 2 10
Functions and Equations 3 2 2 3 n/a n/a n/a n/a n/a 10
Algebraic Representations and Mathematical Models
4 3 2 3 3 3 n/a n/a n/a 18
Geometry
Lines, Angles, and Geometric Objects
4 3 3 3 4 2 4 3 2 28
Transformations, Congruency, and Similarity
3 3 4 2 3 3 3 3 3 27
Measurement
Measurement Systems 3 3 3 4 4 3 4 4 3 31
Perimeter, Area, and Volume 4 3 3 4 3 3 n/a n/a n/a 20
Data Analysis and Probability
Data Organization and Interpretation
2 3 2 3 3 2 3 3 1 22
Probability 4 2 2 3 3 2 2 1 1 20
Total by Grade Level 33 29 31 37 36 28 27 24 19 264
Science
Earth and Space Sciences
Atmospheric Processes and the Water Cycle
2 4 3 2 2 2 2 3 2 22
Composition and Structure of the Earth
3 2 2 2 2 2 2 1 n/a 16
Composition and Structure of the Universe and the Earth’s Place in It
4 2 1 1 2 1 1 2 1 15
Life Sciences
Principles of Heredity and Related Concepts
2 2 2 2 1 1 1 1 n/a 12
Structure and Function of Cells and Organisms
3 4 2 3 4 2 2 2 2 24
Relationships Among Organisms and Their Physical Environment
3 2 2 3 2 4 2 2 3 23
Biological Evolution and Diversity of Life
2 2 2 3 2 3 3 2 2 21
Making Standards Useful in the Classroom 24
Figure 2.3
(
continued
)
Grade Total by
Measurement Topic
8 7 6 5 4 3 2 1 K
Physical Sciences
Structure and Properties of
Matter 3 2 2 2 2 2 2 2 1 18
Sources and Properties of
Energy 3 2 3 3 4 3 3 2 2 25
Forces and Motion 3 3 4 3 2 2 2 2 2 23
Nature of Science
Nature of Scientific Inquiry 1 1 1 1 1 1 1 1 1 9
Scientific Enterprise 2 2 2 3 1 1 1 1 1 14
Total by Grade Level 31 28 26 28 25 24 22 21 17 222
Social Studies
Citizenship, Government, and Democracy
Rights, Responsibilities, and Participation in the Political Process
3 2 2 2 2 2 1 2 n/a 16
The U.S. and State Constitutions 3 3 1 n/a n/a n/a n/a n/a n/a 7
The Civil and Criminal Legal
Systems 2 4 2 2 3 4 3 3 3 26
Culture and Cultural Diversity
The Nature and Influence of
Culture 3 3 2 3 2 2 3 3 2 23
Economics
The Nature and Function of
Economic Systems 2 2 1 1 1 n/a n/a n/a n/a 7
Economics Throughout the
World 3 2 3 3 3 2 2 n/a n/a 18
Personal Economics 4 2 2 n/a n/a n/a n/a n/a n/a 8
History
Significant Individuals and
Events 2 2 3 3 2 3 1 1 n/a 17
Current Events and the Modern
World 4 4 4 4 4 4 n/a n/a n/a 24
Geography
Spatial Thinking and the Use of
Charts, Maps, and Graphs 1 2 3 2 3 1 2 2 3 19
Unpacking Standards 25
of dimensions from one grade level to the next. To illustrate, a district might
identify the following elements for the life skills topic of Participation at the
middle school level:
• offering ideas without waiting for a question to be asked (
e.g., taking
an active role in a classroom discussion by volunteering opinions for
consider-ation
);
• staying focused during whole-class activities (
e.g., attending to
whole-class activities by taking notes
); and
• staying focused during individual activities (
e.g., actively engaging in
assigned seatwork
).
Instead of listing different elements for each grade level, these might be
identi-fied as important to all middle school grade levels.
Changing the Structure of Measurement Topics for High School
The approach to measurement topics described thus far works well for
kindergarten through grade 8. That is, it makes sense to have measurement
topics that become progressively more complex in terms of the covarying
ele-ments from grade level to grade level. However, this approach does not work
well in the course structure used by most high schools. Consequently, at the
high school level, measurement topics are articulated for each course that is
offered. For example, measurement topics would be articulated for Algebra I,
Geometry, Algebra II, and so on. For example, Township High School District
211 in Palatine, Illinois, developed measurement topics for Algebra I,
Geom-etry, and Algebra II similar to those in Figure 2.4.
At the high school level, then, teachers in each department would gather
to develop measurement topics for courses within their departments, taking
heed to follow the general guidelines discussed previously (that is, not too
many measurement topics, not too many bulleted elements within a
measure-ment topic, and so on).
Allowing a Teacher’s Choice Measurement Topic
Making Standards Useful in the Classroom 26
• being objective when reporting on an incident;
• keeping the focus on the story, not the reporter; and
• validating eyewitness accounts.
It makes sense that a district or a school might want to provide enough
flex-ibility in its system of measurement topics to accommodate the individual
strengths of teachers they have hired.
Summary
Unpacking standards and designing measurement topics involves a
num-ber of steps. Benchmark statements in standards documents should be
unpacked and rewritten to combine like content. Some content statements
should be dropped because they are not easy to translate into instructional
Figure 2.4 Sample Measurement Topics
for Algebra I, Geometry, and Algebra II
Algebra I
Formulas
Polynomial operations
Solving equations and inequalities in one variable Radicals and factoring
Solving quadratic equations Solving systems of linear equations Rational expressions
Ratios, proportions, and percents
Graphing linear equations and inequalities Word problems involving algebraic equations
Geometry
Applying the concept of deductive reasoning and proof
Applying the properties of points, segments, angles, lines, and their relationships Polygon congruence and similarity
Triangle calculations: Pythagorean theorem, right triangle trigonometry Polygon and circle measures
Perimeter, area, surface area, volume Transformational geometry
Probability
Algebra II
Radicals and exponents operations Function operations
Systems of equations and matrices Equation solving
Complex number operations
Modeling with equations/data analysis Conic sections
Unpacking Standards 27
28
Once measurement topics and accompanying elements have been identified
for grade levels and courses, the next step is to state them in the format of a
scale. Some educators like to use the term
rubric
. We prefer the term
scale
for
reasons articulated in the book
Classroom Assessment and Grading That Work
(Marzano, 2006). The scale we recommend appears in Figure 3.1.
Figure 3.1 is a 0-through-4 scale with half-point scores that are set off to
the right to signify that they describe student-response patterns between the
whole-point scores. To understand the scale, it is best to begin with the score
value of 3.0.
• A score of 3.0 indicates that a student has correctly answered all items
or performed all tasks that involve simpler details and processes
as well as
all items or tasks that involve more complex ideas and processes that were
explicitly taught. In effect, the score of 3.0 is the fulcrum of the scale. It
repre-sents the instructional goal for a measurement topic.
• A score of 2.0 indicates that a student has correctly answered all items
or performed all tasks that involve simpler details and processes but has
missed all items or tasks that involve more complex ideas and processes
(score 3.0 items and tasks).
• If a student has correctly answered all items or performed all tasks
regarding simpler details and processes (score 2.0 items and tasks) and has
correctly answered
some
items or performed
some
tasks involving more
com-plex ideas and processes (score 3.0 items and tasks) or has received
partial
credit
on those items or tasks, a score of 2.5 is assigned.
• A score of 1.5 is assigned if a student receives partial credit on the score
2.0 items or tasks but misses all other types of items.
• A score of 1.0 is assigned if a student misses all items or tasks but with
help from the teacher demonstrates partial credit on the score 2.0 and score
3.0 items or tasks.
3
A Scale Format for Measurement Topics 29
• A score of 0.5 is assigned if the student misses all items or tasks but with
help demonstrates partial credit on the score 2.0 items or tasks but not on the
score 3.0 items or tasks.
• A score of 0.0 indicates that, even with help, the student cannot answer
any items or perform any tasks correctly.
• At the top end of the scale, a score of 4.0 indicates a student has
answered all items or performed all tasks correctly (score 4.0 items or tasks,
score 3.0 items or tasks, and score 2.0 items or tasks).
• A score of 3.5 is assigned if a student correctly answers or performs
score 2.0 and score 3.0 items or tasks and receives partial credit on score 4.0
items or tasks.
Of course, the success of the scale in Figure 3.1 rests on the ability of the
teacher to design items for scores 4.0, 3.0, and 2.0. To facilitate this, all
mea-surement topics at each grade level and in each course should be written
in scale form. To illustrate, consider Figure 3.2. This scale provides specific
Figure 3.1 Scale for Measurement Topics
Score 4.0: In addition to score 3.0 performance, in-depth inferences and applications that go beyond what was taught.
Score 3.5: In addition to score 3.0 performance, partial success at inferences and applications that go beyond what was taught.
Score 3.0: No major errors or omissions regarding any of the information and/or processes (simple or complex) that were explicitly taught.
Score 2.5: No major errors or omissions regarding the simpler details and processes and partial knowledge of the more complex ideas and processes.
Score 2.0: No major errors or omissions regarding the simpler details and processes but major errors or omissions regarding the more complex ideas and processes.
Score 1.5: Partial knowledge of the simpler details and processes but major errors or omissions regarding the more complex ideas and processes.
Score 1.0: With help, a partial understanding of some of the simpler details and processes and some of the more complex ideas and processes.
Score 0.5: With help, a partial understanding of some of the simpler details and processes but not the more complex ideas and processes.
Score 0.0: Even with help, no understanding or skill demonstrated.
Making Standards Useful in the Classroom 30
guidance to teachers as to expectations at 3rd grade for the measurement
topic Number Sense and Number Systems. The sample measurement topics
in the scoring scales in Part II are all in the format depicted in Figure 3.2. To
exemplify the score values in the scale, we begin again with the score 3.0
ele-ments because they are the fulcrum of the scale.
It is important to note that score 3.0 elements all begin with a stem. In
Figure 3.2 the stem is, “While engaged in grade-appropriate tasks, the student
demonstrates an understanding of numbers and number systems by . . .”. This
stem provides a context in which the bulleted information or skill is to be
demonstrated. Score 3.0 bullets are the covarying elements that are identified
as a result of unpacking and reconstituting state standards documents (as
Figure 3.2 Scale for 3rd Grade Measurement Topic:
Number Sense and Number Systems
Score 4.0 In addition to score 3.0 performance, the student demonstrates in-depth inferences and applications that go beyond what was taught.
Score 3.5 In addition to score 3.0 performance, the student demonstrates in-depth inferences and applications with partial success.
Score 3.0 While engaged in grade-appropriate tasks, the student demonstrates an understanding of numbers and number systems by . . .
• using mathematical language and symbols to compare and order whole numbers (up to 9,999), decimals (hundredths), and commonly used fractions and mixed numbers (e.g., explaining and exemplifying the difference between < and ≤); and
• generating equivalent forms of whole numbers (e.g., explaining and exemplifying how different forms of a whole number are the same).
The student exhibits no major errors or omissions.
Score 2.5 The student exhibits no major errors or omissions regarding the score 2.0 elements and partial knowledge of the score 3.0 elements.
Score 2.0 The student exhibits no major errors or omissions regarding the simpler details and processes, such as . . .
• recognizing and recalling specifi c terminology (e.g., less than, greater than, mixed number); and
• recognizing and recalling the accuracy of basic solutions and information, such as . . . < is a symbol that means “less than”; > is a symbol that means “greater than”; and 15 + 10 is the same as 25.
However, the student exhibits major errors or omissions with score 3.0 elements.
Score 1.5 The student demonstrates partial knowledge of the score 2.0 elements but major errors or omissions regarding the score 3.0 elements.
Score 1.0 With help, the student demonstrates partial understanding of some of the score 2.0