The Perceived Image of TransJakarta Bus Rapid Transit
Andri Warman STMT Trisakti
Muhammad Iqbal Firdaus STMT Trisakti
[email protected] [email protected]
Aisyah Rahmawati STMT Trisakti
ABSTRACT
Public transport services provided by Bus Rapid Transit TransJakarta has been launched by the local government of DKI Jakarta as a mass and rapid transport mode that can attract the users of personal vehicle to use this mode of transport. Although the passengers are increasing, but the condition has not reached the optimum level yet. This study is done as an attempt to map the image perceived by the users, either frequent users, occasional users, or non-frequent users. The image projected by the users will depend on the experience degree and information each individual has. The method used here is descriptive analysis and reduction factor to obtain the dimensions of image in the respondents’ mind toward TransJakarta bus. The result shows ive dimensions that construct the image, namely affective dimension (Eigenvalue = 5,488, or 26% of all variances), dimension of vehicle aspects (Eigenvalue = 1,794, or 8.5% of all variances), dimension of service characteristic (Eigenvalue = 1,635, or 7.8% of all variances), dimension of impact on the trip (Eigenvalue = 1,348, or 6.4% of all variances), and dimension of impact on the user/other people (Eigenvalue = 1,088, or 5.1% of all variances).
Introduction with all infrastructures available and well-organized, and its cost of implementation is lower than the other modes (Currie, 2005). In some developing countries, this program also give positive impacts. In Beijing, passengers as shown by the high level of user satisfaction (Adebambo, 2009). Even in Johannnesburg, BRT is one of the South Africa government’s program to decrease poverty through passenger mobilization from one place to another rapidly and massively (Vaz & Venter, 2012).
The transport mode of BRT can be considered as the bridge between the conventional bus system and transit train (Cain, Flynn, McCourt, and Reyes, 2009). This system runs on the road and uses the infrastructure of road with relatively low cost, such as priority trafic light, marked crossroad, scheduled headway, halts in special places so as to give advantahes of speed and reliability if compared with the conventional bus system.
In order to increase the level of public transport use, today there are 13 corridors in all parts of Jakarta city that serve passengers from the inner city of Jakarta and the surrounding cities (Bekasi, Bogor, Tangerang) through an integration with feeder bus from those cities to the bus halts of TransJakarta. The efforts to expand the network and add the bus leet are positive ones by the local government, in order to attract more passengers and move the users of private vehicle to public transport.
The image of BRT have an important
role as one of the determining factors in the movement of private vehicle users to public transport service. Scherer (2011) identiies that the perception, image, and trust to modes of transport are much varied, depending on the experience and location. Therefore, the users are classiied based on their level of using a transport service that can be classiied into three groups; TransJakarta, especially in corridor IX Pinang Ranti–Pluit and understanding and quantifying the tangible and intangible factors that propel the possibility of difference in the users’ perception.
Public Transport and Its Image
someone to use public transport.
The high use of public transport provides signiicant beneits to a country. According to Texas Transportation Institute (2004), the beneits that can be taken from using public transport by people are the reduced trafic density, cost eficiency, and the availability of more sustainable work opportunities.
Here, there are several things determining that image has an important role in attracting people to take advantage of BRT services. In another word, someone’s desire to take advantage of BRT services is much determined by the quality. Using BRT services, at least the quality of riding will be similar when they use their own vehicle (Evans and Pratt, 2003). In addition, the image of less reliable is perceived by those who do not take advantage of BRT services, whereas those in the category of user consider that the reliability of BRT has been satisfying (Cain and Flynn, 2009). The image of travel time is also perceived signiicantly enough by the users of private
cars. They consider the travel time is much longer than using private vehicle, whereas those taking advantage of BRT services consider the travel time of BRT has been satisfying since travel time is closely related to the existing schedule and its punctuality (van Exel and Rietveld, 2010). In another word, experience is closely related to the image construction. In his study about BRT and tram, Scherer (2011) states that the more frequently someone takes advantage of the services from both modes of transport the bigger difference of image will appear. Whereas if he or she never or rarely takes advantage of them, only few difference of service image will be in his or her perception.
Image is a concept relected through someone’s attitude toward a concept and measured by two methods that are commonly used, namely schematic method and semantic differential method. In this research, semantic differential method will be used to measure the attitude or faith in BRT TransJakarta based on the attributes used for that public transport service.
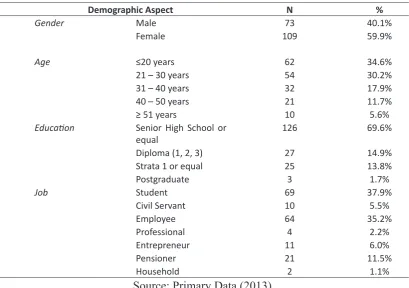
Demographic Aspect N %
Gender Male 73 40.1%
Female 109 59.9%
Age ≤20 years 62 34.6%
21 – 30 years 54 30.2%
31 – 40 years 32 17.9%
40 – 50 years 21 11.7%
≥ 51 years 10 5.6%
Educaion Senior High School or equal
126 69.6%
Diploma (1, 2, 3) 27 14.9%
Strata 1 or equal 25 13.8%
Postgraduate 3 1.7%
Job Student 69 37.9%
Civil Servant 10 5.5%
Employee 64 35.2%
Professional 4 2.2%
Entrepreneur 11 6.0%
Pensioner 21 11.5%
Household 2 1.1%
Source: Primary Data (2013)
The use of 5-level rating of Likert-Scale will also be analyzed in processing the data from the respondents who are asked to decide their position against an attribute or concept. Furthermore, this research will also use the attributes of public transport adapted from Scherer (2011) in the bipolar scale, and the research is carried out in
the period of July to November 2013 taking place in West Jakarta, exactly in the TransJakarta bus halt of Slipi Palmerah and the nearby.
Result and Discussion
The Level of Using TransJakarta
Figure 2. Travel Time from the Nearest Shelter to Ofice/Campus/School and Other Destinations
Source: Primary data (2013)
Service in Corridor IX
The result of research shows that the percentage comparison between frequent users and non frequent users is not far, that is 20.4% frequent users compared with 28.2% non frequent users. Furthermore, 51% of all respondents state that they are occasional users with non-routine use of TransJakarta services. This shows that 79% of all respondents in this research are not routine or regular users of TransJakarta service in corridor IX as seen in Figure 1.
By differentiating the types of BRT TransJakarta service users it is expected to get a more objective perspective of the TransJakarta bus users’ perception, especially in corridor IX because the perceived image will be much inluenced by the factors of information and experience which dominantly construct the conceptual framework of an object.
Travel time of the Nearest TransJakarta Shelter from Ofice/Campus/ School/other Destinations
Among the respondents involved in this research as many as 50% (55
respondents) answer: the location of shelters from the workplace/campus/ school and other destinations are in the same distance, less than 15 minutes walk. This shows that the shelters are possibly in the right position or in the comfortable distance for the users when they want to take on the bus or when they go to ofice or get back from ofice after taking advantage of TransJakarta. While about 34% (37 respondents) answer: they have to walk 15 to 30 minutes to reach the destination after getting out of the bus halt. The others, almost 15% (16 respondents) state that the halts of TransJakarta are relatively far from their ofice/campus/school.
Comparison among Travel Times of the Nearest Shelter for TransJakarta Corridor IX Users
One of the main factors that will naturally be taken into account by the users of BRT transport service provided by TransJakarta in corridor IX the easy access to the nearest halt regarding TransJakarta halts are only in certain points. Based on the visual observation, there are passengers who stop in the halt and immediately take Figure 3. Types of Users and the Nearest Distance Shelter
mikrolet (a kind of public transport) or ojek
(a motorcycle used for public transport) to get the inal destination. It means that the distance from the nearest halt to their ofice/ campus/school is only several minutes. If the distance takes more than 30 minutes, then it will not be eficient so that they tend not to routinely use this transport, never use it, or even choose other alternatives.
In the group of frequent user respondents, the nearest shelter is maximum 15 minutes walk, dominated by 67% (15 respondents) while the nearest for other 6 respondents is 15 to 30 minutes and only a few with the distance more than 30 minutes walk. In the second group of respondents, occasional user, for more than half of them, the nearest shelter is 15 minutes walk or less, whereas those with the distance 15 to 30 minutes are about 35%, and the remaining respondents with the distance of more than 30 minutes walk. In the third group of respondents, non frequent user, the nearest shelter is dominantly 15 to 30 minutes walk. This is one of the factors why this group infrequently take advantage of TransJakarta services. Meanwhwile, for the distance more than 15 minutes walk, the group of non frequent users dominates compared with the other groups of users. Therefore, it can be tentatively concluded that the distance of shelter is one of the factors inluencing why they infrequently use TransJakarta corridor IX services.
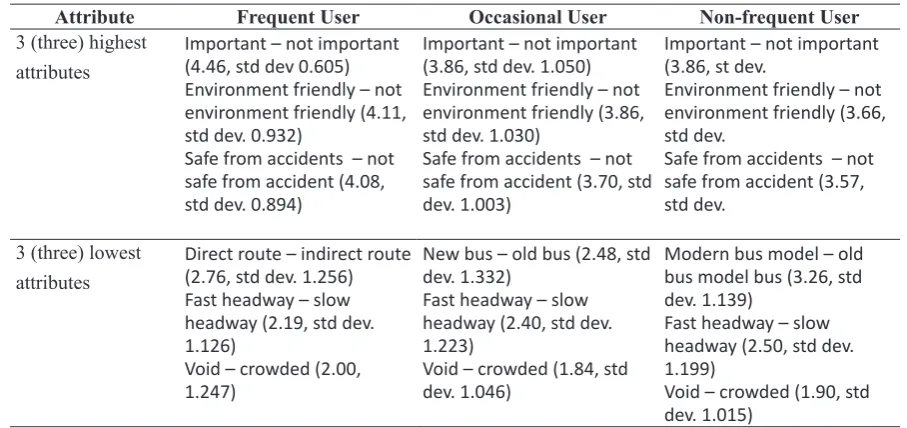
Attribute Assessment
Frequent user gives the highest average score for important attribute as 4.46 (close to ive). This score means that the existence of TransJakarta bus service, especially in Corridor IX, is much needed by those routinely using this kind of public transport. Subsequently, the consecutive attributes are environment friendly and safe from accidents with the score respectively 4.11 and 4.08. The attributes negatively perceived by frequent users are the density
of the bus, long headway and the route attribute of speed in using TransJakarta, the respondents perceive not positive. In fact, the observation shows that the headway is much dependent on the trafic condition at that time, especially the factors of weather and rain. One observation shows, when it is raining the interval of inter-arrival reaches more than 30 minutes, meaning that the reality is so far from the headway standard of TransJakarta services, which is 5 minutes.
The group of non frequent users also gives high scores to the same attribute with what is giben by the group of frequent users, i.e. the attributes of interests, environment friendliness and safe from accidents with respective score 3.68, 3.66, and 3.57. Although it give the same order of attributes, but the group of non frequent users tend to give lower score than the group of frequent user (3.68 compared with 4.46; 3.66 compared with 4.11; and 3.57 compared with 4.08). Furthermore, this research also explains the consistency of the attribute that is always low score by all groups of TransJakarta transport users, expecially in corridor IX, including non frequent user, i.e. the crowded bus and the long headway. Non frequent users also give score which is almost as low as the score from the group of occasional users, 1.90. However, for the long headway, the
group of non frequent users give score 2.50, still higher than the score given by the respondents of frequent users (2.19). This research also identiies the sameness between the respondents of non frequent users with the occasional users concerning the attribute that they give low score, i.e. the physical attribute of the bus. Here the non frequent users as well as the occasional users give low score to the aspect of bus modernity. Of course, it is different from the group of frequent users who do not give low score to this aspect.
Semantic assessment on the attribute is also done by making two conlicting poles, positive and negative, using the range of score from 5 (positive) to 1 (negative). The implication is that the higher score an attribute gets the more positive it will be.
In total, from the scale of value 5 =
Attribute Frequent User Occasional User Non-frequent User
3 (three) highest attributes
Important – not important (4.46, std dev 0.605) Environment friendly – not environment friendly (4.11, std dev. 0.932)
Safe from accidents – not safe from accident (4.08, std dev. 0.894)
Important – not important (3.86, std dev. 1.050) Environment friendly – not environment friendly (3.86, std dev. 1.030)
Safe from accidents – not safe from accident (3.70, std dev. 1.003)
Important – not important (3.86, st dev.
Environment friendly – not environment friendly (3.66, std dev.
Safe from accidents – not safe from accident (3.57, std dev.
3 (three) lowest attributes
Direct route – indirect route (2.76, std dev. 1.256) Fast headway – slow headway (2.19, std dev. 1.126)
Void – crowded (2.00, 1.247)
New bus – old bus (2.48, std dev. 1.332)
Fast headway – slow headway (2.40, std dev. 1.223)
Fast headway – slow headway (2.50, std dev. 1.199)
Void – crowded (1.90, std dev. 1.015)
Source: Primary data (2013)
Table 3. Attributes with the Highest and Lowest Image
Type of User Mean Std Deviaion N Sig
Frequent user 3.39 0.46 37 0.000
Occasional user 3.26 0.60 93 0.000
Non frequent user 3.18 0.58 50 0.000
Table 4. Means for Each Type of User
very positive to 1 = very negative, it has found the calculataion for the group of frequent user respondents, i.e. Mean = 3.39 with standard deviation 0.46. For the group of occasional user respondents, the mean value is 3.26 and standard deviation 0.60. For the last group of respondents, the value of mean obtained is 3.18 and standard deviation 0.58.
Seeing Table 4.1, it can be described that frequent users have a more positive opinion than the occasional users, while
non frequent users have the lowest value of mean among all groups of user. Thus, globally the image of TransJakarta bus is that frequent users > occasional users > non frequent users.
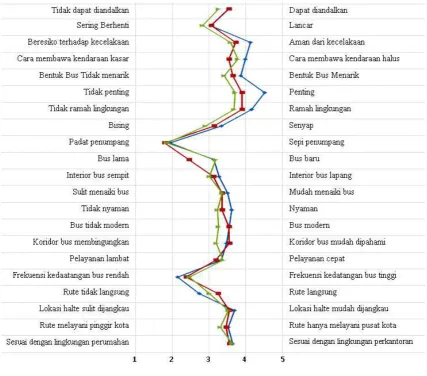
The Perceived Image of TransJakarta Bus
By using ive attributal dimensions of perceived image on public transport proposed by Schecter (2011), the
--- frequent user --- occasional user --- non frequent user
attributal dimensions that are different from transportation service provided by TransJakarta are affective dimension, dimension of vehicle aspects, dimension of service characteristics, dimension of the impact on the other user, and dimension of the impact on the trip itself. However, in Figure 4 we can see how the perceived image of TransJakarta bus service, especially in corridor IX, is based on each type of user, namely frequent users,
occasional users and non frequent users. Globally, the image that appears is the sameness of image pattern from all groups of respondents. In addition, according to the respodents, only several attributes that have low score. In Accordingly, in total, there are more dimensions and attributes assessed in this research are in the range of 3 to 4. It indicates the sameness of perceived image in almost all attributal dimensions of TransJakarta bus.
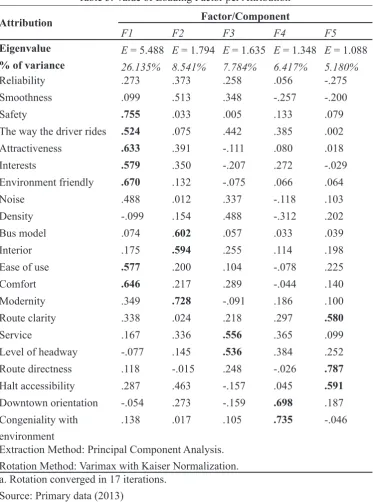
Table 5. Value of Loading Factor per Attribution
Attribution Factor/Component
F1 F2 F3 F4 F5
Eigenvalue E = 5.488 E = 1.794 E = 1.635 E = 1.348 E = 1.088
% of variance 26.135% 8.541% 7.784% 6.417% 5.180%
Reliability .273 .373 .258 .056 -.275
Smoothness .099 .513 .348 -.257 -.200
Safety .755 .033 .005 .133 .079
The way the driver rides .524 .075 .442 .385 .002
Attractiveness .633 .391 -.111 .080 .018
Interests .579 .350 -.207 .272 -.029
Environment friendly .670 .132 -.075 .066 .064
Noise .488 .012 .337 -.118 .103
Density -.099 .154 .488 -.312 .202
Bus model .074 .602 .057 .033 .039
Interior .175 .594 .255 .114 .198
Ease of use .577 .200 .104 -.078 .225
Comfort .646 .217 .289 -.044 .140
Modernity .349 .728 -.091 .186 .100
Route clarity .338 .024 .218 .297 .580
Service .167 .336 .556 .365 .099
Level of headway -.077 .145 .536 .384 .252
Route directness .118 -.015 .248 -.026 .787
Halt accessibility .287 .463 -.157 .045 .591
Downtown orientation -.054 .273 -.159 .698 .187
Congeniality with environment
.138 .017 .105 .735 -.046
Extraction Method: Principal Component Analysis. Rotation Method: Varimax with Kaiser Normalization. a. Rotation converged in 17 iterations.
In order to obtain the latent dimension of TransJakarta bus service, especially in corridor IX based on the attribution rated by respodents, factor analysis is carried out to simplify the so-complex dimensions and variables into a few sets of dimensions considered as representing all the attributes assessed. This method is useful for seeing how the rating given by respondents can be simpliied and grouped based on the their closeness in grouping the image.
The dimensions taken are the factors with Eigenvalues more than one. It is obtained by doing a rotation using Varimax method. The result of rotation will reduce the attributes into a few factors accompanied with loading factor that will determine in which dimension they will be grouped.
The irst factor constructed has the higher loading value for safety and then followed by congeniality with environment. The irst element shows that safety consistently becomes a priority, and what is beyond prediction is how ecology friendly can become the second ranked factor. In another word, the awareness sof the management in delivering BRT TransJakarta bus service in Corridor IX, really inluences the users’ perception. This is in line with the reality that almost all the bus leet of TransJakarta use gas as the more-eficient and environment-friendly fuel. The next attribute given high score for affective dimension is comfort. In the next positions are respectively attractiveness, interests, and ease of use. This affective image dimension contributes more than 26% of the image constructed for TransJakarta bus, especially in corridor IX.
The second image dimension constructed is the vehicle aspect of TransJakarta bus. The attribute that has the highest score for loading is the aspect of bus modernity with 7.28. Subsequently, it is followed respectively by interior
design and the model of TransJakarta bus. This dimension contributes 8.5% of the image constructed. TransJakarta service in corridor IX, according to visual observation, operates the buses that can be considered new and consists of two types, namely single bus and articulated bus. This regards that Corridor IX is the longest route: from Pinang Ranti to Pluit (approximately more than 30 km). In addition, corridor IX also serves the fringe area in Pinang Ranti, Gatot Subroto street with ofices along it, shopping area in Grogol and Pluit, as well as residential areas of Pluit and Pantai Indah Kapuk.
Although it has the score loading relatively lower than other attributes, the third constructed dimension of image is the attribute that has the aspects of service and headway level. It shows this dimension is still lower than the other dimensions. Although the respondents consider it important, headway has a relatively low Mean if faces the reality as they give response in the questionnaire. Furthermore, the attribute of service is also low in this dimension, meaning that generally the attribute of service has not become a dominant dimension in building the perceived image of TransJakarta corridor IX. This dimension contributes 7.8% of all the image constructed.
The last dimension of image contributing 5.1% of the total image is the impact on the user or other people with all attributes in it; the highest has factorloading 0.787 of all attributes, i.e. the route directnessprovided, followed by the halt accessibility and the route clarity with loading respectively 0.591 and 0.580.
In general, from the ive dimensions constructed based on the group of factor obtained from the rotation, it can be stated that the perceived image owned by the users of BRT TransJakarta transport service especially in corridor IX, is an image that consists of various dimensions having different weights. The affective aspect gives the highest contribution to what makes the users describe the concept constructed in their mind, and the dimension of the impact on the user or other people is ranked the last (lowest) in the image construction of BRT TransJakarta transport service.
Conclusion
In general there are different images projected by the user groups of TransJakarta transport service; namely from frequent user, occasional user and non frequent user respondents.
The groups of frequent users and occasional users have a similarity in terms of important dimension, namely the aspect of functionality as seen from the attribute with low score for the perception they have, i.e. interests. Whereas for the group of non frequent users, they tend to give low score for the physical aspect of the bus.
There are also 5 (ive) dimensions of image projected by various groups of BRT TransJakarta transport service users: affective dimension, vehicle aspect dimension, service characteristic dimension, dimension of the impact on the trip/ride, and dimension of the impact on the users and other people which respectively relects the rank of elements that dominate
the image projection.
Affective-emotional aspect is the dimension of image that contribute the most to the respondents’ image projection in this research, whereas the dimension of the impact on the users and other people becomes the least dimension that contributes to this image construction.
References
2004. Texas Transportation Institute (TTI) Annual Urban Mobility Report. Accessed on 26 September 2013 from http://mobility.tamu.edu/ums/ Adebambo, S. 2009. Impact of Bus
Rapid Transit System (BRT) on Passengers’ Satisfaction in Lagos Metropolis, Nigeria. International Journal of Creativity and Technical Development. 1 (1 – 3), 106 – 122. Accessed on 25 June 2013 from www. icidr.org/doc/.../impact%20of%20 bus%20rapid%20transit.pdf.
Cain, A dan Flynn, J. 2009. Quantifying the Importance of Image and Perception to Bus Rapid Transit. Report No: FTA-FL-26-7109.2009.3. Washington DC.
Currie, G. 2005. The Demand Performance of Bus Rapid Transit. Journal of Public Transportation. 8 (1): 41 – 55.
Report 95: Traveler Response to Transportation System Changes. Transportation Research Board of the National Academies, Washington, D.C.
Lai, W. T dan Chen, C. F. 2010. Behavioral Intentions of Public Transit Passenger – the Role of Service Quality, Perceived Value, Satisfaction and Involvement. Transport Policy. 18: 318 – 325.
Mahmoud, M., Hine, J., dan Kashyap, A. 2011. Bus Transit Service Quality Monitoring in UK: A Methodological Framework. Paper presented in ITRN 2011. Univerisity College Cork, 31 August – 1 September 2011. Accessed on 27 June 2013 from http://www. itrn.ie/uploads/sesD2_ID75.pdf.
Scherer, M. 2011. The Image of Bus and Tram: First Results. Paper presented in the11th Swiss Transport Research
Conference. Ascona, 11 – 13 May 2011. Accessed on 26 June 2013 from http://ccsenet.org/journal/index.php/ ijms/article/download/9270/6835 van Exel, N. J. A dan Rietveld, P. 2010.
Perceptions of Public Transport Travel Time and Their Effect on Choice-Sets among Car Drivers. Journal of Transport and Land Use. 2 (3/4): 75–86.
Vaz, C dan Venter, C. 2012. The Effectiveness of Bus Rapid Transit (BRT) as Part of a Poverty Reduction Strategy: Some Early Impacts in Johannnesburg. Paper presented in the 31st Southern African Transport Conference (SATC 2012). Pretoria, South Afrika 9 – 12 July 2012. Accessed on 25 June 2012 from http://repository.up.ac.za/