A NOVEL APPROACH TO STUTTERED SPEECH CORRECTION
Alim Sabur Ajibola, Nahrul Khair bin Alang Md. Rashid, Wahju Sediono, and Nik Nur Wahidah Nik Hashim
Mechatronics Engineering Department, International Islamic University Malaysia, Jalan Gombak, Kuala Lumpur, 53100, Malaysia
E-mail: [email protected], [email protected] Abstract
Stuttered speech is a dysfluency rich speech, more prevalent in males than females. It has been associated with insufficient air pressure or poor articulation, even though the root causes are more complex. The primary features include prolonged speech and repetitive speech, while some of its secondary features include, anxiety, fear, and shame. This study used LPC analysis and synthesis algorithms to reconstruct the stuttered speech. The results were evaluated using cepstral distance, Itakura-Saito distance, mean square error, and likelihood ratio. These measures implied perfect speech reconstruction quality. ASR was used for further testing, and the results showed that all the reconstru-cted speech samples were perfectly recognized while only three samples of the original speech were perfectly recognized.
Keywords: stuttered speech, speech reconstruction, LPC analysis, LPC synthesis, objective quality measure
Abstrak
Shuttered speech adalah speech yang kaya dysfluency, lebih banyak terjadi pada laki-laki daripada perempuan. Ini terkait dengan tekanan udara yang tidak cukup atau artikulasi yang buruk, meskipun akar penyebabnya lebih kompleks. Fitur utama termasuk speech yang berkepanjangan dan berulang-ulang, sementara beberapa fitur sekunder meliputi, kecemasan, ketakutan, dan rasa malu. Penelitian ini menggunakan LPC analysis dan synthesis algoritma untuk merekonstruksi stuttered speech. Hasil dievaluasi menggunakan jarak cepstral, jarak Itakura-Saito, mean square error, dan rasio likelihood. Langkah-langkah ini terkandung kualitas speech reconstruction yang sempurna. ASR digunakan untuk pengujian lebih lanjut, dan hasilnya menunjukkan bahwa semua sampel speech yang terekonstruksi dikenali dengan sempurna sementara hanya tiga sampel dari speech asli dikenali dengan sempurna.
Kata Kunci: stuttered speech, speech reconstruction, LPC analysis, LPC synthesis, objective quality measure
1. Introduction
The aim of this study is to develop a novel appro-ach for stuttered speech correction using speech reconstruction. Human beings express their feel-ings, opinions, views and notions orally through speech. Speech includes articulation, voice, and fluency [1,2]. It is a complex naturally acquired human motor skills, an action characterized in normal grownups by the production of about 14 different sounds per second via the coordinated actions of about 100 muscles connected by spinal and cranial nerves. The ease with which human beings speak is in contrast to the complexity of the act, and that complexity may help explain why speech can be exquisitely sensitive to the nervous system associated diseases [3]. Nearly 2% and 5% of adults and children stutter respectively [4,5].
Stuttering can also be defined as a disruption
in the normal flow of speech unintentionally by dysfluencies, which include repetitive pronuncia-tion, prolonged pronunciapronuncia-tion, blocked or stalled pronunciation at the phoneme or the syllable le-vel [6-8]. Stuttering cannot be permanently cured, however, it may go into remission after some ti-me, or stutterers can learn to shape their speech into fluent speech with the appropriate speech pa-thology treatment. This shaping has its effects on the tempo, loudness, effort, or duration of their utterances [7,9].
analysis of dysfluencies are in very short intervals, which is sufficient for recognition of simple repe-titions of phonemes [12].
In order to achieve the reconstruction, the linear prediction coefficient (LPC) was used. It was used because its algorithm models the human speech production. The reconstructed speech was then evaluated using objective speech quality measures such as cepstral distance (CD), mean square error (MSE), Itakura-Saito distance (IS) and likelihood ratio (LR). Automatic speaker re-cognition (ASR) system was developed to further evaluate and compare between the original speech and the reconstructed speech.
2. Methods
The methodologies used for the actualization of this research are described in this section. The LPC analysis and synthesis, the line spectral fre-quency (LSF) for feature extraction and the mul-tilayer perceptron (MLP) as classifier are expla-ined.
LPC Speech Reconstruction
Linear predictive coding (LPC) is most widely used for medium or low bit-rate speech coders [13]. From each frame of the speech samples, the reflection coefficients are computed. Because important information about the vocal tract mo-del is extracted in the form of reflection coeffi-cients, the output of the LPC analysis filter using reflection coefficients will have less redundancy than the original speech. Thus, less number of bits is required to quantize the residual error. This quantized residual error along with the quantized reflection coefficients are transmitted or stored. The output of the filter, termed the residual error signal, has less redundancy than original speech signal and can be quantized by a smaller number of bits than the original speech. The speech is reconstructed by passing the residual error sig-nal through the synthesis filter. If both the linear prediction coefficients and the residual error se-quence are available, the speech signal can be reconstructed using the synthesis filter.
Speech Analysis Filter
Linear Predictive Coding is the most efficient fo-rm of coding technique [14, 15] and it is used in different speech processing applications for repre-senting the envelope of the short-term power and the reduced variance is given by the equation-(2).
By applying the Z-transform to the equation which gives rise to the equation(3).
𝐸𝐸(𝑧𝑧) =𝐴𝐴𝑝𝑝(𝑧𝑧).𝑆𝑆(𝑧𝑧) (3)
where 𝑆𝑆(𝑧𝑧)) and 𝐸𝐸(𝑧𝑧) are the transforms of the speech signal and the residual signal respectively, and 𝐴𝐴𝑝𝑝(𝑧𝑧) is the LPC analysis filter of order ′𝑝𝑝′ as
The short-term correlation of the input speech signal is removed by giving an output 𝐸𝐸(𝑧𝑧) with more or less flat spectrum. After implementation of analysis filter, the quantization techniques are implemented and the speech signal is to be brou-ght from the quantized signal at the receiver and so the quantized signal is to be synthesized to get the speech signal.
Speech Synthesis Filter
The short-term power spectral envelope of the speech signal can be modelled by the all-pole syn-thesis filter as given by equation(5) [16]:
𝐻𝐻𝑝𝑝(𝑧𝑧) =
1 𝐴𝐴𝑝𝑝(𝑧𝑧)=
1
1− ∑𝑝𝑝𝑘𝑘=1𝑎𝑎𝑝𝑝(𝑘𝑘) 𝑧𝑧−𝑘𝑘 (5)
The equation(5) is the basis for the LPC ana-lysis model. On the other hand, the LPC synthesis model consists of an excitation source 𝐸𝐸(𝑧𝑧), whi-ch provides input to the spectral shaping filter 𝐻𝐻𝑝𝑝
In order to identify the sound whether it is voiced or unvoiced, the LPC analysis of each fra-me can act as a decision-making process. The im-pulse train is used to represent voiced signal, wi-th non-zero taps occurring for every pitch peri-od. To determine the correct pitch period/freque-ncy, a pitch-detecting algorithm is used. The pitch period can be estimated using autocorrelation fu-nction. However, if the frame is unvoiced, then the white noise is used to represent it and a pitch peri-od of T=0 is transmitted [14-15].
Therefore, either white noise or impulse train becomes the excitation of the LPC synthesis filter. Hence, it is important to emphasize on the pitch, impulses or a white noise sequence and the output is a digital speech signal [14-15].
Feature Extraction
In general, most speech feature extraction methods fall into the following two categories: modelling the human voice production system or modelling of the peripheral auditory system [17]. Feature extraction consists of computing representations of the speech signal that are robust to acoustic variation but sensitive to linguistic con-tent [18]. It is executed by converting the speech waveform to some type of parametric representation for fur-ther analysis and processing. This representation is effective, suitable and discriminative than the original signal [19]. The feature extraction plays a very important role in speech identification. As a result of irregularities in human speech features, human speech can be sensibly interpreted using frequency-time interpretations such as a spectro-gram [20].
Line Spectral Frequency (LSF)
Line Spectral Frequency (LSF) exhibits ordering and distortion independence properties. The-se properties enable the representation of the high frequencies associated with less energy using few-er bits [21]. LSF’s are an altfew-ernative to the di-rect form predictor coefficients or the lattice form reflection coefficients for representing the filter response. The direct form coefficient representa-tion of the LPC filters is not conducive to an effi-cient quantization. Instead, nonlinear functions of
ectral frequency (LSF) representation of the pre-dictor is particularly well suited for quantization and interpolation. Theoretically, this can be moti-vated by the fact that the sensitivity matrix relating the LSF-domain squared quantization error to the perceptually relevant log spectrum is diagonal [23]. Classification
In order to classify and recognize the eight speak-ers, an MLP (multilayer perceptron) type of neural network was used. Since neural networks are very good at mapping inputs to target outputs, this fea-ture was used to the advantage of this study. The MLP was used to map the input to the output and it is described below.
Multilayer Perceptron (MLP)
Multilayer perceptron (MLP) is one of many di-fferent types of existing neural networks. It com-prises a number of neurons connected together to form a network. This network has three layers which are input layer, one or more hidden lay-er(s) and an output layer with each layer contain-ing multiple neurons [24]. A neural network is able to classify the different aspects of the behave-ours, knows what is going on at the instant, diag-noses whether it is correct or faulty, forecasts wh-at it will do next, and if required responds to whwh-at hidden-layer neurons and the output neurons, res-pectively; 𝑤𝑤𝑖𝑖𝑗𝑗and 𝑤𝑤𝑗𝑗𝑘𝑘 are the weights connected to the output neurons and to the hidden-layer neurons, respectively; 𝑥𝑥𝑖𝑖 is the input.
Performance Analysis
Performance analysis is the process of evaluating how the designed system is or would be function-ing. By evaluating the system, it is possible to de-termine if something could be done to speed up a task, or change the amount of memory required to run the task without negatively impacting the ov-erall function of the system. Performance analysis also helps to adjust components in a manner that helps the design make the best use of available re-sources. The confusion matrix labelling for the computation of the ROC.
The major metrics that are extracted from the confusion matrix are sensitivity, accuracy, specifi-city, precision, and misclassification rate [29]. Sensitivity (Sen) or recall is a measure of the pro-portion of actual positives which were correctly id-entified (true positive rate), accuracy (Acc) is a measure of the degree of closeness of the predict-ed values to the actual values, precision (Pres) is a measure of repeatability or reproducibility and misclassification rate (MR) is the number of in-correctly identified instances divided by the total number of instances.
3. Results and Analysis
The stuttered speech samples that were obtained for use in this research is the University College London Archive of Stuttered Speech (UCLASS) release 1 database. The recordings of the stuttered speech were collected at University College Lon-don (UCL) over a number of years. The record-ings are mostly from children who were referred to clinics in London for assessment of stuttering. The Release One recordings have only monolog speech with an age range from 5 years 4 months to 47 years. For the convenience of users, they were prepared in CHILDES, PRAAT, and SFS formats, all of which are freeware available on the Internet. The speech recordings included both male and female speakers. Table 1 shows the ei-ght samples used and the types of stuttering present
in them. The categories of the stuttering present are burst stuttering (B), reciprocating stuttering (R), blocking stuttering (BL), and interjection (I).
The dysfluencies associated with stuttering can be classed into the following categories [2, 8, 9, 11, 30]:
Bursts stuttering (B)
A syllable is repeated when speaking (“He wa-wa-was a good king”) or (caaaaaaaaaaaaaaaaake).
Reciprocating stuttering (R)
Some syllables are repeated when speaking (“He wwwas a good king”) or (“u-um-um”) or prolong-ed (“uuuum”) or repeatprolong-ed syllable before pronun-ciation (“wa wa wa water”).
Some interjections are added to the sentence (“I have um, um, a test to-day”) or (“School is, well, fine”) or (“The test was, you know, hard”).
The analysis tool for evaluating the automa-tic speaker recognition (ASR) systems was a modi-fication of the analysis tool developed by Best in 1981. In order to cater for more distinction at the boundaries of the analysis tool, it was modified to enhance its ability to effectively handle probabili-ty values that are exactly on the edges such as 20, 40, 60 and 80. Furthermore, the categories negligi-ble and high were divided into 2 each. This was done in order to enhance the grouping of probabi-lities into the two classes and to reduce the band of the two classes. The modifications introduced are described in Table 2.
Objective Measure
3. The MSE between the original speech and the reconstructed speech for all the speech samples is zero, implying that the reconstruction was perfect with excellent quality of speech and a mirror re-flection of the original speech. Similarly, the IS between the original and the reconstructed speech signals was zero. Since the MSE for all samples implied excellent reconstruction, it could be in-ferred that IS value of zero means perfect recon-struction quality.
to the result interpretation of the other 3 metrics. And because it is known that whenever signal processing techniques are applied to any signal, re-versing the process cannot give exactly the same signal as the original signal. Either there is an im-provement of the signal or it is degraded. ASR Evaluation
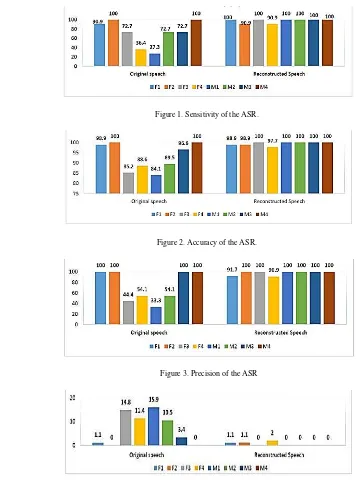
The LSF-MLP, feature extractor classifier was se-Figure 1. Sensitivity of the ASR.
Figure 2. Accuracy of the ASR.
Figure 3. Precision of the ASR
ech. The performance metrics that have been dis-cussed above were applied to evaluate the respon-siveness of the ASR to the original speech. The performance metrics of systems are plotted in Fig-ures 1-4.
The reconstructed speech was also used with the developed ASR system. Though the reconstr-uctted speech has been evaluated using some ob-jective measure, the methodologies used are just distance measures and the MSE. These distance measures only evaluate the closeness between the original speech and the reconstructed speech. And these measures were not able to effectively differ-rentiate between the original speech and the re-constructed speech. As a result, using ASR for proper evaluation of how the speech would be recognized is compulsory. The results of the per-formance of the ASR are as discussed below.
For the original speech, the sensitivity of the ASR to samples F1, F2 and M4 was high, while the system sensitivity to F3, M2 and M3 was sub-stantial and F4 and M1 had low sensitivity. The accuracy was high for F1, F2, M3 and M4 and considerable for the remaining four samples. The precision of the system to M1 was low, F3, F4, and M2 were moderate and high for the other sam-ples. The misclassification rate was poor for F3, F4, M1 and M2 and negligible for the other sam-ples.
For the reconstructed speech, the ASR had a sensitivity of group high for all the samples, with only F2 and F4 that below 100%. Similarly, all the accuracies can as well be put in the group high,
with F1, F2 and F4 slightly below 100%. The values of the precision are also in the group high, with F1 and F4 below 100%. In addition, all the misclassification rates are in the category negli-gible, while only F1, F2, and F4 have values sli-ghtly more than 0%.
Tables 4 and 5 show the summary that re-duces the calculations and explanations of Figu-res 1-4. The hyperbolic tangent sigmoid activeti-on functiactiveti-on (tansig) was used for both the hidden layer and the output layer. From Table 5, it can be seen that the ASR excellently senses each input, puts them in their correct classes, with no mis-firing. Similarly, all the inputs had very small va-lues for the misclassification rates, implying that almost all the samples were correctly classified. Comparing it with the ASR results of the original speech signals, it would be observed that only the
accuracy was very good. The results for the sensi-tivity and precision had a mixture of the different categories. Also, the misclassification rates are all negligible, with values not as low as they should be. Only 4 of the 8 samples had below 5% while the other 4 had values more than 10%.
4. Conclusion
The use of speech reconstruction for stuttered speech for correcting stuttered speech has been en-umerated in this study. Since the LPC algorithm used models the human speech production, the reconstructed speech was very similar to the ori-ginal speech as interpreted by the objective measu-res. The ASR gave a better picture of the recons-tructed speech as all the speech samples were perfectly recognized while only 3 samples of the original speech were perfectly recognized. There-fore, it could be concluded that the reconstructed speech would be better perceived by the stutterers. References
[1] M. Hariharan, V. Vijean, Y. Chong, and Y. Sazali, “Speech stuttering assessment using sample entropy and Least Square Support Vector Machine,” in 8th International
quium on Signal Processing and its Appli-cations (CSPA), 2012, pp. 240–245.
[2] G. Manjula and M. Kumar, “Stuttered Speech Recognition for Robotic Control,” Int. J. Eng. Innov. Technol., vol. 3, no. 12, pp. 174– 177, 2014.
[3] J. Duffy, “Motor speech disorders: clues to neurologic diagnosis,” in Parkinson’s Dise-ase and Movement Disorders, Humana Pre-ss, 2000, pp. 35–53.
[4] E. G. Conture and J. S. Yaruss, “Treatment Efficacy Summary,” Am. speech- language Hear. Assoc., no. 1993, p. 20850, 2002. [5] C. Oliveira, D. Cunha, and A. Santos, “Risk
factors for stuttering in disfluent children with familial recurrence,” Audiol. Res., vol. 18, no. 1, pp. 43–49, 2013.
[6] L. S. Chee, O. C. Ai, M. Hariaran, and S. Yaacob, “MFCC based recognition of repeti-tions and prolongarepeti-tions in stuttered speech using k-NN and LDA,” in 2009 IEEE Stu-dent Conference on Research and Develop-ment and DevelopDevelop-ment (SCOReD), 2009, pp. 146–149.
[7] M. Hariharan, L. S. Chee, and S. Yaacob, “Analysis of infant cry through weighted li-near prediction cepstral coefficients and Pr-obabilistic Neural Network,” J. Med. Syst., vol. 36, no. 3, pp. 1309–15, Jun. 2012. [8] J. Zhang, B. Dong, and Y. Yan, “A
Compu-ter-Assist Algorithm to Detect Repetitive Stuttering Automatically,” in 2013 Internati-onal Conference on Asian Language Proce-ssing (IALP), 2013, pp. 249–252.
[9] S. Awad, “The application of digital speech processing to stuttering therapy,” in IEEE Sensing, Processing, Networking, Instrumen-tation and Measurement Technology Confer-ence, IMTC 97, 1997, pp. 1361–1367. [10] L. S. Chee, O. C. Ai, M. Hariharan, and S.
Yaacob, “Automatic detection of prolonga-tions and repetiprolonga-tions using LPCC,” in Inter-national Conference for Technical Postgrad-uates 2009, TECHPOS 2009, 2009, pp. 1–4. [11] K. Hollingshead and P. Heeman, “Using a uniform-weight grammar to model disfluen-cies in stuttered read speech: a pilot study,” Oregon, 2004.
[12] J. Pálfy and J. Pospichal, “Pattern search in dysfluent speech,” in 2012 IEEE Inter-natio-nal Workshop on Machine Learning for Sig-nal Processing (MLSP), 2012, pp. 1–6. [13] I. Mansour and S. Al-Abed, “A New
Archi-tecture Model for Multi Pulse Linear
Predic-Education Foundation, 2014.
[15] D. Jones, S. Appadwedula, M. Berry, M. Ha-un, J. Janovetz, M. Kramer, D. Moussa, D. Sachs, and B. Wade, “Speech Processing: Theory of LPC Analysis and Synthesis,” Co-nnexions. June, 2009.
[16] L. Rabiner and R. Schafer, Digital processing of speech signals. Prentice-Hall, 1978. [17] Q. P. Li, Speaker Authentication.
Springer-Verlag Berlin Heidelberg, 2012.
[18] R. L. Venkateswarlu and R. Vasanthakumari, “Neuro Based Approach for Speech Recog-nition by using Mel-Frequency Cepstral Co-efficients,” Int. J. Comput. Sci. Commun., vol. 2, no. 1, pp. 53–57, 2011.
[19] C. Cornaz, U. Hunkeler, and V. Velisavljevic, “An automatic speaker recognition system,” Lausanne, Switzerland, 2003.
[20] G. T. Tsenov and V. M. Mladenov, “Speech recognition using neural networks,” in Neu-ral Network Applications in Electrical Engi-neering (NEUREL), 2010 10th Sym-posium on, 2010, pp. 181–186.
[21] V. Namburu, “Speech Coder Using Line Sp-ectral Frequencies of Cascaded Second Or-der Predictors,” VirginiaTech, 2001.
[22] P. Kabal and R. Ramachandran, “The com-putation of line spectral frequencies using Chebyshev polynomials,” IEEE Trans. Aco-ust. Speech Signal Process., vol. 34, no. 6, pp. 1419–1426, 1986.
[23] W. B. Kleijn, T. Bäckström, and P. Alku, “On line spectral frequencies,” IEEE Signal Pro-cess. Lett., vol. 10, no. 3, pp. 75–77, 2003. [24] R. Kumar, R. Ranjan, S. K. Singh, R.
Kala, A. Shukla, and R. Tiwari, “Multilingual Speaker Recognition Using Neural Net-wo-rk,” in Proceedings of the Frontiers of Rese-arch on Speech and Music, FRSM, 2009, pp. 1–8.
[25] M. A. Al-Alaoui, L. Al-Kanj, J. Azar, and E. Yaacoub, “Speech recognition using artifi-cial neural networks and hidden Markov mo-dels,” IEEE Multidiscip. Eng. Educ. Mag., “Prosodic feature based text dependent spe-aker recognition using machine learning al-gorithms,” Int. J. Eng. Sci. Technol., vol. 2, no. 10, pp. 5150–5157, 2010.
271–274, 1998.
[30] M. Hariharan, L. S. Chee, O. C. Ai, and S. Yaacob, “Classification of speech