Mineral Resources Estimation Based on Block Modeling
Waterman Sulistyana Bargawa
1, a)and Nur Ali Amri
2, 3, b)1Master of Mining Engineering, UPN “Veteran” Yogyakarta, 55283 SWK 104 Yogyakarta, Indonesia. 2Mining Engineering Department, UPN “Veteran” Yogyakarta 55283 SWK 104, Yogyakarta, Indonesia. 3 School of Mathematical Sciences, Faculty of Science and Technology, Universiti Kebangsaan Malaysia 43600
Bangi, Selangor, Malaysia.
a)Corresponding author: [email protected] b)[email protected]
Abstract. The estimation in this paper uses three kinds of block models of nearest neighbor polygon, inverse distance squared and ordinary kriging. The techniques are weighting scheme which is based on the principle that block content is a linear combination of the grade data or the sample around the block being estimated. The case study in Pongkor area, here is gold-silver resource modeling that allegedly shaped of quartz vein as a hydrothermal process of epithermal type. Resources modeling includes of data entry, statistical and variography analysis of topography and geological model, the block model construction, estimation parameter, presentation model and tabulation of mineral resources. Skewed distribution, here isolated by robust semivariogram. The mineral resources classification generated in this model based on an analysis of the kriging standard deviation and number of samples which are used in the estimation of each block. Research results are used to evaluate the performance of OK and IDS estimator. Based on the visual and statistical analysis, concluded that the model of OK gives the estimation closer to the data used for modeling.
INTRODUCTION
Many grade estimation techniques are used to determine the potency of mineral resources or reserves. Conventional estimation techniques such as triangular, statistics or cross-section method has been widely abandoned because it is done by hand, so it is not practical and the grade estimation results are often unsatisfactory. Estimation techniques with block modeling was developed using computer tools [1]. Estimation methods using the block model, among others are the NNP (nearest neighbor polygon), IDW (inverse distance weighting) and kriging. OK with IDS estimation technique here used as a comparison. Block modeling is expected to provide an overview of mineralization geometry, grade distribution and the amount of resources.
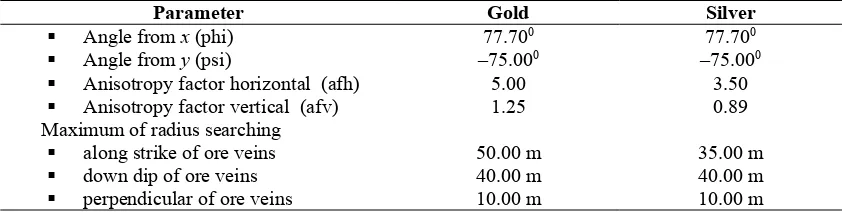
The study location lies in the area of Pongkor and Cikotok mount, West Java Province of Indonesia (FIGURE 1). Intrusive andesite lithology is exposed in the northern as a part of the study area, and broke to the volcano lithology. Andesite rocks are estimated as a carrier in the form of vein mineralization. The ore veins have average width of 2.5 meters, direction of veins strike around of N120E and average slope around 750 to the
west [2]. FIGURE 2 shows the geological map of Cikidang area West Java Province Indonesia.
METHOD AND MATERIALS
) ( 494 . 0 457 . 0 / 4 2 / 1 ) ( ) ( 2 1 ) ( h N j S Z i S Z h N h N h (1) (1)whereh si -sj.
FIGURE 1. Location map of research area
Empirical semivariogram is a manifestation of discrete function which needs to be paired continuously [4]. Semivariogram fitting, here using spherical function formulated as [5], a h a h a h c h h a h c
c
0 5 . 0 5 . 1 0 ) ( 0 3 , 0 0
(2)(2)
While weighted least squares (WLS) model formulated as,
2
1
ˆ
(
;
)
1
)
(
ˆ
)
(
2
1
)
(
i z i z n i i WLSh
h
h
N
MINIMUM
R
FIGURE 2. Geological map of Cikidang area West Java Province Indonesia
(3)
un-sampled grades location using samples around the site. Generally, the weighting of grade estimation known as the principle of weighted average. In the mining industry, the weighted average principle widely used to calculate the average (or mean) of the variables that exist in mineral deposits [6].
Kriging technique allows a probabilistic interpretation of the mineral deposits or reserve data. In addition, kriging allows for the statistical interpretation of the bias and variance estimation. Simply, kriging produces a set of weights that minimize the variance of the estimation in accordance with the sample configuration around the block and the nature of the mineralization [1 and 5]. Mineralization properties stated in the variogram function quantifies the correlation between the sample chambers. This method is quite accurate because it can take into account of the anisotropy behavior. Two main results obtained from these techniques are estimation and variance or standard deviation of kriging as a measure of reliability [7].
The spatial sample in kriging technique is the data represent the population of other around data (including the un-sampled data). Say, s0is a un-sampled point which will be predicted, then the block prediction, to the
value of Z(s0) can be formulated as[5, 8],
n i i iB
z
s
1
)
(
ˆ
(3)I is the weight of i-th to the s0. Un-biasness happen if , while the optimal condition occurs if the
difference of the real sample variance to the estimated sample is a minimum, or . Mathematically, written as
22
2
(
ˆ
)
(
ˆ
)
)
ˆ
(
B BE
B BE
B BVar
22 2
)
ˆ
(
)
ˆ
2
ˆ
(
B B B BE
B BE
22 2
)
ˆ
(
)
(
)
ˆ
(
2
)
ˆ
(
0
E
B
E
B
B
E
B
E
B
BThen, 2 1 2 1 2 1
)
(
)
(
2
)
(
)
(
n B Bi i i
n
i i i
B n
i i i
E
s
z
E
s
z
E
s
z
E
Variance of block prediction is written as
)
(
(
)
,
(
)
),
(
(
2
1 1 1 0 2 j i j i n i n i n i iB
z
s
B
B
B
z
s
s
(4)The basic principle of an inverse distance squared (IDS) method is determining of the sample weight (wi), as
a function of distance to the block being sample estimated. An inverse distance method is a linear combination or weighted average value of the grade composite around the block which is defined as follows (valid for n> 0) [1, 2]:
n ii
z
s
w
s
Z
1 1 0*
(
)
(
(
),
i 1,...,n. (5)
where: =estimation grade for IDS
wi=sample weight
DISCUSSION
Assay data for modeling were obtained from 57 holes of core drilling, ten data obtained from the stope sampling, and three data from the surface. Descriptive statistical analysis performed regardless of the position of each data. The result of this statistic is used as the initial information to interpret the characteristics of the entire sample in general. Based on the statistical analysis conducted on 751 gold assay data and as many as 637 silver assay data, the average values obtained gold assay was 8.81 g/t, with a variance of 193 (g/t)2. The mean of silver
assay is 56.4 (g/t), and variance of 6910 (g/t)2. In this case the constructing of a composite data based to
homogenize the data interval, so the estimation of each block will be assessed by the sample which is same volume of geometric support. Compositing data interval of 2.5 m selected because of the smallest standard deviation value compared to other composites. Type of rock used in the estimation divided into two parts, namely non-ore veins and ore veins. The data used to estimate, simply the assay or composite data that is in the ore veins.
Gold and silver assay variography done by the searching direction along the average of strike and direction of slope of the ore veins. Fitting theoretical variogram based on a spherical model, as Eq. 2. The calculation based on Eq. 1producesthe parameters as seen in TABLE 1 and TABLE 2.
TABLE 1. Gold and silver assay variogram parameters
Along strike veins of variogram parameter
Parameter Gold Silver
Class interval 5 m 10 m
Nugget 100 (g/t)2 1,800 (g/t)2
Sill 200 (g/t)2 6,910 (g/t)2
Range 30 m 33 m
Down dip veins variogram parameter
Class interval 5 m 10 m
Nugget 55 (g/t)2 2,000 (g/t)2
Sill 200 (g/t)2 6,910 (g/t)2
Range 30 m 28 m
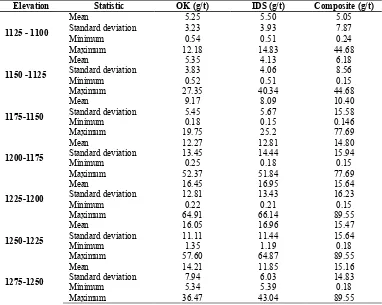
TABLE 2.Sample search parameter
Parameter Gold Silver
Angle from x (phi) 77.700 77.700
Angle from y (psi) –75.000 –75.000
Anisotropy factor horizontal (afh) 5.00 3.50
Anisotropy factor vertical (afv) 1.25 0.89 Maximum of radius searching
along strike of ore veins 50.00 m 35.00 m
down dip of ore veins 40.00 m 40.00 m
perpendicular of ore veins 10.00 m 10.00 m
Three-dimensional model of gold-silver ore deposits can be made on the basis of topographic data, geological information, and the levels of investigation results of exploration samples. Topographic modeling is done by digitizing topographic maps. The geological model of mineralized veins is based on the interpretation of 20 cross-sectional shapes of the veins around the west-east orientation. Shape modeling interpretation of vein is conducted by digitization geologist. Geological boundaries are necessary so that the samples are located in the veins not extrapolated to the outside of vein blocks. Grade estimation of OK and IDS performed by database of gold-silver composite. Grade estimation was performed using a minimum composite of 1 and a maximum of 10. The grade estimation of block is only performed on the block which is in the ore veins.
RESULTS AND DISCUSSION
volume, block percentage in the vein and the percentage of topography. Tabulation of gold-silver resources in this model is done at various grades boundary. The gold-silver resource number of block modeling results using OK, IDS, and the NNP (Eq. 3 and Eq. 5) can be seen in TABLE 3 and 4 below. The depiction of a vertical cross-section of each model was used to determine the block model selection. Grade distribution in cross section block is then compared with same cross-section of the composite data (TABLE 5 and 6).
TABLE 3.Number of gold-silver resource based on NNP
COG (g/t) Tonnage Gold (g/t) Silver (g/t)
0 1,030,275 10.38 31.78
4 663,200 15.35 43.44
6 561,810 17.14 49.23
10 445,184 19.48 54.98
TABLE 4.Comparison of the OK and IDS modeling results
Model Cog Minimum number of composite=2Tonnage Au (g/t) Ag (g/t) Minimum number of composite=3Tonnage Au (g/t) Ag (g/t)
OK
0 g/t 699,197 10.18 40.96 506,827 11.26 48.02 4 g/t 475,037 14.33 54.58 369,177 14.86 60.72 6 g/t 385,273 16.42 64.89 304,287 16.84 72.47 10 g/t 295,111 18.98 74.96 221,861 20.10 88.52
IDS
0 g/t 699,197 10.31 42.78 496,907 11.57 56.25 4 g/t 459,987 14.94 59.01 357,327 15.51 72.76 6 g/t 379,147 16.96 68.97 298,167 17.47 85.39 10 g/t 309,281 18.99 77.36 235,281 20.01 97.86
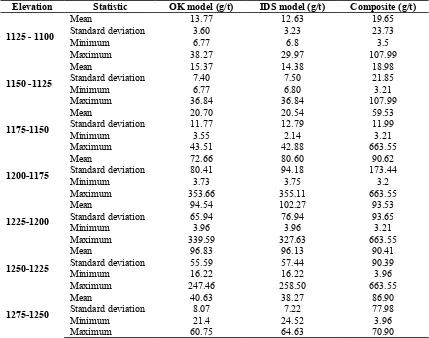
TABLE 5. Statistical comparisons between the gold grade of OK and IDS model at various elevations
Elevation Statistic OK (g/t) IDS (g/t) Composite (g/t)
1125 - 1100
Mean 5.25 5.50 5.05
Standard deviation 3.23 3.93 7.87
Minimum 0.54 0.51 0.24
Maximum 12.18 14.83 44.68
1150 -1125
Mean 5.35 4.13 6.18
Standard deviation 3.83 4.06 8.56
Minimum 0.52 0.51 0.15
Maximum 27.35 40.34 44.68
1175-1150
Mean 9.17 8.09 10.40
Standard deviation 5.45 5.67 15.58
Minimum 0.18 0.15 0.146
Maximum 19.75 25.2 77.69
1200-1175
Mean 12.27 12.81 14.80
Standard deviation 13.45 14.44 15.94
Minimum 0.25 0.18 0.15
Maximum 52.37 51.84 77.69
1225-1200
Mean 16.45 16.95 15.64
Standard deviation 12.81 13.43 16.23
Minimum 0.22 0.21 0.15
Maximum 64.91 66.14 89.55
1250-1225
Mean 16.05 16.96 15.47
Standard deviation 11.11 11.44 15.64
Minimum 1.35 1.19 0.18
Maximum 57.60 64.87 89.55
1275-1250
Mean 14.21 11.85 15.16
Standard deviation 7.94 6.03 14.83
Minimum 5.34 5.39 0.18
Maximum 36.47 43.04 89.55
results of gold-silver estimation resource (TABLE 3 and 4) showed that the decrease in the cut-off grade can improve tonnage resources. Declining of cut-off grade caused more of blocks classified as a resource and the mean grade of the whole block will fall. TABLE 4 shows, the more number of composite samples which is used in the estimation lead to the fewer number of blocks used in the resource/reserve estimation.
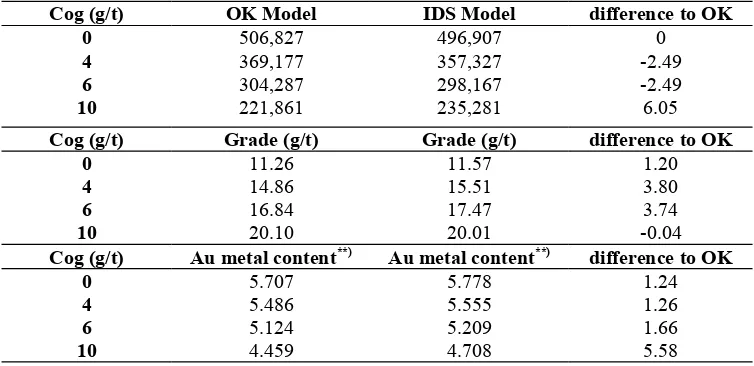
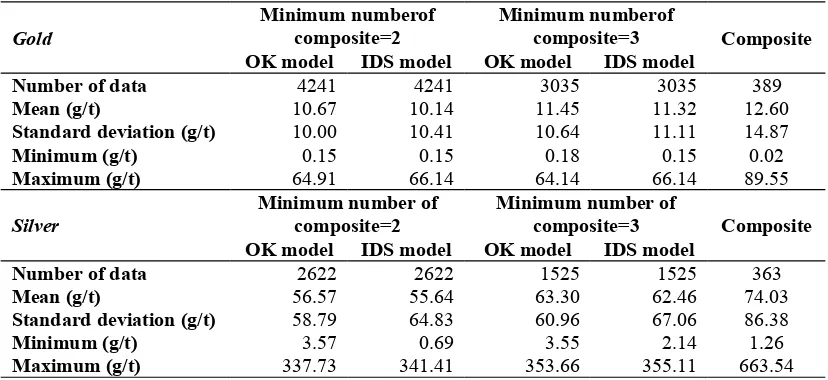
TABLE 5 and 6 show that, the results of the estimation on OK and IDS does not show high variations of the composite data, but overall, the OK model is more likely to have a resemblance to the composite grade. Kriging variance (as in Eq. 4) is a function of the sample configuration around the estimated block. In this study, a combination of kriging standard deviation and number of block estimation samples is a criterion that is used to classify the gold-silver resource (TABLE 7 see Appendix). In TABLE 8 (see Appendix) it can be seen that the OK model appears more conservative than the IDS models. OK model over limit to extrapolate the high grades. TABLE 9 (see Appendix) shows that the level of OK block model has a statistical value which is closer to the statistical value of the composite.
TABLE 6. Statistical comparisons between the silver grade of OK and IDS model at various elevations
Elevation Statistic OK model (g/t) IDS model (g/t) Composite (g/t)
1125 - 1100
Mean 13.77 12.63 19.65
Standard deviation 3.60 3.23 23.73
Minimum 6.77 6.8 3.5
Maximum 38.27 29.97 107.99
1150 -1125
Mean 15.37 14.38 18.98
Standard deviation 7.40 7.50 21.85
Minimum 6.77 6.80 3.21
Maximum 36.84 36.84 107.99
1175-1150
Mean 20.70 20.54 59.53
Standard deviation 11.77 12.79 11.99
Minimum 3.55 2.14 3.21
Maximum 43.51 42.88 663.55
1200-1175
Mean 72.66 80.60 90.62
Standard deviation 80.41 94.18 173.44
Minimum 3.73 3.75 3.2
Maximum 353.66 355.11 663.55
1225-1200
Mean 94.54 102.27 93.53
Standard deviation 65.94 76.94 93.65
Minimum 3.96 3.96 3.21
Maximum 339.59 327.63 663.55
1250-1225
Mean 96.83 96.13 90.41
Standard deviation 55.59 57.44 90.39
Minimum 16.22 16.22 3.96
Maximum 247.46 258.50 663.55
1275-1250
Mean 40.63 38.27 86.90
Standard deviation 8.07 7.22 77.98
Minimum 21.4 24.52 3.96
Maximum 60.75 64.63 70.90
CONCLUSION
Based on the above discussion it can be concluded that OK model is more feasible applied to the modeling of gold-silver resource. Based on kriging standard deviation distribution can be obtained classification of mineral resources. The classification of resources of gold and silver in this study may categorize the amount of resources in the classification of inferred, indicated and measured for gold and silver ore.
REFERENCES
2. I.W. Warmada, B. Lehmann and M. Simandjuntak and H.S. Hemes, Fluid Inclusion, Rare-Earth Element and Stable Isotope Study of Carbonate Minerals from the Pongkor Epithermal Gold – Silver Deposit, West Java, Indonesia. Journal of Resource Geology 57 (2): 124 – 135, 2007.
3. N. Cressie and D.M. Hawkins, Robust estimation of the variogram. Journal of Association for Mathematical Geology, 12 (2): 115-125, 1980.
4. Y. Chen and X. Jiao, Semivariogram fitting with linear programming. Journal of Computers & Geosciences 27: 71-76, 2001.
5. N. Cressie, Statistics for spatial data. New York. Chichester. Toronto. Brisbane. Singapore: John Wiley & Sons, Inc., 1993.
6. N.A. Amri, A.A. Jemain and W.F.W. Hassan, Ordinary kriging based on OLS-WLS fitting semivariogram: Case of gold vein precipitation, Proceedings of the 3rd International Conference on Mathematical Sciences.
AIPConf. Proc.1602, 1039-1045, 2014.
7. S.B. Waterman, The problems of outliers and confidence intervals in grade estimation using ordinary kriging, Proceeding of Association of Indonesian Mining Professional, 2009.
8. O. Schabenberger and C.A. Gotway, Statistical methods for spatial data analysis. Boca Raton London New York: Chapman & Hall/CRC, 2005.
APPENDIX
TABLE 7. Classification of gold-silver resource in OK model
Cog
(g/t Au) Ore Measured and indicated Inferred
tonnage
Grade of Au g/t
Grade of Ag g/t
Ore tonnage
Grade of Au g/t
Grade of Ag g/t 0 699,197 10.18 42.78 331,078 10.81 8.55 4 475,037 14.33 36.61 188,163 17.91 10.19 6 385,237 16.42 67.24 176,576 18.93 9.94 10 295,111 18.98 77.09 150,073 20.46 11.49
TABLE 8. Ore tonnage comparison of gold content on OK and IDS*) and difference (%) to OK model
Cog (g/t) OK Model IDS Model difference to OK
0 506,827 496,907 0
4 369,177 357,327 -2.49
6 304,287 298,167 -2.49
10 221,861 235,281 6.05
Cog (g/t) Grade (g/t) Grade (g/t) difference to OK
0 11.26 11.57 1.20
4 14.86 15.51 3.80
6 16.84 17.47 3.74
10 20.10 20.01 -0.04
Cog (g/t) Au metal content**) Au metal content**) difference to OK
0 5.707 5.778 1.24
4 5.486 5.555 1.26
6 5.124 5.209 1.66
10 4.459 4.708 5.58
TABLE 9.Common statistical result on OK and IDS models
Gold
Minimum numberof
composite=2 Minimum numberofcomposite=3 Composite
OK model IDS model OK model IDS model
Number of data 4241 4241 3035 3035 389
Mean (g/t) 10.67 10.14 11.45 11.32 12.60
Standard deviation (g/t) 10.00 10.41 10.64 11.11 14.87
Minimum (g/t) 0.15 0.15 0.18 0.15 0.02
Maximum (g/t) 64.91 66.14 64.14 66.14 89.55
Silver
Minimum number of
composite=2 Minimum number ofcomposite=3 Composite
OK model IDS model OK model IDS model
Number of data 2622 2622 1525 1525 363
Mean (g/t) 56.57 55.64 63.30 62.46 74.03
Standard deviation (g/t) 58.79 64.83 60.96 67.06 86.38
Minimum (g/t) 3.57 0.69 3.55 2.14 1.26