A Web Application and Database for Agriculture Genetic Diversity
and Association Studies
James W. Baurley*, Anzaludin S. Perbangsa, Anindito Subagyo and Bens Pardamean
Bioinformatics Research Group; Bina Nusantara University
Anggrek Campus - 7
thFloor; Jl. Kebon Jeruk Raya No. 27; Jakarta, Indonesia 11480,
[email protected], [email protected], [email protected],
[email protected]
Abstract
Studies are underway to catalog genetic diversity in plants and animals and identify genetic variants predictive of economically important traits (e.g., yield, resistance to disease). The high-throughput DNA genotyping and sequencing technologies used in these studies produce large amounts of complex data. Agriculture geneticists are faced with numerous computational obstacles with storing, processing, and analyzing genetic and trait data. We introduce a web application for large-scale agriculture genetic diversity and association studies that aims to simplify and automate many of the data management and analysis tasks common across studies. We present a case study where our software is configured and populated with genome-wide data of over 750,000 genetic markers from the commercially available BovineHD array (Illumina Inc.). Our software is scalable to multiple species and applicable to a wide range of genotyping and sequencing technologies and study designs.
Keywords: agriculture genetics, genetic association study, genome-wide, genetic diversity, bioinformatics, statistical genetics, agriculture information system, animal breeding, plant breeding
1. Introduction
In a recent report by the Food and Agriculture Organization of the United Nations (FAO), it is estimated that by the year 2050 the population of the world will increase by 34%. This increase will demand a 70% increase in food production [1]. Presently, there exists a tightly balanced supply and demand in food production. A single shock to the system (e.g., a natural disaster or disease) may create a food shortage. Technology can be used to alleviate this sensitivity, one of which is in the field of genetics. DNA genotyping and sequencing technologies are being used to uncovering the genetic component of important traits and diseases in plants and animals [2]. Desirable traits such as high yield and higher nutritional content are cultivated and preserved while undesirable traits such as genetic susceptibility to disease are removed [3].
dramatically lowered genotyping costs. Declining costs have enabled geneticists to move towards genome-wide genotyping arrays and genotyping-by-sequencing (GBS). Data analysis, storage and management are the most essential elements of these technologies [6].
A computer system for genetic studies in agriculture has certain requirements in common, regardless of the technology used and the species. These requirements can be broken into two major categories, data management and data analysis. Data management requires storage and backup systems of the raw data, a large memory workspace to process data, methods to extract relevant variables for analysis, and sufficient bandwidth to transfer data among different sites, servers, and researchers. Data analysis usually is performed with specialized software and, depending on the analysis, may require parallel and high performance computing (HPC). These requirements have become a significant barrier to progress in genomics, particularly in agriculture [7, 8].
We introduce a web application specifically tailored for agriculture genetics studies that addresses these problems. The system is comprised of a relational database and a software application for managing and analyzing genotypes, traits, and annotations. The system reduces programming and computing overhead while providing a flexible and scalable framework for new genotyping technologies and accumulating samples and variables. The system uses a centralized database, allowing researchers concurrent access to study data and the ability to share results in real time.
In the next section, we give an overview of the software design and describe the database, web application, and interfaces to external software. We then introduce a case study using pilot data from the genome-wide bovine genotyping array of over 750,000 SNPs (Illumina, Inc. BovineHD BeadArray). We conclude with a discussion of t he key features of the software, cloud computing extensions, and future research directions.
2. Specification of the System
2.1. Overview
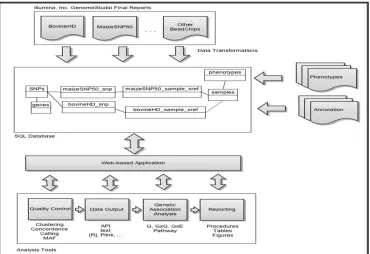
The software manages a variety of data inputs and generates outputs in formats ready for analysis tools Figure 1. Inputs to the system include genotypes exported from DNA genotyping or sequencing instrument, phenotypic/trait data captured in the lab or on the field, and descriptive meta-data. The descriptive data for SNPs, often called annotation, consists of the chromosome, position, functional classification, and nearest gene. Genes are linked to external databases that describe their biological function, such as dbSNP [9], the Kyoto Encyclopedia of Genes and Genomes (KEGG) [10], and Gene Ontology (GO) [11]. Parameters of data collection (e.g., GPS coordinates) are recorded for traits variables, when applicable.
Figure 1. System Conceptual Diagram
DNA genotyping or sequencing data is imported into a relational database along with phenotypes/traits and genetic annotations. An application functions as an interface between data and various bioinformatics and statistical software in a multistep analysis workflow.
Input data is verified for completeness and transformed by a number of scripts
before being inserted into the database. The database is organized into logical groups
called schemas for each species. Each genotyping array has a long table that contains
the genotypes for all the DNA samples and acts as a cross-reference between samples
and SNPs. The user manages and analyzes their data through a web application that
handles security and data input/output.
The software automatically calculates genotyping quality control metrics such as
sample and SNP genotyping call rates and allows filtering based on one or more
criteria (
e.g.
, by chromosome region, samples from a particular farm or region,
animals developing disease). The data can be exported in the format needed for a
particular step in the data analysis workflow, for example in STRUCTURE format for
inferring population structure or in PLINK, [R] or TASSEL format for genetic
association
analysis [13-16].The application allows data from these external packages
to be imported into the database for additional filtering and summaries, and sharing
across the research team.
2.2. Database
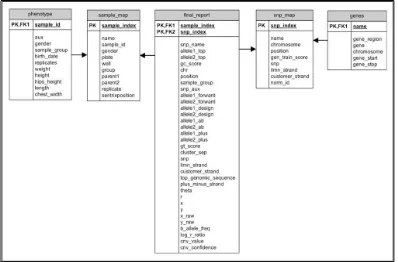
The entity-relationship diagram for the database is presented in Figure 2. The snp_map table describes the SNPs contained on the array, such as where (chromosome and position), the polymorphic nucleotides (e.g., adenine or cytosine), and attributes of the array design. The sample_map table contains data on the DNA samples. The final_report contains the genotypes for all the samples as well as information on the quality of the genotype calling. Trait data is stored in the phenotype table and linked to the sample_map by a one-to-many relationship. Annotations for the SNPs are in the genes table and can be used for mapping the results for the SNPs to genes or looking up results for genes of interests.
Figure 2. Entity-Relationship Diagram for Cattle
The snp_map table describes the SNPs on the array and the sample_map describes the samples genotyped. The final_report contains the genotypes and quality information for all the samples. Plant and animal traits are stored in the phenotype table. Gene annotations for the SNPs on the array are in the genes table.
The primary key for final_report is the combination of sample_index and snp_index and dramatically improves the speed of sample based data retrieval (i.e., queries by sample). A second index for final_report with the order of the columns reversed allows for quick retrieval of SNP-based queries (e.g., genotypes for particular SNPs).
Many application-programming interfaces (APIs) can access PostgreSQL directly allowing the user to apply many external tools to data residing in the database. For example, results can be retrieved into Microsoft Excel using pre-installed middleware on most operating system, for example ODBC (Open Database Connectivity) and JDBC (Java Database Connectivity).
2.3. Application
design properties are built into the application included accessibility, security, usability, and scalability. The application may be accessed from web browsers with an Internet connection, meaning that no specialized hardware or software is needed onsite to use the application. The application can run on any operating system that supports a web -browser, including mobile devices. The specific system design and technology stack for the application is described in Table 1.
Table 1. System Design and Technology Stack
Feature Description
Security System design Web server Server script Client script Database
Server Operating System Client Operating System Statistical Support
Authentication, Authorization Web Application
Apache 2.2.9 PHP 5.2.6
Javascript 1.7, HTML 5, CSS 3 PostgreSQL 9.2
Ubuntu 12.04.1 LTS All
[R] 2.14
To access the system, users must have an account and their activi ties are limited by permissions. For example, a user may be allowed to access data for a particular species or only view limited data. User authentication and authorization is managed within the application for easy administration.
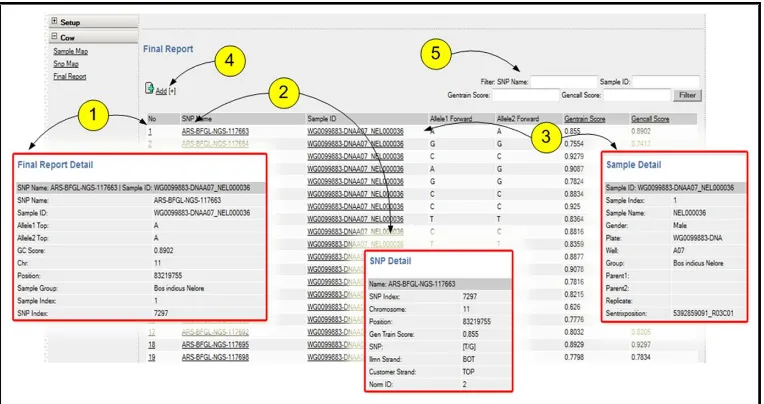
A user, once logged into the system, can select among available species and studies. Once a species is selected, genotype data is displayed and the user can begin filtering the results. Subsets of columns in the final report are displayed in the web application (Figure 3). The user can filter the genotyping results by samples, SNPs, and common quality control variables. The column entries are links to detailed information about the genotype, SNP, and sample. Filtered data can be exported in various formats (e.g., delimited text) for external analysis software.
The user can filter genotypes (5) and obtain information on genotyping (1), SNP (2), and samples (3). Genotype data can be replaced or imported from the array scanner using (4).
While the data imported from the array scanner cannot be modified in the user
The Indonesian Center for Agricultural Biotechnology and Genetic Research and Development (ICABIOGRAD) is performing genome-wide association studies for various traits in cattle (e.g., growth rate and twinning). The center is currently collecting data and genotyping using the Illumina BovineSNP50 and BovineHD arrays. Both arrays contain evenly spaced SNPs that span the entire bovine genome, the BovineSNP50 contains 54,609 SNPs with an average spacing of 49.4 kilobases (kb) and the BovineHD contains SNPs with spacing < 3 kb. While data collection is underway, we configured our software for the BovineHD using available data from Illumina for twelve cows for software prototyping and testing.
The software was configured on a six core Intel Xeon 2.0 GHz, 8 GB memory server running Ubuntu Linux (12.04.1). The final report from GenomeStudio for the twelve cows was 1.88 gigabytes (GB) or approximately 160 megabytes (MB) per DNA sample. The file was checked for errors and transformed using a shell script and inserted into the tables cow.final_report (9.3 million genotypes), cow.sample_map (12 samples), and cow.snp_map (777,962 SNPs). The tables were indexed to improve the performance of queries and the resulting database size was 2,991 MB on disk.
We configured SAS, [R], and Microsoft Excel to directly access the database, allowing agriculture geneticists to directly pull data into specialized statistical software. We demonstrate this powerful feature in the [R] language for statistical computing by performing common quality control. The [R] language contains a comprehensive set of bioinformatics and statistical genetics packages and supports direct connections to PostgreSQL databases using the ‘RPostgreSQL’ package. A simple but important quality control metric is the SNP call rate. The call rate can be calculated by writing a database query (Program 1) and passing it to PostgreSQL using the dbSendQuery function in [R].
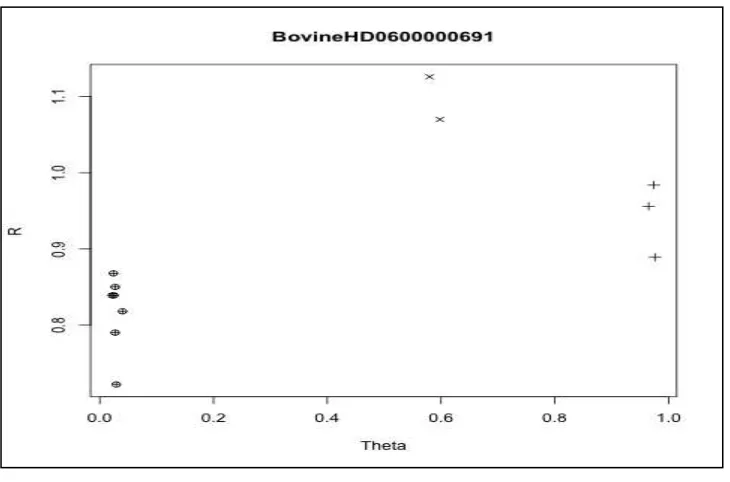
(Figure 4). When there are genotype misclassifications or missingness, further investigation into the clustering algorithm and assumptions are needed.
Figure 4. Single SNP Clustering for BovineHD
The intensities and genotypes for the twelve cows are shown for the BovineHD0600000691 genetic variant. The plot shows three clusters corresponding to AA, AB, and BB genotypes. Based on these data, this SNP would pass quality control.
4. Discussion
Our application provides a valuable research tool for agricult ure geneticist, even with limited access to information technology, programming, and bioinformatics support. The system reduce the time from data collection to results by removing many of the time consuming data management tasks such as data filtering and formatting for various analysis packages. These activities would traditionally involved programming and would need to be duplicated for each analysis package, a process that can easily introduce error into the analysis. As shown in the case study, subsets of the data can be accessed directly and customized for the analysis task, allowing the user to focus on results and interpretation rather than data processing.
The application may improve the efficiency of the entire research team because multiple users can interact with the data concurrently, a feature that is not available in desktop solutions. The DBMS helps ensures security and data integrity, which is impossible with large flat files. Analysis results may be imported into the database with a timestamp to assist in versioning, an important requirement for reproducible results. For example, genetic association results are conditional on removing duplicate and poor quality samples.
want to share data on a species but have separate genotyping or sequencing facilities. Once data is in the system, it can be combined in a pooled analysis or summarized by study and combined in large and statistically powerful meta -analyses. One limitation to our approach is that an Internet connection is required to access the system, which may not be applicable in remote areas. Another is that when additional genotypes are added, the final_report table requires re-indexing, which may be time consuming with very large sample sizes.
5. Conclusions
Our software application provides agriculture geneticist with a powerful toolset for genetic diversity studies and association studies of important traits in plants and animals. Our case study demonstrated that our approach is feasible for larger arrays and that users can query complex datasets directly in statistical software. Our approach removes many technical barriers in analyzing agriculture genetic data and created a platform for translating results into predictive models for animal and plant breeding studies. Future work includes configuring the software for rollout in the cloud using a pre-configured virtual server on Amazon Elastic Compute Cloud (EC2).
Acknowledgements
We would like to thank the team at the Indonesian Center for Agricultural Biotechnology and Genetic Research and Development (ICABIOGRAD), Bogor, Indonesia.
References
[1] FTO. How to Feed the World in 2050. Technical Report, (2009).
[2] R. Bobby, R. Bazzelle, W. Clark, S. K. Kantartzi, K. Meksem, M. Akond and M. A. Kassem, “Genetic Analysis of Yield Components in the PI 438489B by `Hamilton' Recombinant Inbred Line (RIL) Population of Soybean” [Glycine max (L.) Merr.]. Journal of Agricultural Science, vol. 4, (2012).
[3] P. Ianella, C. M. McManus, A. R. Caetano and S. R. Paiva, “PRNP haplotype and genotype frequencies in Brazilian sheep: Issues for conservation and breeding programs”, Research in Veterinary Science, vol. 93,
(2012), pp. 219-225.
[4] T. L. Turner and P. M. Miller, “Investigating Natural Variation in Drosophila Courtship Song by the Evolve and Resequence Approach”, Genetics, vol. 191, (2012), pp. 633-642.
[5] J. Yan, X. Yang, T. Shah, H. Sanchez-Villeda, J. Li, M. Warburton, Y. Zhou, J. H. Crouch and Y. Xu, “High-throughput SNP genotyping with the GoldenGate assay in maize”, Molecular Breeding, vol. 25,
(2009), pp. 441-451.
[6] M. M. Thudi, Y. Y. Li, S. A. S. Jackson, G. D. G. May and R. K. R. Varshney, “Current state-of-art of sequencing technologies for plant genomics research”, Briefings in Functional Genomics, vol. 11, (2012), pp. 3-11.
[7] R. B. Gasser and C. Cantacessi, “Heartworm Genomics: Unprecedented Opportunities for Fundamental Molecular Insights and New Intervention Strategies”, Topics in Companion Animal Medicine, vol. 26,
(2011), pp. 7-7.
[8] K. Fortney and I. Jurisica, “Integrative computational biology for cancer research”, Human Genetics, vol. 130, (2011), pp. 465-481.
[9] S. T. Sherry, M. H. Ward, M. Kholodov, J. Baker, L. Phan, E. M. Smigielski and K. Sirotkin, “dbSNP: the NCBI database of genetic variation”, Nucleic acids research, vol. 29, (2001), pp. 308-311.
[10] M. Kanehisa, S. Goto, Y. Sato, M. Furumichi and M. Tanabe, “KEGG for integration and interpretation of large-scale molecular data sets”, Nucleic acids research, vol. 40, (2012), pp. D109-14.
[12] P. Danecek, A. Auton, G. Abecasis, C. A. Albers, E. Banks, M. A. DePristo, R. E. Handsaker, G. Lunter, G. T. Marth, S. T. Sherry, G. McVean and R. Durbin, “1000 Genomes Project Analysis Group”, The variant call format and VCFtools, Bioinformatics (Oxford, England), vol. 27, (2011), pp. 2156-2158.
[13] M. J. Hubisz, D. Falush, M. Stephens and J. K. Pritchard, “Inferring weak population structure with the assistance of sample group information”, Molecular ecology resources, vol. 9, (2009), pp. 1322-1332. [14] S. Purcell, B. Neale, K. Todd-Brown and L. Thomas, “PLINK: a tool set for whole-genome association and
population-based linkage analyses”, The American Journal of Human Genetics, (2007).
[15] R Development Core Team, “R: A Language and Environment for Statistical Computing”, R Foundation for Statistical Computing, Vienna, Austria, (2011).
[16] P. J. Bradbury, Z. Zhang, D. E. Kroon, T. M. Casstevens, Y. Ramdoss and E. S. Buckler, “TASSEL: software for association mapping of complex traits in diverse samples”, Bioinformatics (Oxford, England) vol. 23, pp. 2633-2635, (2007).
Authors
James W. Baurley is an Adjuct Professor and Bioinformatics Research Consultant in the Bioinformatics Research Group at Bina Nusartara University, Jakarta, Indonesia.
Anindito Subagyo is a faculty member of Information System Department at Bina Nusantara University, Jakarta, Indonesia.
Anzaludin S. Perbangsis a graduate student in Management Information System Graduate Program at Bina Nusantara University, Jakarta, Indonesia.