Genetic diversity and population structure of
Pisum
sativum
accessions for marker-trait association of
lipid content
Sajjad Ahmad
a, Simerjeet Kaur
a, Neil Dylan Lamb-Palmer
a,
Mark Lefsrud
b, Jaswinder Singh
a,⁎
aDepartment of Plant Science, McGill University, Ste Anne de Bellevue, Quebec H9X 3V9, Canada
bDepartment of Bioresource Engineering, McGill University, Ste Anne de Bellevue, Quebec H9X 3V9, Canada
A R T I C L E I N F O
A B S T R A C T
Article history:
Received 18 November 2014 Received in revised form 25 February 2015 Accepted 3 March 2015 Available online 11 April 2015
Field pea (Pisum sativumL.) is an important protein-rich pulse crop produced globally. Increasing the lipid content ofPisumseeds through conventional and contemporary molecular breeding tools may bring added value to the crop. However, knowledge about genetic diversity and lipid content in field pea is limited. An understanding of genetic diversity and population structure in diverse germplasm is important and a prerequisite for genetic dissection of complex characteristics and marker-trait associations. Fifty polymorphic microsatellite markers detecting a total of 207 alleles were used to obtain information on genetic diversity, population structure and marker-trait associations. Cluster analysis was performed using UPGMA to construct a dendrogram from a pairwise similarity matrix. Pea genotypes were divided into five major clusters. A model-based population structure analysis divided the pea accessions into four groups. Percentage lipid content in 35 diverse pea accessions was used to find potential associations with the SSR markers. Markers AD73, D21, and AA5 were significantly associated with lipid content using a mixed linear model (MLM) taking population structure (Q) and relative kinship (K) into account. The results of this preliminary study suggested that the population could be used for marker-trait association mapping studies.
© 2015 Crop Science Society of China and Institute of Crop Science, CAAS. Production and hosting by Elsevier B.V. This is an open access article under the CC BY-NC-ND license (http://creativecommons.org/licenses/by-nc-nd/4.0/).
Keywords:
Diversity Field Pea Lipid content
Marker-trait association Mixed linear model SSR
1. Introduction
Field pea (Pisum sativum L.) is a valuable cool-season pulse crop grown worldwide for its seed and soil fertility benefits[1]. Numerous improved pea cultivars have been developed with increased yield potential, modified maturity, lodging resis-tance (e.g. afila type) and increased nutritional value. Pea, being a leguminous crop, fixes its own nitrogen, and therefore could become an excellent candidate for bio-energy especially
in temperate regions. Various studies around the world are being conducted to find non-conventional feedstock for biodiesel. In Canada, canola oil is currently the major feedstock for biodiesel production. The cost is a major barrier to the development and economic survival of a canola biodiesel industry in Canada. Therefore, efforts are being made to develop alternative low cost and sustainable oilseed crops. Field pea is one of the promising crops for such alternatives. The potential development of pea as an oil
⁎ Corresponding author.
E-mail address:[email protected](J. Singh).
Peer review under responsibility of Crop Science Society of China and Institute of Crop Science, CAAS.
http://dx.doi.org/10.1016/j.cj.2015.03.005
2214-5141/© 2015 Crop Science Society of China and Institute of Crop Science, CAAS. Production and hosting by Elsevier B.V. This is an open access article under the CC BY-NC-ND license (http://creativecommons.org/licenses/by-nc-nd/4.0/).
A v a i l a b l e o n l i n e a t w w w . s c i e n c e d i r e c t . c o m
source for biodiesel is motivating for many reasons: 1) Canada is one of world's largest producers of pea. Therefore, no market penetration and promotion of the crop is needed. 2) Pea fixes nitrogen in the soil, thereby reducing the requirement for nitrogen fertilization. 3) Pea, as a feedstock for biodiesel, could open a new market for farmers. 4) From December 2010 the Renewable Fuels Regulations in Canada requires an average of 2% of diesel and heating oil to come from renewable feedstock. To date, there has been little research conducted to assess lipid content in peas, but preliminary data indicate that enough genetic diversity is available in field peas to identify appropriate genotypes for the biodiesel industry. The prospect of developing an oilseed pea has not been thoroughly investigated.
Analysis of lipids in vegetable samples is fairly intricate because of the high degree of complexity and heterogeneity of the components[2]. Previous studies reported percentage lipid contents ofPisumseeds ranging from 0.9% to 5.0%[3]. Compared to soybean and canola (14.0% and 41.0%, respectively) such low lipid contents would require effective breeding programs to develop field peas as a competitive oil source.
Market-driven intensive breeding for higher crop perfor-mance and increased crop uniformity often leads to unwanted loss of genetic diversity and genetic erosion[4]. In addition, self-pollinating crops such asP. sativumL. end up with increased homozygosity and increasing loss of genetic variation[5].
Generally, geneticists and plant breeders have emphasized the need for further improvement in capturing and harnessing genetic diversity [6]. Several methods are available to assess diversity in diverse genotypes. Examples include, allele mining, a sequence-based allelic mining technique that entails detection of variation in DNA sequences of diverse lines following PCR amplification of alleles. Another method to detect DNA sequence polymorphism is targeted induced local lesions in genomes (TILLING). However, these methods for capturing genetic diver-sity are expensive and time consuming. Alternatively, molecular markers can be used effectively to study genetic diversity in crops. Microsatellites, also known as simple sequence repeats (SSR), have been commonly used for assessing genetic diversity in peas due to their accuracy, reliability, co-dominance, repro-ducibility, and high polymorphism[7–10]. Genetic diversity and population structure of 164 pea accessions was determined using a combination of microsatellites, retrotransposons and morpho-logical markers[11]. A recent study reported a genetic map with the positions of 37 new markers identified by using a SNP set for genotyping a pea mapping population[12].
This study was planned to determine the population structure and preliminary marker trait associations in pea. We assessed the genetic diversity of 35 diverse pea genotypes using 100 SSR markers, 50 of which generated unambiguous and highly reproducible banding patterns. The same pea accessions were also used in a previous study[13]involving only fifteen SSR markers. In this study we increased the number of markers for further investigation of population structure and marker-trait association. Our results indicate that the accessions form five major clusters. These groups can be valuable to derive parental lines for pea breeding. Having determined the diversity of the 35 pea accessions and the informativeness of the SSR markers, we next looked to identify marker-trait associations that may further facilitate the process
of developing an oilseed pea. Lipid content estimations in the
Pisumseeds for its use in marker-trait associations were obtained from Khodapanahi et al. [3]. This study is among the first to perform marker-trait associations in field pea.
2. Materials and methods
2.1. Plant materials and DNA extraction
Pea (P. sativumL.) seeds were acquired from Plant Gene Resources of Canada (Saskatoon, SK) and the U.S. Department of Agriculture (Pullman, WA). Choice of the 35 diverse accessions (Table 1) was based on plant characteristics, such as cotyledon color, cotyledon shape (wrinkle or round), flower color, and country of origin. The accessions were grown in a greenhouse located at Macdonald Campus of McGill University, Ste-Anne-de-Bellevue, Quebec. The average day temperature was kept at about 20 °C with a 24 h average of 19 °C. DNA was extracted from each plant, selecting fresh, young leaves at the 8–10 leaf stage. A standard phenol:chloroform DNA extraction protocol with minor changes was used to isolate DNA from each pea accession. The tissues were homogenized using TissueLyser II (Qiagen, Toronto, ON) with natural extraction buffer and 10% sodium dodecyl sulfate (SDS) followed by incubation at 65 °C for 15 min [14]. Subse-quently, 200μL of 5 mol L−1 potassium acetate (KOAc) was
added, mixed and centrifuged at 14,000 r min−1for 5 min. The
supernatant was extracted with 450μL of 1:1 phenol:chloroform
and the DNA was precipitated with isopropanol and centrifuged for 5 min. The pellet was washed with 70% ethanol before dissolving in 65–70μL Tris EDTA buffer with RNaseA (TER). The
DNA quality and quantity was analyzed using a nanodrop spectrophotometer.
2.2. SSR primers for PCR
About 100 SSR primer pairs located on different pea linkage groups were assayed. These were selected from primers used by other workers [9]. Only 50 SSR loci (Table 2) showed polymorphism, therefore, used for subsequent analysis while, those amplifying ambiguous, unclear, and faint bands were not considered. PCR amplifications were con-ducted [15] in total volumes of 25μL comprising 1μL of
template DNA (25–35 ng), 0.4μmol L−1 each forward and
reverse primer and 5μL of 5 × CTaq-& LOAD Mastermix (MP
Biomedicals; 1.5μmol L−1 MgCl
2, 200μmol L−1 dNTP final
concentration). Amplifications were performed on a C1000 Thermocycler (Bio-Rad, Missisauga, ON) with the following profile: 95 °C initial denaturation for 2 min, followed by 36 cycles of 30 s at 95 °C, annealing at 50 °C for 45 s and 1 min at 72 °C. PCR products on 2% agarose gels stained with ethidium bromide (EtBr) in Tris Borate EDTA (TBE) buffer were analyzed under UV light. To determine the size of each amplified product a 1 kb DNA ladder (Invitrogen, USA) was used.
2.3. Marker analysis
and“0”for absence of each marker allele. Accessions failing to amplify a product were assigned a null allele at that locus and ignored when calculating Polymorphism Information Content (PIC)[16]and D (Discrimination power) scores[17]. The PIC value of each SSR marker was calculated according to the following formula:
PICj¼1
−
XI
i¼1
pi2
where,piis the frequency of theith allele of a givenjth SSR locus across all 35Pisum genotypes. For calculating D for each SSR marker the following formula was used[17]:
Dj¼1−
XI
i¼1
pi
Npi−1
ð Þ
N−1
whereNis the total number ofPisumaccessions andpi is the frequency of theith allele at a givenjth SSR locus. Frequencies of null alleles were not considered in calculating Dand PIC. For calculating genetic similarity (GSj) between a pair of pea
genotypes, Jaccards's Index[18]was used and cluster analysis, by means of a dendrogram, was conducted on the GSjestimates
using the UPGMA and Jaccards's index procedure in PAST software[19].
2.4. Population structure and relative kinship
Phenotypic parameters for accession traits were obtained from our recent study[3]. Population structure (Q) was calculated using STRUCTURE 2.3.4 [20]. SSR data from previous work were combined [10]. The analysis was run 5 times with k ranging from 1 to 10 using an admixture model with 100,000 burn ins and
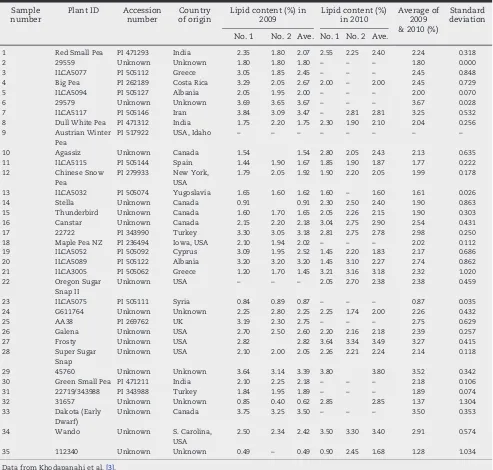
Table 1–Pisumgenotypes and their % lipid contents.
Sample number
Plant ID Accession number
Country of origin
Lipid content (%) in 2009
Lipid content (%) in 2010
Average of 2009 & 2010 (%)
Standard deviation
No. 1 No. 2 Ave. No. 1 No. 2 Ave.
1 Red Small Pea PI 471293 India 2.35 1.80 2.07 2.55 2.25 2.40 2.24 0.318
2 29559 Unknown Unknown 1.80 1.80 1.80 – – – 1.80 0.000
3 ILCA5077 PI 505112 Greece 3.05 1.85 2.45 – – – 2.45 0.848
4 Big Pea PI 262189 Costa Rica 3.29 2.05 2.67 2.00 – 2.00 2.45 0.729
5 ILCA5094 PI 505127 Albania 2.05 1.95 2.00 – – – 2.00 0.070
6 29579 Unknown Unknown 3.69 3.65 3.67 – – – 3.67 0.028
7 ILCA5117 PI 505146 Iran 3.84 3.09 3.47 – 2.81 2.81 3.25 0.532
8 Dull White Pea PI 471312 India 1.75 2.20 1.75 2.30 1.90 2.10 2.04 0.256
9 Austrian Winter
Pea
PI 517922 USA, Idaho – – – – – – – –
10 Agassiz Unknown Canada 1.54 1.54 2.80 2.05 2.43 2.13 0.635
11 ILCA5115 PI 505144 Spain 1.44 1.90 1.67 1.85 1.90 1.87 1.77 0.222
12 Chinese Snow
Pea
PI 279933 New York, USA
1.79 2.05 1.92 1.90 2.20 2.05 1.99 0.178
13 ILCA5032 PI 505074 Yugoslavia 1.65 1.60 1.62 1.60 – 1.60 1.61 0.026
14 Stella Unknown Canada 0.91 0.91 2.30 2.50 2.40 1.90 0.863
15 Thunderbird Unknown Canada 1.60 1.70 1.65 2.05 2.26 2.15 1.90 0.303
16 Canstar Unknown Canada 2.15 2.20 2.18 3.04 2.75 2.90 2.54 0.431
17 22722 PI 343990 Turkey 3.30 3.05 3.18 2.81 2.75 2.78 2.98 0.250
18 Maple Pea NZ PI 236494 Iowa, USA 2.10 1.94 2.02 – – – 2.02 0.112
19 ILCA5052 PI 505092 Cyprus 3.09 1.95 2.52 1.45 2.20 1.83 2.17 0.686
20 ILCA5089 PI 505122 Albania 3.20 3.20 3.20 1.45 3.10 2.27 2.74 0.862
21 ILCA3005 PI 505062 Greece 1.20 1.70 1.45 3.21 3.16 3.18 2.32 1.020
22 Oregon Sugar
Snap II
Unknown USA – – – 2.05 2.70 2.38 2.38 0.459
23 ILCA5075 PI 505111 Syria 0.84 0.89 0.87 – – – 0.87 0.035
24 G611764 Unknown Unknown 2.25 2.80 2.25 2.25 1.74 2.00 2.26 0.432
25 AA38 PI 269762 UK 3.19 2.30 2.75 – – – 2.75 0.629
26 Galena Unknown USA 2.70 2.50 2.60 2.20 2.16 2.18 2.39 0.257
27 Frosty Unknown USA 2.82 2.82 3.64 3.34 3.49 3.27 0.415
28 Super Sugar
Snap
Unknown USA 2.10 2.00 2.05 2.26 2.21 2.24 2.14 0.118
29 45760 Unknown Unknown 3.64 3.14 3.39 3.80 3.80 3.52 0.342
30 Green Small Pea PI 471211 India 2.10 2.25 2.18 – – – 2.18 0.106
31 22719/343988 PI 343988 Turkey 1.84 1.95 1.89 – – – 1.89 0.074
32 31657 Unknown Unknown 0.85 0.40 0.62 2.85 2.85 1.37 1.304
33 Dakota (Early
Dwarf)
Unknown Canada 3.75 3.25 3.50 – – – 3.50 0.353
34 Wando Unknown S. Carolina,
USA
2.50 2.34 2.42 3.50 3.30 3.40 2.91 0.574
35 112340 Unknown Unknown 0.49 – 0.49 0.90 2.45 1.68 1.28 1.034
100,000 Monte Carlo Markov Chain replicates. The optimalkwas found to be 4 using theΔkmethod as described[10]. Relative kinship (K) among samples was calculated with SPAGeDi software using the Loiselle coefficient[21].
2.5. Percentage lipid content
Data regarding lipid content from the 35 diverse pea acces-sions (Table 1) was obtained from our recent work[3]. The
lipid analysis was conducted for two subsequent years at one location. The pea accessions were grown in 2009 and 2010 at the Macdonald Campus field plots of McGill University., Ste Anne de Bellevue, Quebec, Canada. Seed samples were finely ground (2 g) and distributed into three test tubes. In each test tube 6 mL of solvent (hexane/isopropanol 3:2,v:v) was added and it was then centrifuged for 5 min at 3500 r min−1in a tube
rotor. The solvent layer was transferred into a second tube of known mass. The remaining pellet was washed twice with
Table 2–SSR markers across different chromosomes, their polymorphic information content (PIC), discrimination power (D), and number of alleles amplified in 35 pea accessions.
Marker Sequence (5′–3′) Linkage group PIC D Number of allele
AD73 F: cagctggattcaatcattggtg; R: atgagtaatccgacgatgcctt III 0.839 0.864 7
AA92 F: aaggtctgaagctgaacctgaagg; R: gcagcccacagaagtgcttcaa III 0.820 0.847 8
D21 F: tattctcctccaaaatttcctt; R: gtcaaaattagccaaattcctc II 0.793 0.816 7
A5 F: gtaaagcataaggggattctcat; R: cagcttttaactcatctgacaca II 0.787 0.810 5
AA372.1 F: gagtgaccaaagttttgtgaa; R: ccttgaacccatttttaagagt II 0.782 0.807 6
AB146 F: ggaaattggaaggagctatttgaag; R: gtgcataagcatttgattagatgacc V 0.781 0.806 5
AD148 F: gaaacatcattgtgtcttcttg; R: ttccatcacttgattgataaac II 0.776 0.806 5
D23 F: atggttgtcccaggatagataa; R: gaaaacattggagagtggagta II 0.771 0.795 6
AD270 F: ctcatctgatgcgttggattag; R: aggttggatttgttgtttgttg III 0.763 0.787 6
AD56 F: gaaacattggttgaagagcgag; R: gttgtcgcgtgaacacaagtaa VII 0.753 0.775 5
AA5 F: tgccaatcctgaggtattaacacc; R: catttttgcagttgcaatttcgt III 0.751 0.775 6
AA480 F: caattttatgctacacatactccct; R: tacagaagcatttgtgcagttgt II 0.746 0.770 5
AD146 F: tgctcaagtcaatatatgaaga; R: caagcaaatagttgttttgtta VII 0.735 0.754 5
AA491 F: gaggtggtgttgaatttgtg; R: cctaattttacccctctctctct III 0.733 0.755 5
AD61 F: ctcattcaatgatgataatccta; R: atgaggtacttgtgtgagataaa III 0.733 0.755 5
AB140 F: ccagattcatgaagggcataca; R: gatgaaatttcgtttctctctgtctc III 0.724 0.746 5
AA175¶ F: ttgaaggaacacaatcagcgac; R: tgcgcaccaaactaccataatc III 0.722 0.751 4
AD175 F: ttgaaggaacacaatcagc; R: tgcgcaccaaactaccataatc III 0.722 0.751 4
AA473 F: caatcgatcagacagtccccta; R: aagctcacctggttatgtccct II 0.720 0.745 4
AA122 F: gggtctgcataagtagaagcca; R: aaggtgtttcccctagacatca IV 0.715 0.736 4
AB40 F: aaatagacccttgtgtagaagc; R: ggaaaagtgggttttgaa II 0.705 0.726 5
PSGAPA1 F: gacattgttgccaataactgg;R: ggttctgttctcaatacaag V 0.697 0.718 4
AA335 F: acgcacacgcttagatagaaat; R: atccaccataagttttggcata VI 0.689 0.709 6
AA153 F: tttgatagtccgacttttccat; R: gtgacaaaagaattcaaaacgc II 0.674 0.695 4
AB72¶ F: atctcatgttcaacttgcaaccttta; R: ttcaaaacacgcaagttttctga II 0.660 0.679 3
AA121 F: tccataccttagtgttaaa; R: actaataaggtaaacatgtg I 0.655 0.689 3
AB53 F: cgtcgttgttgccggtag; R: aaacacgtcatctcgacctgc III 0.654 0.674 4
AB23 F: tcagcctttatcctccgaacta; R: gaacccttgtgcagaagcatta V 0.654 0.674 3
AD60 F: ctgaagcacttttgacaactac; R: atcatatagcgacgaatacacc VI 0.652 0.675 3
A9¶ F: gtgcagaagcatttgttcagat; R: cccacatatatttggttggtca IV 0.651 0.669 4
AA205¶ F: tacgcaatcatagagtttggaa; R: aatcaagtcaatgaaacaagca II 0.625 0.648 3
AD59 F: ttggagaatgtcttctctttag; R: gtatattttcactcagaggcac VI 0.622 0.643 6
AC58 F: tccgcaatttggtaacactg; R: cgtccatttcttttatgctgag V 0.614 0.632 3
AA238 F: tatcatcaaggtccaatttagt; R: agctaaatcgtacctaatctgt II 0.595 0.613 4
AC76a¶ F: cccaatccaataaataaagaaa; R: aatggttgttatgccatttt VI 0.594 0.612 3
AD83 F: cacatgagcgtgtgtatggtaa; R: gggataagaagagggagcaaat II 0.586 0.603 4
AA339 F: gtgtagaagtattttacttgatg; R: catctattgaaggaaaattat VII 0.563 0.580 5
AA446 F: ttagcttgcagcccactc; R: atccgacccatggattta VII 0.551 0.568 4
AB141 F: atcccaatactcccaccaatgtt; R: agacttaggcttcccttctacgactt III 0.545 0.561 4
AA285¶ F: tcgcctaatctagatgagaata; R: cttaacattttaggtcttggag IV 0.526 0.541 3
AA135 F: ccgttacacatcattaagatg; R: tccatatccagattagtcaga VII 0.521 0.536 4
AA67¶ F: cccatgtgaaattctcttgaaga; R: gcatttcacttgatgaaatttcg I 0.513 0.528 3
AA90¶ F: cccttaccatatttcgtttct; R: tgcgactccattctagtattg VII 0.486 0.501 3
AD147¶ F: agcccaagtttcttctgaatcc; R: aaattcgcagagcgtttgttac I 0.472 0.487 2
AC75¶ F: cgctcaccaaatgtagatgataa; R: tcatgcatcaatgaaagtgataaa I 0.408 0.420 2
AA103¶ F: aagtgtgaaagtttgccaggtc; R: cgggtacgggttatgttgtc VI 0.408 0.420 2
AD51¶ F: atgaagtaggcatagcgaagat; R: gattaaataaagttcgatggcg VI 0.336 0.350 3
AA175 F: ttgaaggaacacaatcagcgac; R: tgcgcaccaaactaccataatc III 0.312 0.322 3
AA163.2¶ F: tagtttccaattcaatcgacca; R: agtgtattgtaaatgcacaaggg V 0.245 0.257 2
AA206¶ F: ctgagaactcaacgctcagacg; R: cgagggtcgagttctgagattt VII 0.055 0.057 2
5 mL of fresh solvent. Each wash was followed by a transfer of the solvent into the solvent tube after a 30 s of vortexing and 5 min of centrifugation at 3500 rpm. The oil concentration was quantified by direct measurement of lipid left in the solvent tube after the solvent was evaporated under nitrogen stream at 60 °C for 3 h.
2.6. Marker-trait association
The mixed linear model [22]was used for the marker-trait association analysis. Genotypic microsatellite data analysis and phenotypic lipid content data [3] were combined with population structure and relative kinship data. The analysis was performed using TASSEL 3.0[23]. A significance threshold for association was set atP= 0.05.
3. Results
3.1. Microsatellites polymorphism
Polymorphic alleles identified in this study indicated consid-erable genetic diversity among the accessions. The number of alleles per locus ranged from 2 to 8, with amplification of a total of 207 alleles with a mean 4.2 alleles per locus. The maximum number of 8 alleles was observed for marker AA92 followed by 7 alleles for AD 73 and D21 (Table 2). PIC and
D-values for each marker revealed the informativeness of each marker in resolving the diversity among the accessions. Both PIC and D-values were highest for marker AD73 and lowest for AA206. The most informative loci were AD73 and AA92 with PIC values of 0.839 and 0.820, respectively, and a mean PIC value of 0.627. Similarly, the highestD-value of 0.864 was for marker AD73, followed by AA92 (0.847). Marker AA206 possessed the lowestDscore of 0.057, but the averageD-value was 0.647. The PIC values and D scores of most of the SSR markers showed sufficient polymorphism to discriminate all 35Pisumaccessions.
3.2. Genetic diversity and cluster analysis
A pairwise genetic similarity (GSj) matrix was calculated using
Jaccard's coefficient. GSjvalues ranged from 0 (between Maple
pea NZ and AA38) to 0.937 (between AA38 and G611764) with an average of 0.159. Maple Pea NZ-G611764 (0.016), ILCA 5077-Austrian Winter Pea (0.016), and ILCA 5089-ILCA 5117 (0.032) were among the lowest pairwise similarity values, whereas Canstar-Stella (0.522), Line45760-Frosty (0.489), and Stella-Agassiz (0.458) were the highest pairwise similarity values.
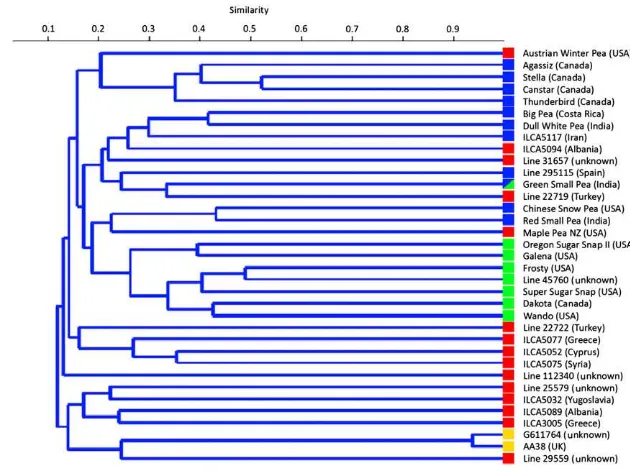
Cluster analysis was performed using UPGMA to construct a dendrogram from a pairwise similarity matrix (Fig. 1). Pea genotypes were divided into five major clusters as shown in
Fig. 1. The first main cluster (I) consists of five pea genotypes Austrian Winter Pea, Agaggiz, Stella, Canstar, and Thunder-bird, all from Canadian origin except Austrian Winter Pea (USA). Cluster II was found as cosmopolitan or an inconsistent group with 8 pea accessions originated in a variety of countries. This cluster comprises Big Pea (Costa Rica), Dull White Pea (India), ILCA 5117 (Iran), ILCA 5094 (Albania), Line
31657 (unknown), Line 295115 (Spain), Green Small Pea (India) and Line 22719 (Turkey). Ten genotypes were grouped in Cluster III mainly from USA with two cultivars Res Small Pea and Dakota from India and Canada respectively. Cluster IV and Cluster V consist of four and seven pea genotypes respectively mainly from European origin i.e. (Cluster IV: Line 22722, Turkey; ILCA 5077, Greece; ILCA 5052, Cyprus; ILCA 5075, Syria). Interestingly, Line 112340 with unknown country of origin is a solitary member from the second main group (assigning to a separate cluster was ignored). Cluster V comprises Line 25579 (unknown), ILCA 5032 (Yugoslavia), ILCA 5089 (Albania), ILCA3005 (Greece), G611764 (unknown), Line AA38 (UK), and Line 29559 (unknown).
3.3. Population structure and relative kinship
Four population structure groups (G1, G2, G3, G4) were identified (Fig. 2). G1 comprised 14 accessions, mainly from southern Europe (Greece, Turkey, Cyprus) but also included genotypes from the USA. G2 contained 8 lines exclusively from USA or of unknown origin. G3 contained 10 accessions mainly from North America (Canada, USA) but also included cultivars from India, Iran, Costa Rica, and Spain. G4 contained only 2 lines, G611764 (unknown) and AA38 (UK). These two lines had the highest genetic similarity as calculated by Jaccard's coefficient. Population structure grouping was com-pared with UPGMA clusters in Fig. 1. In terms of relative kinship estimation, over 70% of pairwise kinship values were between 0 and 0.05 signifying unrelatedness. The remaining estimates were above 0.1, indicative of various levels of relatedness.
3.4. Marker-trait associations
Preliminary studies were performed using only 50 SSR markers. A threshold of P= 0.05 was utilized to identify candidate marker-trait associations. A total of 35 combina-tions were assessed to identify associacombina-tions between SSR markers and lipid content using a mixed linear model. The magnitude of association was also examined by assessing the estimated effects of each allele on an associated trait. Markers AD73_7, AA5_3, D21_4, AA175_260 with P-values 0.0017, 0.0052, 0.0248, and 0.0302, respectively, were significantly associated with lipid content. However quantile–quantile (QQ) plots of these P-values were drawn to check for spurious associations. These markers showed evidence for association by deviating from the null expectations in QQ plot (Fig. S1).
4. Discussion
among 35 pea accessions. Although a larger population size would improve the precision the present set of accessions was the most diverse population available in regard to lipid content. Self-pollinating species such as pea are usually homozygous. All the present accessions were homozygous and presumably homogeneous, although an earlier study of wild pea accessions did report marker heterogeneity [9]. Cultivars of cross-pollinated species are more likely to be heterogeneous as noted in the case of rape-seed[28].
Microsatellite markers used in our investigation were multi-allelic, detecting an average of 4.80 alleles per locus based on 50 SSR loci. This is consistent with results obtained by others[29]where an average of 4.50 alleles per locus using 30 SSR markers in a population of 18 pea accessions was reported. A higher mean of 5.90 alleles per locus was detected among 20 pea cultivars and 57 wild pea accessions using 10 SSR markers[30]. However, Zong et al.[31]observed a slightly higher average number of 4.95 alleles per locus in 197 pea genotypes using 21 SSR markers. The average number of
alleles per locus found in the present study was similar to that found by Cupic et al.[29]; Zong et al.[31]suggesting a narrow genetic base of these pea accessions. However, Nasiri et al.
[30]detected a higher number of alleles per locus especially in wild pea genotypes thus making the average higher.
The level of polymorphism was mainly assessed by PIC and D-values of SSR markers. Marker AA121 was highly informative and had the maximum level of polymorphism with a highest PIC value of 0.887 and D-value of 0.901. A slightly lower level of polymorphism for AA121 (PIC 0.75) was detected by Loridon et al.[9]. In our study marker AA135 had PIC and D-values of 0.521 and 0.536, respectively, whereas Loridon et al.[9]reported a higher level of polymorphism (PIC 0.75) for this marker. Similarly, Nasiri et al. [30]observed a higher level of polymorphism for marker AF004843 with 8 alleles whereas others[8]reported only 4 alleles. Ahmad et al.
[13] analyzed the same group of accessions using 15 SSR markers and found much smaller PIC andD-values means of 0.460 and 0.475, respectively. In addition, the maximum
Fig. 1–Dendrogram of 35 pea accessions showing phylogenetic relationship based on the genetic similarity matrix data,
achieved by an unweighted pair group method of arithmetic averages (UPGMA) cluster analysis. Colored boxes indicate membership of population structure (Q) groups.
Fig. 2–Population structure (Q) modeled withk= 4 and no admixture. The 35 accessions were divided into groups G1 to G4
number of alleles detected by Ahmad et al.[13]again was low (i.e. 4 alleles). This indicates that the SSR markers used in the present study had a higher level of polymorphism that should facilitate the selection of informative markers for subsequent analysis of genetic variation in pea[9].
The 50 markers assessed in this study discriminated between all 35 accessions. Genetic similarity (GSj) scores
ranged from 0.075 to 0.875 with an average of 0.336. These values are lower than reported in previous SSR studies on pea
[32,33]illustrating the utility of these markers and germplasm for marker-assisted breeding.
GSjscores were used to assess the phylogenetic relationships
among the 35 cultivars (Fig. 1). Molecular-marker-based UPGMA cluster analysis revealed large genetic distance values indicating high diversity of marker genotypes. A normal distribution of genetic similarity values helped ensure a representative cluster analysis and dendrogram.
Pea is a widely traded grain crop and germplasm has been freely exchanged for several decades if not longer. The places where material was collected should not be taken to infer real geographic origin. However, cluster analysis classified pea genotypes into groups that were somewhat consistent with their geographical origins. For example, Cluster I was mainly dominated by Canadian accessions with one accession from the USA. Similarly, Cluster III comprised genotypes originat-ing in the USA with only two exceptions i.e. Red Small Pea from India and Dakota from Canada. Both Clusters IV and V were geographically consistent with genotypes mainly from European and west Asian origins. Cluster II was cosmopolitan genotypes from a range of origins. Members of this group might share a common parent or may have been introduced from other regions resulted from germplasm exchange programs among different countries or trades as previously mentioned. Semileafless (afila) leaf trait has been introduced in other varieties through germplasm exchange programs. Similarly, exchange of breeding material between China and Australia has been reported by Zong et al.[31]for broadening their respective pea breeding gene pools.
Unique gene pools can lay the foundation of genetic improvement and can be useful in future breeding pro-grams. Cluster analysis in this study classified pea geno-types into various groups facilitating a breeding program. Inter-introgression of pea accessions, for example, from groups of Canadian, European and/or the USA origin can be instrumental in widening the genetic base of breeding populations and increase genetic diversity for selection of future varieties. In common beans, For example it was predicted that the narrow genetic base of Andean gene pool of common beans could be improved by introduction of germ-plasm from the Meso-American gene pool [34]. Low genetic diversity, for example, between lines AA38 and G611764 found in present study necessitates the inclusion of exotic parental material in breeding programs for desirable allelic combina-tions. The use of exotic parents may broaden the genetic base and facilitate desirable genetic gain; a recently released soybean (Glysine maxL.) germplasm LG00-6313 in the United States was bred from a cross of two Chinese cultivars that were not in ancestry of any U.S. cultivar or germplasm.
Population structure models developed with STRUCTURE showed some convergence with the UPGMA cluster analysis
(Figs. 1 and 2). G1 contained every member of Cluster I except for Austrian Winter Pea, and half of the members of Cluster II. G2 covered the majority of Cluster III accessions. G3 consisted of every member of Cluster IV, a majority of Cluster V and included members of Clusters I and II. G4, consisting of AA38 and G611764, appears to identify a subgroup of Cluster V. The convergence of these groups lends additional confidence to associations identified using the Q model.
This study is among the first to perform association mapping in field pea and is the first to do so for lipid content. In a previous study by Jing et al.[35], 45 retrotransposon-based insertion polymorphism (RBIP) markers were used to analyze genetic diversity among 3020 pea accessions. They expanded their analysis by including 1518 additional germplasm sam-ples [36]. The genetic diversity analysis among 4538 acces-sions presented an overall structure of genetic diversity including novel genetic variation.
Marker association contains a high risk of false positives resulting from the existence of population structure or familial relatedness. It is therefore crucial to develop models that attempt to correct for these confounding relationships. In this investigation, we analyzed the struc-ture of the population and also found some preliminary results for marker trait-associations. We are enriching the density of molecular markers to further validate and extend the present association analysis.
5. Conclusions
In this study, we assessed 50 SSR markers that showed significant variability across 35 pea accessions. These poly-morphic markers may be combined in multiplex reactions and with other previously developed molecular tools for genotyping pea populations. We explored the population structure and UPGMA analysis discriminated four population groups. This suggests a potential use for these markers in association studies. Our association studies for lipid content will provide a base for further marker-trait association investigation. These and further markers will allow develop-ment of a robust system to be applied in diversity analysis, germplasm conservation, breeder's rights protection, and development of a new oilseed pea cultivar.
Acknowledgments
This work was supported by the Natural Sciences and Engineering Research Council of Canada Collaborative Research and Development and Lefsrud Seeds (CRDRJ385395-09). We acknowledge financial assistance from BioFuelNet for the marker-trait association work.
Supplementary material
Supplementary material to this article can be found online at
R E F E R E N C E S
[1] K. McPhee, Dry pea production and breeding: a mini review, J. Food Agric. Environ. 1 (2003) 64–69.
[2] M. Solis, A. Patel, V. Orsat, J. Singh, M. Lefsrud, Fatty acid profiling of the seed oils of some varieties of field peas (Pisum sativum) by RP–LC/ESI–MS/MS: towards the develop-ment of an oilseed pea, Food Chem. 139 (2013) 986–993.
[3] E. Khodapanahi, M. Lefsrud, V. Orsat, J. Singh, T.D. Warkentin, Study of pea accessions for development of an oilseed pea, Energies 5 (2012) 3788–3802.
[4] A. Baranger, G. Aubert, G. Arnau, A.L. Laine, G. Deniot, J. Potier, C. Weinachter, I. Lejeune-Henaut, J. Lallemand, J. Burstin, Genetic diversity withinPisum sativumusing protein- and PCR-based markers, Theor. Appl. Genet. 108 (2004) 1309–1321.
[5] J. Cieslarova, P. Smykal, Z. Dockalova, P. Hanacek, S. Prochazka, M. Hybl, M. Griga, Molecular evidence of genetic diversity changes in pea (Pisum sativumL.) germplasm after long-term maintenance, Genet. Resour. Crop. Evol. 58 (2011) 439–451.
[6] J.A. Able, P. Langridge, A.S. Milligan, Capturing diversity in the cereals: many options but little promiscuity, Trends Plant Sci. 12 (2007) 71–79.
[7] S.A. Becher, K. Steinmetz, K. Weising, S. Boury, D. Peltier, J.P. Renou, G. Kahl, K. Wolff, Microsatellites for cultivar identifi-cation in Pelargonium, Theor. Appl. Genet. 101 (2000) 643–651.
[8] J. Burstin, G. Deniot, J. Potier, C. Weinachter, G. Aubert, A. Baranger, Microsatellite polymorphism inPisum sativum, Plant Breed. 120 (2001) 311–317.
[9] K. Loridon, K. McPhee, J. Morin, P. Dubreuil, M.L. Pilet-Nayel, G. Aubert, C. Rameau, A. Baranger, C. Coyne, I. Lejeune-Henaut, J. Burstin, Microsatellite marker polymorphism and mapping in pea (Pisum sativumL), Theor. Appl. Genet. 111 (2005) 1022–1031.
[10] G. Sarikamis, R. Yanmaz, S. Ermis, M. Bakir, C. Yuksel, Genetic characterization of pea (Pisum sativum) germplasm from Turkey using morphological and SSR markers, Genet. Mol. Res. 9 (2010) 591–600.
[11] P. Smýkal, M. Hýbl, J. Corander, J. Jarkovský, A.J. Flavell, M. Griga, Genetic diversity and population structure of pea (Pisum sativumL.) varieties derived from combined retrotransposon, microsatellite and morphological marker analysis, Theor. Appl. Genet. 117 (2008) 413–424.
[12] C. Deulvot, H. Charrel, A. Marty, F. Jacquin, C. Donnadieu, I. Lejeune-Hénaut, J. Burstin, G. Aubert, Highly-multiplexed SNP genotyping for genetic mapping and germplasm diversity studies in pea, BMC Genomics 11 (2010) 468.
[13] S. Ahmad, M. Singh, Lamb-Palmer N. Dylan, M. Lefsrud, J. Singh, Assessment of genetic diversity in 35Pisum sativum
accessions using microsatellite markers, Can. J. Plant Sci. 92 (2012) 1075–1781.
[14] H.Q. Tan, J. Singh, High-efficiency thermal asymmetric interlaced (HE-TAIL) PCR for amplification ofDstransposon insertion sites in barley, Plant Mol. Biol. Biotechnol. 2 (2011) 9–14.
[15] M. Singh, J. Singh, Seed development related expression of ARGONAUTE 4_9 class of genes in barley: possible role in seed dormancy, Euphytica 188 (2012) 123–129.
[16] J. Anderson, G. Churchill, J. Autrique, S. Tanksley, M. Sorrells, Optimizing parental selection for genetic linkage maps, Genome 36 (1993) 181–186.
[17] C. Tessier, J. David, P. This, J.-M. Boursiquot, A. Charrier, Optimization of the choice of molecular markers for varietal identification in Vitis vinifera L, Theor. Appl. Genet. 98 (1999) 171–177.
[18] R. Real, J.M. Vargas, The probabilistic basis of Jaccard's index of similarity, Syst. Biol. 45 (1996) 380–385.
[19] Ø. Hammer, D.A.T. Harper, P.D. Ryan, PAST-PAlaeontological STatistics,http://www.uv.es/~pardomv/pe/2001_1/past/ pastprog/past.pdf, May 21, 2001.
[20] J.K. Pritchard, M. Stephens, P. Donnelly, Inference of population structure using multilocus genotype data, Genetics 155 (2000) 945–959.
[21] O.J. Hardy, X. Vekemans, SPAGeDi: a versitile computer program to analyse spatial genetic structure at the individual or population levels, Mol. Ecol. Notes 2 (2002) 618–620.
[22] Z. Zhang, E. Ersoz, C.-Q. Lai, R.J. Todhunter, H.K. Tiwari, M.A. Gore, P.J. Bradbury, J. Yu, D.K. Arnett, J.M. Ordovas, Mixed linear model approach adapted for genome-wide association studies, Nat. Genet. 42 (2010) 355–360.
[23] P.J. Bradbury, Z. Zhang, D.E. Kroon, T.M. Casstevens, Y. Ramdoss, E.S. Buckler, TASSEL: software for association mapping of complex traits in diverse samples, Bioinformatics 23 (2007) 2633–2635.
[24] J.R. Russell, J.D. Fuller, M. Macaulay, B.G. Hatz, A. Jahoor, W. Powell, R. Waugh, Direct comparison of levels of genetic variation among barley accessions detected by RFLPs, AFLPs, SSRs and RAPDs, Theor. Appl. Genet. 95 (1997) 714–722.
[25] I. Pejic, P. Ajmone-Marsan, M. Morgante, V. Kozumplick, P. Castiglioni, G. Taramino, M.S. Motto, Comparative analysis of genetic similarity among maize inbred lines detected by RFLPs, RAPDs, SSRs, and AFLPs, Theor. Appl. Genet. 97 (1998) 1248–1255.
[26] M. Bohn, H.F. Utz, A.E. Melchinger, Genetic similarities among winter wheat cultivars determined on the basis of RFLPs, AFLPs, and SSRs and their use for predicting progeny variance, Crop Sci. 39 (1999) 228–237.
[27] S. Temnykh, W.D. Park, N. Ayres, S. Cartinhour, N. Hauck, L. Lipovich, Y.G. Cho, T. Ishii, S.R. McCouch, Mapping and genome organization of microsatellite sequences in rice (Oryza sativaL.), Theor. Appl. Genet. 100 (2000) 697–712.
[28] K. Pascher, S. Macalka, D. Rau, G. Gollmann, H. Reiner, J. Glossl, G. Grabherr, Molecular differentiation of commercial varieties and feral populations of oilseed rape (Brassica napusL.), BMC Evol. Biol. 10 (2010) 63.
[29] T. Cupic, M. Tucak, S. Popovic, S. Bolaric, S. Grljusic, V. Kozumplik, Genetic diversity of pea (Pisum sativumL.) genotypes assessed by pedigree, morphological and molecular data, J. Food Agric. Environ. 7 (2009) 343–348.
[30] J. Nasiri, A. Haghnazari, J. Saba, Genetic diversity among varieties and wild species accessions of pea (Pisum sativumL.) based on SSR markers, Afr. J. Biotechnol. 8 (2009) 3405–3417.
[31] X. Zong, R.J. Redden, Q. Liu, S. Wang, J. Guan, J. Liu, Y. Xu, X. Liu, J. Gu, L. Yan, P. Ades, R. Ford, Analysis of a diverse global
Pisumsp. collection and comparison to a Chinese localP sativumcollection with microsatellite markers, Theor. Appl. Genet. 118 (2009) 193–204.
[32] B. Tar'an, C. Zhang, T. Warkentin, A. Tullu, A. Vandenberg Genetic, diversity among varieties and wild species accessions of pea (Pisum sativumL.) based on molecular markers, and morphological and physiological characters, Genome 48 (2005) 257–272.
[33] P.R. Choudhury, H. Tanveer, G.P. Dixit, Identification and detection of genetic relatedness among important varieties of pea (Pisum sativumL.) grown in India, Genetica 130 (2007) 183–191.
[34] F.M.A. Islam, S. Beebe, M. Munoz, J. Tohme, R.J. Redden, K.E. Basford, Using molecular markers to assess the effect of introgression on quantitative attributes of common bean in the Andean gene pool, Theor. Appl. Genet. 108 (2004) 243–252.
[35] R. Jing, A. Vershinin, J. Grzebyta, P. Shaw, P. Smýkal, D. Marshall, M. Ambrose, T.N. Ellis, A. Flavell, The genetic diversity and evolution of field pea (Pisum) studied by high throughput retrotransposon based insertion polymorphism (RBIP) marker analysis, BMC Evol. Biol. 10 (2010) 44.