Contents lists available atScienceDirect
Applied Ergonomics
journal homepage:www.elsevier.com/locate/apergo
The relative impact of smartwatch and smartphone use while driving on workload, attention, and driving performance
David Perlman
a, Aubrey Samost
a, August G. Domel
b, Bruce Mehler
c,∗, Jonathan Dobres
c, Bryan Reimer
caMIT Engineering Systems Division, United States
bHarvard University– School of Engineering and Applied Sciences, United States
cMIT AgeLab and New England University Transportation Center, United States
A R T I C L E I N F O
Keywords:
Attention Workload
Detection response task (DRT) Distraction
Age
A B S T R A C T
The impact of using a smartwatch to initiate phone calls on driver workload, attention, and performance was compared to smartphone visual-manual (VM) and auditory-vocal (AV) interfaces. In a driving simulator, 36 participants placed calls using each method. While task time and number of glances were greater for AV calling on the smartwatch vs. smartphone, remote detection task (R-DRT) responsiveness, mean single glance duration, percentage of long duration off-road glances, total off-road glance time, and percent time looking off-road were similar; the later metrics were all significantly higher for the VM interface vs. AV methods. Heart rate and skin conductance were higher during phone calling tasks than“just driving”, but did not consistently differentiate calling method. Participants exhibited more erratic driving behavior (lane position and major steering wheel reversals) for smartphone VM calling compared to both AV methods. Workload ratings were lower for AV calling on both devices vs. VM calling.
1. Introduction
The ubiquitous use of smartphones has exploded in recent years, and so too has interest in companion devices that expand on their capabilities. A new genre of personal electronic device has emerged that brings many of the smartphone's core functions to its owner's wrist.
Smartwatches, long limited to fictional secret agents, now offer smartphone owners easy access to notifications, navigation instruc- tions, and voice input for placing phone calls, text messaging, and in- ternet searches. Though convenience is a key selling point, it may also represent a significant concern for driving safety advocates. Drivers already tempted to interact with their smartphone will now have the ability to do so directly from their wrist.
A growing body of research has investigated the inherent demands of smartphone use while driving (e.g., Basacik et al., 2012; Munger et al., 2014;Reimer et al., 2016b;Ranney et al., 2011), but more lim- ited work exists looking at the driving safety concerns associated with wearable devices. Beckers et al. (2017) found that participants in a driving simulation experiment showed similar response times but a higher miss rate to a detection response task (DRT) while entering an address into a navigation application using Google Glass's voice
recognition function compared to voice entry on a smartphone; con- versely, task completion time was shorter with Glass.Sawyer et al.
(2014)andHe et al. (2015)found that viewing and responding to text messages while driving using Google Glass was moderately less dis- tracting than using a smartphone, but did not entirely eliminate cog- nitive distractions. Looking more specifically at smartwatches,Giang et al. (2014)reported initialfindings on a small sample of drivers' use of a smartwatch to read notifications, finding that drivers were quicker to glance at notifications displayed on the smartwatch and viewed the notification for a longer period of time, compared to reading the same notifications on a smartphone.Giang et al. (2015)also found that dri- vers viewing notifications on a smartwatch, as opposed to a smart- phone, took longer to respond to external stimuli such as braking events ahead, yet they perceived similar levels of risk in using the two devices while driving. A follow-on paper (Giang et al., 2017), provides an in- tegrated presentation and extended discussion of both smartwatch studies.
Authorities in the United States, Canada, and the United Kingdom have warned drivers over the use of smartwatches, but concede that their laws, as written, do not clearly prohibit smartwatch use while driving (Wiggers, 2014; The Canadian Press, 2014; BBC, 2014). Yet
https://doi.org/10.1016/j.apergo.2018.09.001
Received 9 June 2017; Received in revised form 23 August 2018; Accepted 5 September 2018
∗Corresponding author.
E-mail addresses:[email protected](D. Perlman),[email protected](A. Samost),[email protected](A.G. Domel), [email protected](B. Mehler),[email protected](J. Dobres),[email protected](B. Reimer).
0003-6870/ © 2018 Elsevier Ltd. All rights reserved.
T
concerns are growing, even prompting a lawsuit against smartwatch manufacturers seeking for them to lead a $1 billion safety campaign (seeDave, 2015). Moreover, Deborah Hersman, President and CEO of the nonprofit National Safety Council and former chair of the National Transportation Safety Board, publically commented that“Smartwatches will be just as distracting, if not more so, than cell phones,” continuing that,“I think it's going to be an even higher hurdle to get people to take their watches off” (seeLangfield, 2015). Given the recent availability of smartwatches that not only offer notifications, but also voice and touchscreen-based inputs for key functions, it seems necessary to ex- amine the potential for increased demand posed by the use of a smartwatch as an interactive interface and examine the validity of these concerns.
In light of the likelihood of increased smartwatch use during driving, a study was undertaken to investigate and extend upon the limited literature regarding the potential for smartwatch use to impact driver workload, attention, and performance. While Giang and collea- gues (Giang et al., 2014, 2017) studied participants' responding to notifications on a smartwatch, the present study considered the demand associated with a different task, placing a phone call using a voice- based interface, which, in concept, should minimize the amount of secondary task visual demand placed on the driver. Since engaging in any secondary task is likely to increase overall demand on a driver, the demand of the smartwatch interface was assessed along with both au- ditory-vocal and visual-manual based methods of placing the same calls directly on a smartphone. This supports consideration of the smart- watch interface relative to other interfaces that a driver might use as well as to“just driving”. In a fixed-base driving simulator, self-report ratings of workload, physiological arousal, eye glance behavior, re- sponses to a detection response task (DRT), and driving performance characteristics of participants were examined during“just driving” and when driving and placing phone calls using each of the three interfaces.
In addition, the study was designed to consider a somewhat broader sample of participants; the larger of the two studies by Giang and col- leagues (Giang et al., 2017) was limited to a sample of twelve males, all in their 20's.
2. Methods 2.1. Participants
Participants were recruited from the greater Boston area and were experienced drivers (holding a driver's license for more than three years and driving at least once per week), between the ages of 20 and 29 or 55 and 69, and physically and mentally healthy based on self-report. Of the 43 participants consented, seven were excluded from the analysis due to experimental interruptions, technical issues, or voluntary with- drawals for factors such as symptoms of simulator sickness. The 36 participants considered in the final results are equally balanced by gender and age group. The study was approved by MIT's institutional review board.
2.2. Apparatus
The study employed the MIT AgeLab's medium-fidelity driving si- mulator built around the full cab of a 2001 Volkswagen New Beetle. At the time, it was configured as a fixed-base simulator employing an STISIM Drive version 2.08.02 (System Technology, Inc.) simulation environment projected on a 2.44m by 1.83m screen mounted in front of the vehicle cab. Steering, throttle, and brake inputs used the original steering wheel and pedals. Previous work demonstrated strong corre- spondence between behaviors observed in this simulator andfield data (Wang et al., 2010;Reimer and Mehler, 2011).
A CogLens unit (http://coglens.com) was employed to support a remote detection-response task (R-DRT). The setup consisted of a red light-emitting diode (LED) mounted on the windshield in the direct line
of sight of the forward roadway and followed ISO standard (ISO 17488, 2016) with the exception that a foot switch mounted on the vehicle's left foot rest was implemented in place of a finger switch. The foot activated response was used since afinger configuration would have interfered with participants' interactions with the smartwatch. During experimental periods involving the R-DRT, the LED stimulus was acti- vated at random intervals of between three andfive seconds. Previous studies have validated the use of R-DRTs using a foot pedal to detect differences in cognitive task difficulty in miss percentage and reaction time (Bruyas and Dumont, 2013;Angell et al., 2002).
Heart rate and skin conductance were collected as physiological indicators of workload (Mehler et al., 2012a;Solovey et al., 2014) using a MEDAC System/3 unit (NeuroDyne Medical Corporation). For elec- trocardiogram (EKG) recordings, the skin was cleaned with isopropyl alcohol and disposable electrodes (Vermed A10005) were applied in a modified lead II configuration that located the negative lead just under the right clavicle, the ground just under the left clavicle, and the po- sitive lead over the lowest left rib. Skin conductance level was mea- sured using a constant current configuration and non-polarizing, low- impedance gold-plated electrodes. The electrodes were placed on the underside of the ring and middlefinger of the left hand (participants were instructed to only use their right hand to interact with the mobile devices). Data sampling was carried out at a rate of 250 Hz to provide sufficient resolution for detecting the EKG R-wave to calculate heart rate.
The study tested a Motorola Moto 360 smartwatch, which was paired with a Motorola Droid RAZR M smartphone. The Motorola Moto 360 was released in September 2014 and runs Google's Android Wear operating system on a 1.56 inch circular display. The watch is designed to interact with a smartphone via Bluetooth. The Droid RAZR M fea- tures a 4.3 inch display and was equipped with Android 4.4,“Kit-Kat.”
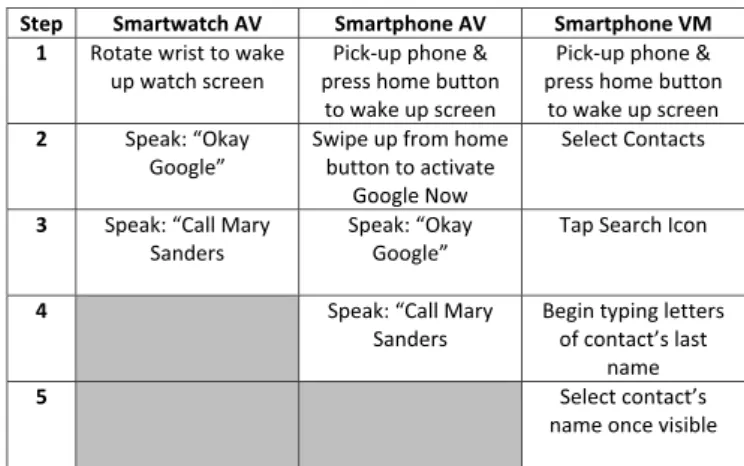
The smartphone was configured to automatically activate the speak- erphone option when a call was placed, allowing the researchers to hear when the task had been completed correctly. All calls were routed to a Google Voice mailbox which then instructed the participant to hang up the call. Participants made calls using two methods, visual-manual (VM) and auditory-vocal (AV). As we have noted previously, most AV interfaces encountered in the driving context, whether mobile or em- bedded in the vehicle, involve some degree of visual-manual interaction in addition to the voice and auditory components and are in actuality perhaps best characterized as mixed-mode interfaces (Reimer et al., 2016a); the term AV is used in this paper to refer to the voice-involved interfaces in-line with common usage and for ease of distinguishing from the primary visual-manual based interfaces.Fig. 1illustrates the calling procedures for each method included in the study.
Fig. 1. Sequential steps (reading downward) for placing a phone call using each of the three interfaces.
2.3. Procedure
Participant eligibility was confirmed in an interview, and informed consent obtained. Physiological sensors were attached, after which participants were seated in the driving simulator and introduced to R- DRT task while stationary (i.e. not driving). Training on the DRT task continued until the ability to respond to 8 out of 8 stimuli during a stationary test trial was demonstrated. A brief (2 mile) familiarization drive followed that gradually ramped-up from a standstill to low-speed to highway speed (50 mph posted) to introduce participants to the si- mulator. The core of the protocol was structured as three blocks, one for training and evaluation of each interface: auditory-vocal based calling with the smartwatch (AV watch), visual-manual calling with the smartphone (VM phone), and auditory-vocal based calling with the smartphone (AV phone). Block order was randomized and counter- balanced across the gender and age groups to control for order effects.
The simulation environment during training and evaluation drives consisted of a divided highway with two lanes of travel in each direc- tion. The posted speed limit was 50 mph.
Each interface block was subdivided into training and evaluation sections (Fig. 2). Initial training (1) consisted of a researcher talking a participant through how to place calls while sitting stationary in the simulator and responding to questions until the participant indicated they were comfortable proceeding. Subsequent training steps were prompted by recorded audio to familiarize participants with how prompts would be presented during the evaluation portion. Participants practiced placing calls while driving (2), and then task complexity was increased by adding the detection response task (3). Once a participant could drive, complete the phone call, and respond to 70% of the R-DRT lights, they then moved to the evaluation portion. The evaluation portion of each block began (4) with three minutes of driving without other tasks. The last 60 s of this interval was used as a baseline driving reference period. Participants then moved to thefirst of four contact calling trials (5). The first two calling trials involved identifying a contact simply by name and next two involved identifying a target for a contact having multiple phone numbers (e.g. mobile, work). Specifi- cally, the four task targets in order were: Mary Sanders, Carol Harris, Pat Griffin (mobile), Frank Scott (work). The same four contact targets were used with each interface. Between calling trials (6), participants were instructed to put the phone down wherever they felt most com- fortable (but within easy reach) and just drive for 30 s. This was fol- lowed by (7) one minute of driving and responding to the DRT light (as a control period for considering the extent to which responding to the DRT impacted driving performance relative to placing a call while re- sponding to the DRT). They again had a 30 s buffer (8) of just driving before placing the next call. At the end of each block (9), participants rated their workload using a global workload scale (see next section).
After the three blocks were finished, participants completed post-
experiment questionnaires. The entire experiment, including intake, training, evaluation, and debriefing, lasted approximately 2.5 to three hours per participant.
2.4. Incentives and key instructions
One critique of simulation is the concern that participants will re- spond differently in balancing the demands of driving and engaging in secondary tasks in an experimental setting than they will in the real world unless there is some level of perceived risk or cost associated with lack of attention to driving (Reimer et al., 2006). Following now stan- dard procedures employed in the lab, participants were informed that in addition to a base compensation ($50), they could earn an additional incentive (up to $10) for engaging in the secondary tasks but might be penalized for disregarding the traffic code, losing money for tickets (driving either too fast or too far below the speed limit) or collisions.
They were advised specifically to “Take your time driving, maintain the posted speed limits, and follow any traffic control signs or signals. At all times please stay in your lane.” After completing the familiarization drive, participants were instructed“While performance on the tasks is important, you should consider driving safety while you attempt to complete the tasks, just as you would when driving a real car. Yourfirst priority should always be safe driving, followed by accuracy in com- pleting a task.” At the completion of the study, all participants were compensated the full $60 regardless of actual behavior.
2.5. Variables, data reduction and analysis
Data was collected on variables corresponding to three areas of interest: workload, distraction, and driving performance. Subjective workload ratings were obtained after each of the three interface blocks.
Participants were asked to rate their overall workload while placing calls on a single scale ranging from 0 (low) to 10 (high) using a visual analog format following instructions and a procedure that has been found to produce ratings with high correspondence to global workload ratings obtained with the NASA TLX (seeMehler et al., 2016). For data collected during calling task trials, for each participant, within each interface block, values across each of the four individual calling trials were averaged together. Mean heart rate and skin conductance level were utilized as objective physiological indicators of relative workload as perMehler et al. (2016). Individual differences in base physiological values can be quite large, particularly for skin conductance. Conse- quently, both raw values and normalized values based on percent change scores for the each of the phone contact calling conditions re- lative to DRT plus driving control condition are reported. Unless otherwise stated, statistical test results are reported based on raw va- lues. In instances where the two methods of handling the data impacted whether a statistically significant effect was found, test values for both methods are given. As relative metrics of secondary task related driver distraction, reaction times and percentage of missed responses on the R- DRT as well as a number of glance measures were calculated. Eye glance measures were quantified based on manual coding of video following ISO standards (ISO 15007-1, 2002;ISO 15007-2, 2001) with glance time to a region of interest defined to include the transition time to that object. In line with this standard, glance timing was labeled from thefirst video frame illustrating movement to a “new” location of in- terest to the last video frame prior to movement to a“new” location.
Each task period of interest was independently glance coded by two evaluators based on a frame by frame analysis. Discrepancies between the evaluators (the identification of conflicting glance targets, missed glances, or glance timings that differed by more than 200 ms) were mediated by a third researcher (SeeMehler et al., 2016for additional background on glance coding methods and open source software used.).
When comparing DRT metrics for each of the calling methods against
“just driving”, mean DRT values were averaged across all twelve of the driving plus DRT control periods. Several indicators of driving Fig. 2. Procedure within each interface block (AV watch; VM phone; AV
phone).
performance were evaluated: standard deviation of lateral lane posi- tion, mean speed, standard deviation of speed, and major steering wheel reversals (defined as a change in steering input greater than 3°
following the European Union AIDE project Östlund et al., 2005). In instances where assessments of driving metrics consider “baseline driving” (driving without DRT or a phone task), mean driving perfor- mance values were averaged across the three“baseline driving” periods (one per block). Primary statistical tests for this within subject design are repeated measures analyses of variance and post-hoc tests represent paired t-tests carried out using the R statistical package (R Core Team, 2014). Tests for any main effects or interaction associated with age group were run independently.
3. Results
The following sections present results from the 36 participants, equally balanced by age group and gender, considered in thefinal da- taset. The younger sample ranged in age from 21 to 29 years (M = 25.3, SD = 2.5) and the older sample from 55 to 69 years (M = 62.0, SD = 4.1). Successful task completion rates were 86.4% for smartwatch AV calling, 97.1% for smartphone AV calling, and 92.9% for smart- phone VM calling, where success is defined as a participant being able to place the call without assistance. None of the participants experi- enced a crash event (e.g. collision with another virtual vehicle or leaving the roadway).
Descriptive statistics (mean and standard error) for each of the methods of placing a call are presented for the primary variables in Table 1along with the results of paired t-tests comparing each of the calling methods. Except for task completion time and number of off- road glances, the smartwatch and smartphone interfaces tested did not differ on any of the variables considered. Significant differences did appear between the two voice interfaces and the visual-manual smart- phone interface, most notably in global workload ratings, lateral ve- hicle control metrics, DRT metrics, and most glance measures. The following sections consider variables individually. Note: In addition to
figures provided in the main body of the results section, supplemental figures are provided in the Appendix.
3.1. Self-rated workload
Mean global workload ratings for each method of placing a call are presented inTable 1. A repeated measures analysis of variance reveals a significant main effect of calling method (F(2,68) = 19.94, p < 0.001).
Post-hoc t-tests show that, on average, workload ratings did not differ significantly between the smartwatch and smartphone AV calling methods (p = 0.951), while the workload for VM contact calling on the smartphone was rated significantly higher (both p < 0.001). No main effect of age group (F(1,33) = 0.85, p = 0.363) or significant interac- tion with method appeared (F(2,66) = 2.62, p = 0.080).
3.2. Task completion time
A repeated measures analysis of variance comparing the mean time required to complete a calling task across the three methods of placing a call (Table 1) reveals a significant main effect of method (F (2,70) = 3.81, p = 0.027). Post-hoc t-tests show that, across the sample as a whole, the smartphone AV method took less time to complete than using either the smartwatch AV (p = 0.017) or the smartphone VM method (p = 0.004); task completion time did not differ significantly between the smartwatch AV and smartphone VM methods (p = 0.788).
A main effect of age (F(1,34) = 16.96, p < 0.001) and an interac- tion between age group and method (F(2,68) = 3.43, p = 0.038) was present. On average, older participants took longer to complete calls than younger participants across calling methods (mean values for smartwatch AV = 56.7 vs. 44.4s, smartphone AV = 45.7 vs. 36.3s, smartphone VM = 62.9 vs. 35.8s, respectively). A major component of the interaction appears to be characterized by older participants, on average, showing the biggest differential relative to younger partici- pants in manipulation of the VM interface. At the same time, the overall difference in task time between the AV and VM modes on the
Table 1
Summary of dependent variables per destination entry method [mean (standard error)]. The last three columns show t-values and significance levels for pair-wise post-hoc comparisons indicated as follows:* (p < 0.05),** (p < 0.01),*** (p < 0.001). Degrees of freedom = 35 unless otherwise indicated.
Dependent variable Smartwatch
Voice (WV)
Smartphone Voice (PV)
Smartphone Manual (PM)
WV -PV
WV -PM
PV -PM
Global workload 5.43 (0.42) 5.46 (0.36) 7.81 (0.27) −0.062 −4.730∗∗∗ 7.341∗∗∗
Task completion time (s)a 50.58 (3.38) 41.02 (2.30) 49.34 (3.81) 2.497∗ 0.271 3.122∗∗
Driving Behavior
Speed (km/hr)a 72.22 (0.84) 71.96 (0.77) 72.46 (0.77) 0.422 −0.347 0.763
SD speed (km/hr) 2.40 (0.30) 2.27 (0.23) 2.40 (0.28) 0.439 −0.004 0.505
SD lateral lane position (m) 0.211 (0.01) 0.208 (0.01) 0.268 (0.01) 0.281 −3.754∗ 5.564∗∗
Major SWR per minutea 0.55 (0.15) 0.52 (0.18) 1.72 (0.39) 0.172 −3.013∗∗ 4.124∗∗∗
DRT (df = 33) 674.81 (27.18) 668.25 (26.57) 752.67 (38.71) 0.177 −2.246∗ 2.638∗
Reaction time (ms)a
Miss percent. (%)a 9.71 (1.50) 8.84 (1.99) 14.80 (2.33) 0.348 −2.246∗ 2.935∗
Off-road glances (df = 33)
Number of glances 13.61 (1.45) 10.89 (0.88) 16.82 (1.08) 2.050∗ −1.872 5.719∗∗∗
Mean single glance (s)a 0.71 (0.02) 0.74 (0.02) 1.05 (0.04) −1.362 −9.450∗∗∗ 11.316∗∗∗
% of glances > 2s 0.49 (0.26) 0.94 (0.27) 9.12 (1.24) −0.071 −6.369∗∗∗ 6.820∗∗∗
Total glance time (s)a 10.17 (1.27) 8.21 (0.75) 17.72 (1.28) 1.559 −4.405∗∗∗ 8.012∗∗∗
% time off-road 18.63 (1.45) 19.96 (1.59) 37.75 (1.70) −0.958 −9.785∗∗∗ 11.975∗∗∗
Longest single glance (s) 1.23 (0.07) 1.33 (0.06) 2.37 (0.10) −1.296 −11.010∗∗∗ 11.384∗∗∗
Physiological metrics
Heart rate (BPM) 79.04 (1.98) 79.07 (1.81) 79.32 (1.93) −0.045 −0.335 0.322
Heart rate % change from“just drive” 4.26 (0.94) 5.21 (1.18) 5.71 (1.04) – – –
Skin conductance (microseimens)a(df = 30) 11.46 (0.89) 11.18 (0.89) 12.05 (1.04) 0.930 −1.267 2.326∗
Skin conductance % change from“just drive” (df = 30) 10.23 (1.49) 5.66 (3.35) 19.30 (5.59) – – –
a Variables for which age group effects were present. See details in text concerning individual metrics.
smartphone was driven by older participants (p < 0.001), whereas those in the younger group showed similar temporal behavior in com- pleting calls on the smartphone using the AV and VM methods (p = 0.809).
3.3. Driving performance
Driving performance metrics are considered across driving plus engaging with the DRT, and while driving, engaging with the DRT and with each of the contact phone calling tasks. Mean speed across the four conditions showed little variation, ranging from 44.7 to 45.2 mph (72.0–72.7 kph) (F(3,105) = 0.45, p = 0.719). Mean values for long- itudinal speed control (standard deviation of speed) were nominally higher during each of the calling periods (1.4–1.5 mph; 2.3 to 2.4 kph) vs. the DRT only condition (1.2 mph; 1.9 kph); however, no overall main effect appears (F(3,105) = 1.96, p = 0.124), and post-hoc tests show no significant differences between the three phone contact calling methods.
Significant main effects do appear for standard deviation of lateral lane position (Fig. 3; F(3,105) = 14.14, p < 0.001). Post-hoc t-test results indicate that VM calling on the smartwatch was associated with a significantly greater standard deviation of lane position relative to the DRT only condition (p < 0.001), the smartwatch (p = 0.001), and the AV smartphone interface (p < 0.001) methods of placing a call. Stan- dard deviation of lane position values did not differ significantly be- tween the smartwatch and smartphone AV interfaces (p = 0.781).
Similarly, significant main effects appear for major steering wheel reversal rate (Fig. 4; (F(3,105) = 10.91, p < 0.001). Post-hoc testing found that smartphone VM calling had a higher rate of major steering wheel reversals relative to both AV calling methods (p < 0.001 for smartphone AV and p = 0.005 for smartwatch AV). Major steering wheel reversal rate values did not differ significantly between the smartwatch and smartphone AV interfaces (p = 0.864). Major steering wheel reversal rates were slightly greater during the smartwatch calling tasks than during the DRT only driving condition (p = 0.028), but not were not significantly different for the smartphone AV calling method (p = 0.136).
Considering data across the three calling methods, no main effect of age appeared for any of the driving behavior metrics: speed (F (1,34) = 1.28, p = 0.266), SD of speed (F(1,34) = 1.28, p = 0.266), SD lateral lane position (F(1,34) = 0.11, p = 0.737), major steering wheel reversal rate (F(1,34) = 3.86, p = 0.058). However, in the case of major steering wheel reversal rate, for which a main effect of calling method was observed in the larger model as reported above, an inter- action between age group and calling method was observed (F (2,68) = 4.10, p = 0.021). An examination of mean values char- acterizes this interaction. While group means for the older and younger samples were identical for placing calls using the smartwatch AV in- terface (both 0.55), some divergence was observed when placing calls using the smartphone AV interface in which the older participant group showed a higher reversal rate relative to the smartwatch (0.79) and the younger participant group showed a lower rate relative to the smart- watch (0.24). The major reversal rate was highest for both groups when engaging with the smartphone VM interface, with the mean value for the older group being notably higher (2.54 older vs. 0.91 younger).
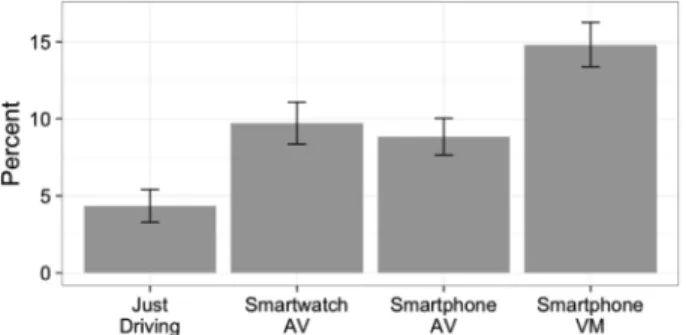
3.4. Remote detection response task (R-DRT)
Fig. 5depicts the mean percentage of R-DRT responses missed by participants when driving and engaging with each calling method and for the control period, during which participants were instructed to just drive and respond to the DRT. A significant main effect appears (F (3,99) = 8.00, p < 0.001) and post-hoc t-tests reveal that smartwatch AV (p = 0.004), smartphone AV (p = 0.019), and smartphone VM (p < 0.001) calling all resulted in higher DRT miss percentages than when driving and not placing a call. They also reveal a higher DRT miss percentage for smartphone VM calling than for AV calling on either the smartphone (p = 0.006) or smartwatch (p = 0.043); the two voice in- terfaces were not significantly different (p = 0.730).
A significant main effect also appears for DRT reaction time (F(3, 99) = 37.30, p < 0.001) (Fig. 6) and, similar to DRT miss percentage, post-hoc t-tests show that reaction times were shorter during just driving than when initiating a phone call (p < 0.001 for all methods).
Post-hoc testing shows that smartphone VM calling resulted in longer reaction times than both smartphone AV calling (p = 0.013) and smartwatch AV calling (p = 0.031); there was no statistical difference in reaction times between the smartwatch AV and smartphone AV calling methods (p = 0.908).
Considering data across the three calling methods, a main effect of age appeared for DRT miss percentage (F(1,32) = 6.10, p = 0.019) and reaction time (F(1,32) = 14.82, p = 0.001); no significant interaction between age group and calling method was present (F(2,64) = 1.44, p = 0.224; F(2,64) = 2.10, p = 0.130). On average, older participants took longer to respond to the DRT stimulus and missed a higher per- centage of stimuli than younger participants. Mean response times for the older vs. younger groups were: smartwatch AV = 733.95 vs.
618.97 ms, smartphone AV = 744.14 vs. 600.78 ms, smartphone VM = 878.41 vs. 640.91 ms, respectively. Mean miss percentages for the older vs. younger groups were: smartwatch AV = 11.3 vs. 8.2%, Fig. 3. Standard deviation of lateral lane position during“just driving” without
R-DRT (baseline), with (DRT) and during phone contact calling tasks.
Fig. 4. Major steering wheel reversals per minute during“just driving” without
R-DRT (baseline), with (DRT) and during calling tasks. Fig. 5. R-DRT miss rate (as a percentage).
smartphone AV = 12.5 vs. 5.6%, smartphone VM = 20.5 vs. 9.8%, re- spectively.
3.5. Off-road glance behavior
Glance behavior was assessed both in terms of glances off-the-for- ward-roadway (National Highway Transportation Safety Administration (NHTSA), 2013) and glances specifically to the device (s) under study (Driver Focus-Telematics Working Group, 2006). Both approaches yielded similar patterns and thus only the glances off-the- forward-roadway characterization are reported. Significant main effects of calling method were observed across all off-road glance metrics considered, including number of glances (F(2, 66) = 9.52, p < 0.001), mean single glance duration (F(2, 66) = 85.77, p < 0.001), percentage of glances longer than 2 s (F(2, 66) = 50.41, p < 0.001), total off-road glance time (F(2, 66) = 25.96, p < 0.001), and percent time glancing off-road during the task (F(2, 66) = 86.09, p < 0.001). Post-hoc t-tests show that when placing calls using the VM method on the smartphone, on average, the mean single glance duration was longer, the percentage of longer duration glances was greater, total eyes off road time was longer, and the percentage of time looking off-road while engaged in the task was greater (all p < 0.001) (seeFigs. 7 and 8) than for AV smartwatch and smartphone interfaces; the two AV methods were not significantly different on these metrics. The only significant difference between the smartwatch and AV calling on the smartphone was a somewhat higher number of glances to the smartwatch (13.6 vs. 10.9, respectively; p = 0.048); the mean number of glances when engaging with the VM interface of the smartphone was 16.8.
Finally, the longest duration individual glance per participant per task was determined. The mean duration of the longest individual glance was 1.23s for the smartwatch, 1.33s for the AV smartphone in- terface, and 2.37s for the VM smartphone interface. The difference between the VM interface was statistically significant for both AV methods (p < 0.001); the difference between the two AV methods was not statistically significant (p = 0.182).
No statistically significant main effect of age group or interaction with method appeared for number of off-road glances (F(1,32) = 2.84, p = 0.102; F(2,64) = 2.89, p = 0.063), percentage of long duration off-
road glances (F(1,32) = 0.12, p = 0.728; F(2,64) = 0.32, p = 0.730), percentage of time glancing off-road (F(1,32) = 0.16, p = 0.689; F (2,64) = 0.85, p = 0.431), or longest duration of an individual glance per participant (F(1,32) = 1.88, p = 0.180; F(2,64) = 0.27, p = 0.764).
There was a main effect of age on mean single glance duration (F (1,32) = 8.78, p = 0.006), with participants in the older group, on average, showing higher values for each method (mean values for smartwatch AV = 0.74 vs. 0.68s, smartphone AV = 0.78 vs. 0.70s, smartphone VM = 1.15 vs. 0.95s, respectively); no statistically sig- nificant interaction was present (F(2,64) = 2.91, p = 0.062). There was a main effect of age on total off-road glance time (F(1,32) = 10.24, p = 0.003), with participants in the older group, on average, showing higher values for each method (mean values for smartwatch AV = 7.89 vs. 6.98s, smartphone AV = 6.48 vs. 5.97s, smartphone VM = 20.93 vs.
10.34s, respectively). A significant age group by method interaction was present for total off-road glance time (F(2,64) = 7.94, p = 0.001);
this is most apparent in total off-road glance time engaging with the VM smartphone interface being, on average, approximately twice as long for the older participants whereas the age differential for the two AV interfaces was markedly less.
3.6. Physiological measures
A significant main effect was observed for heart rate when the ag- gregate values for driving plus doing the DRT (but not making a call) and the calling conditions for each of the three interface types are in- cluded in the model (F(3,105) = 13.07, p < 0.001). Mean heart rate values increased, on average, approximately 3.5–3.8 beats per minute (or 4.3–5.7%) during the three phone contact calling conditions relative to the driving plus DRT reference condition (Table 1). Post-hoc tests show that the increase in heart rate for each of the phone contact calling conditions relative to the DRT reference condition to be statis- tically significant (all p < 0.001). While heart rate was nominally the highest when using the VM smartphone interface, differences in heart rate across the three phone contact methods were not statistically sig- nificant (F(2,70) = 0.08, p = 0.922). In other words, while heart rate increased significantly during the calling tasks relative to driving and doing the DRT alone, the increase in heart rate was not significantly different across the three methods of placing a phone call.
A significant main effect was also observed for skin conductance level when driving plus doing the DRT (but not making a call) and the calling conditions for the three interface types in the model (F (3,105) = 6.06, p = 0.001). Skin conductance values increased, on average, approximately 0.47–1.34 μS (or 5.7–19.3%) during the three phone contact calling conditions relative to the driving plus DRT only reference condition (Table 1). Post-hoc tests show that the increase in skin conductance for each of the phone contact calling conditions to be statistically significant (p = 0.021 to p < 0.001). As with heart rate, skin conductance values were nominally the highest for the smartphone VM interface. A model considering just the three phone contact calling conditions using raw skin conductance values approaches, but does not show a statistically significant main effect of calling method (F Fig. 6. R-DRT reaction time.
Fig. 7. Mean single off-road glance duration.
Fig. 8. Total eyes-off-road time (TEORT).
(2,60) = 2.65, p = 0.079); considered as percent change scores (as in Fig. 5), a main effect of method does reach statistical significance (F (2,60) = 3.50, p = 0.036). Post-hoc tests based on percent change scores approach statistical significance for the AV vs. VM interface comparisons (smartphone AV vs. smartphone VM p = 0.055; smart- watch AV vs. smartphone VM p = 0.091), they do not meet the p < 0.05 criterion; the difference for smartwatch VM vs. smartphone AV p = 0.134) was also non-significant. Thus, as with heart rate, while skin conductance increased significantly during the calling tasks re- lative to just driving, the nominally greater increase for the VM calling method was not definitively demonstrated.
In comparing the physiological arousal associated with the three calling methods, no main effect of age group (F(1,34) = 1.66, p = 0.207) or significant interaction with method appeared for heart rate (F(2,68) = 0.54, p = 0.587). As observed elsewhere (Mehler et al., 2012a,b), older participants tended to have lower raw skin conductance values than younger participants (F(1,29) = 16.11, p < 0.001) which can be attributed to physiological changes associated with aging. When these differences in base physiology are normalized by considering percentage change values relative to“just driving”, no main effect of age (F(1,29) = 2.0, p = 0.168) or interaction with calling method ap- pear for skin conductance (F(1,58) = 0.51, p = 0.601).
4. Discussion
The results of this study suggest several concerns relating both generally to the use of electronic devices while driving as well as spe- cifically to the use of a smartwatch. Consistent with previous research, participants showed more off-road direction of visual attention when interacting with a phone versus just driving. Average DRT miss per- centages were almost three times as high during calling tasks than during the control“just drive” periods (11.2 ± 17.7% during calling periods versus 4.0 ± 11.2% during control periods). The difference in DRT reaction times between placing a call and just driving periods were also greater at 0.70 ± 0.23 s compared to 0.45 ± 0.12 s, respectively.
To the extent that these behaviors are representative of real-world driving situations, these results suggest potential areas of concern for increased risk exposure. In this simulation experiment, the use of a remote DRT light located on the windshield in the direct line of sight of the forward roadway was meant to serve as a surrogate for relevant stimulus changes in the driving environment, such as brake lights on a leading vehicle. The observed miss-rates suggest that drivers engaged in a calling task on their phone, regardless of input method, might fail to notice the onset of the brake light of a slowing vehicle ahead twice as often as when they are otherwise unoccupied and paying attention to events in the driving environment. Moreover, even when participants did notice the stimulus light when they were placing a phone call, across the sample they took, on average, almost twice as long to re- spond. Both results suggest the potential for a higher risk of a rear-end collision for drivers who are placing calls.
In terms of comparisons between the three calling methods, the results clearly indicate that VM calling on the smartphone can entail higher workload (e.g. self-report and R-DRT performance), draw more off-road visual orientation, and degrade driving performance more than AV calling on either the smartphone or the smartwatch. Comparing the two voice-based phone contact calling methods, using the smartwatch interface took, on average, approximately nine and half seconds (23%) longer to complete, almost three (25%) more off-road glances, and had a somewhat lower successful completion rate (86.4 vs. 97.1%) than the smartphone voice interface. On the other hand, no statistically sig- nificant differences were observed between the two AV interfaces in terms of self-reported workload, driving performance metrics, R-DRT metrics, or other off-road glance metrics including TEORT and mean single glance duration. Upon inquiry, it was found that none of the participants tested had used a smartwatch prior to participating in the study, but the majority owned a smartphone and were at least familiar
with the use of voice calling on the device. Therefore, it is reasonable to suspect that, as smartwatches achieve wider adoption, a participant pool more familiar with the devices might produce somewhat different results, i.e. potentially further reducing or removing the modest dif- ferences observed.
An interesting methodological consideration related to the use of the DRT is suggested inFig. 3, where a reduction is observed in the standard deviation of lane position between the baseline driving period when no DRT was present and the DRT control period when partici- pants were asked to attend to the windshield mounted R-DRT, but otherwise had no other task beyond driving. This demonstrates a change in a driving performance metric due to the presence of the R- DRT task. It is not necessarily surprising that the R-DRT encourages an orientation toward the forward roadway and thus results in a more stable lateral positioning, but it does suggest that it should be kept in mind that engaging in a DRT does fundamentally alter some aspects of the behavior under study. Despite this interestingfinding, there was still a significantly higher standard deviation of lane position when using VM calling relative to either AV calling methodology, suggesting a decrement in driving performance when utilizing a VM calling method despite the straightening impact of the R-DRT itself. This con- clusion is further supported by the higher rate of steering wheel re- versals during VM calling, suggesting perhaps a sudden realization on the part of the driver that lane position is off and thus resulting in making more drastic maneuvers to correct for it. Likely this stems from the fact that driving and VM calling pull from the same visual-manual resources, thereby decrementingfine control of the vehicle.
The different workload metrics also show an interesting pattern.
Subjective ratings showed significantly higher perceived workload when using VM calling compared to either AV calling method; this is consistent withBeckers et al. (2017). While mean heart rate and skin conductance values were, on average, nominally higher during VM calling, this study showed largely non-statistically significant differ- ences in physiologic measures between the three calling methods, also consistent withBeckers et al. (2017). Skin conductance and heart rate have been shown to be sensitive to increased cognitive workload during driving (Mehler et al., 2012a), and both metrics showed increased arousal during the calling tasks versus just driving. In evaluating the individual calling methods, it is important to keep in mind that phy- siologic metrics reflect total effort, both physical and mental engage- ment, and not just the demands associated with the external task of interest. In this study, participants were motivated to engage fully with the tasks by a previously validated methodology, so it is not likely that participants simply disengaged from tasks perceived to be harder. It is possible that participants may attempt to modulate moment-to-moment workload by spreading secondary task load over a longer time period or otherwise compensating for the perceived demand to keep experienced load at a more personally acceptable level (Mehler et al., 2012b). In this experimental design, participants could, and frequently did (based on subjective observation), pause or otherwise extend the time to complete the calling task in response to the demand of the primary driving task that they were simultaneously performing. Also, a portion of the effort that would normally have been applied to the primary task of driving may have been diverted during what was perceived to be the higher demands of working with the VM interface. The increased standard deviation of lateral lane position and more frequent major steering wheel reversals during the VM phone calling trials may be a result of such a shift in effort from the primary task to the secondary task. The ability to extend task duration and to shift effort to balance workload may have contributed to the limited physiologic differentiation of the three tasks.
Prior work on smartwatches during driving and similar studies of other devices are typically limited to a relatively young, healthy po- pulation, often drawn from undergraduate and sometimes graduate students. A community based and gender balanced sample that in- cluded both younger (21–29) and older (55–69) participants was
recruited for this study primarily to obtain a broader sampling of the population, as well as to support an initial examination of any differ- ences during interaction with the devices that might emerge across the generational range. Older participants generally had a prolonged R- DRT reaction time compared to younger participants. Interestingly, older participants had a larger relative difference between AV and VM calling in terms of R-DRT reaction times. In general, both younger and older participants were slower at VM calling than AV calling, but the difference was much larger for the older participants. This could be related to slower physical reflexes or decreased tactile sensation or flexibility in the finger joints. Another field of research suggests that older adults show a decrement in cognitive control, which impacts carrying out simultaneous tasks (Anguera et al., 2013). Interestingly, thisfinding also held when looking at major steering wheel reversals, which were relatively much higher in the older group when engaged in VM calling versus either of the AV methods. This is consistent with prior research that found specifically that older drivers struggle more when they are performing a task drawing from the same resources that are needed to drive safely. Prior research has often observed that older participants tend to slow their vehicle to allow for better performance on a secondary task (Horberry et al., 2006). However, differences be- tween age groups in driving speed were not seen in this sample.
4.1. Limitations
It should be noted that thefindings reported here are limited to the Android- and Android Wear-based devices tested, as well as to their application in initiating phone calls. Other devices (e.g., Apple Watch and Apple iPhone) may produce different results, and it should be re- cognized that relatively good performance on a task such as voice-based phone contact selection does not necessarily equate with equal per- formance on a different task such destination address entry (e.g.Mehler et al., 2017;Reimer et al., 2016a,b) which may involve greater demand and be associated with higher error rates. It is also apparent in the exploratory consideration of age that the impact of making a phone call while driving and the magnitude of the observed differences between the different methods of placing a call to a stored contact were gen- erally larger for the participants between 55 and 69 vs. those in their early 20s. The extent to which individuals in more intermediate age ranges would look more like the younger or the older sample employed here is unknown. However, it does certainly suggest caution in extra- polating performance too broadly to the general population on the basis of samples drawn solely from individuals in their early 20s.
5. Conclusion
The results of this study clearly suggest that voice command-based calling methods are preferable to primary visual-manual calling for the interfaces tested, reinforcing thefindings of a number of comparative studies by members of our group and others (e.g.Beckers et al., 2017;
Mehler et al., 2016; Reimer et al., 2016a,b; Simmons et al., 2017).
Specifically, the findings that AV interfaces are generally associated with lower off-road visual demand, lower self-reported workload rat- ings, and better R-DRT response than when engaging in comparable tasks using a primary VM interface. Interestingly, some possible ad- vantages were observed for the voice-based smartphone interface over the voice-based smartwatch interface (e.g., a shorter task completion time, fewer off-road glances, and a higher successful call completion rate), although these need to be interpreted cautiously given the re- lative novelty of the smartwatch interface for the participants. More- over, significant differences were not seen between the two voice-based interfaces on self-reported workload, R-DRT responsiveness, driving performance, and most off-road glance metrics. It is important to keep in mind that while these data again highlight the finding that voice- based interfaces frequently offer advantages in terms of lower visual demand than primary visual-manual interface alternatives, they are not
a priori visual demand free. For example, the smartwatch interface which, in theory, could be utilized without any glances off-road, was associated with a mean TEORT of 10 s per call. Thus, thesefindings do not obviate the caution that any diversion of attention from the primary task of driving is potentially risky, as shown by the consistent decre- ment in R-DRT responsiveness across devices and calling methods when compared to‘just driving’.
Acknowledgements
Support for this research was provided by the U.S. Department of Transportation's Region One New England University Transportation Center and the Toyota Class Action Settlement Safety Research and Education Program. The views and conclusions being expressed are those of the authors, and have not been sponsored, approved, or en- dorsed by Toyota or plaintiffs' class counsel. Furthermore, we gratefully acknowledge the contributions of Alea Mehler and Thomas McWilliams. This work significantly expands upon a more limited da- taset presented at the 59th Annual Meeting of the Human Factors and Ergonomics Society (Samost et al., 2015).
Appendix A. Supplementary data
Supplementary data related to this article can be found athttps://
doi.org/10.1016/j.apergo.2018.09.001.
References
Angell, L.S., Young, R.A., Hankey, J.M., Dingus, T.A., 2002. An Evaluation of Alternative Methods for Assessing Driver Workload in the Early Development of In-vehicle Information Systems. Technical Paper 2002-01-1981. SAE International.
Anguera, J.A., Boccanfuso, J., Rintoul, J.L., Al-Hashimi, O., Faraji, F., Janowich, J., Kong, E., Larraburo, Y., Rolle, C., Johnston, E., Gazzaley, A., 2013. Video game training enhances cognitive control in older adults. Nature 501 (7465), 97–101.
Basacik, D., Reed, N., Robbins, R., 2012. Smartphone Use while Driving: a Simulator Study. (Report No. PPR592). Transport Research Laboratory, Berkshire, UK.
BBC, 2014, September 17. Drivers Warned over Smartwatch Use in Cars. Retrieved December 19, 2014, from BBC News. http://www.bbc.com/news/technology- 29238264.
Beckers, N., Schreiner, S., Bertrand, P., Mehler, B., Reimer, B., 2017. Comparing the demands of destination entry using Google Glass and the Samsung Galaxy S4 during simulated driving. Appl. Ergon. 58, 25–34.https://doi.org/10.1016/j.apergo.2016.
05.005.
Bruyas, M.-P., Dumont, L., 2013. Sensitivity of Detection Response Task (DRT) to the driving demand and task difficulty. In: Proceedings of the Seventh International Driving Symposium on Human Factors in Driver Assessment, Training, and Vehicle Design. University of Iowa, Iowa City, pp. 64–70.
Dave, P., 2015, April 21. Are Smartwatches Dangerous? Lawyer Wants $1 Billion Campaign to Warn Drivers. Retrieved January 31, 2016 from the Los Angeles Times.
http://www.latimes.com/business/la-fi-apple-driving-suit-20150421-story.html.
Driver Focus-Telematics Working Group, 2006. Statement of Principles, Criteria, and Verification Procedures on Driver-interactions with Advanced In-vehicle Information and Communication Systems. Alliance of Automobile Manufacturers,
Washington, DC.
Giang, W.C., Chen, H.Y.W., Donmez, B., 2017. Smartwatches vs. smartphones: notifica- tion engagement while driving. Int. J. Mobile Hum. Comput. Interact. 9 (2), 39–57.
Giang, W.C., Shanti, I., Chen, H.W., Zhou, A., Donmez, B., 2015. Smartwatches vs.
Smartphones: a preliminary report of driver behavior and perceived risk while re- sponding to notifications. In: Proceedings Of the 7thInternational Conference On Automotive User Interfaces And Interactive Vehicular Applications, pp. 154–161.
Giang, W.C., Hoekstra-Atwood, L., Donmez, B., 2014. Driver engagement in notifications:
a comparison of visual-manual interaction between smartwatches and smartphones.
Proc. Hum. Factors Ergon. Soc. Annu. Meet. 58 (1), 2161–2165.
He, J., Choi, W., McCarley, J.S., Chaparro, B.S., Wang, C., 2015. Texting while driving using Google Glass: promising but not distraction-free. Accid. Anal. Prev. 81, 218–229.
Horberry, T., Anderson, J., Regan, M.A., Triggs, T.J., Brown, J., 2006. Driver distraction:
the effects of concurrent in-vehicle tasks, road environment complexity and age on driving performance. Accid. Anal. Prev. 38 (1), 185–191.
ISO 15007-1, 2002. Road Vehicles - Measurement of Driver Visual Behaviour with Respect to Transport Information and Control Systems - Part 1: Definitions and Parameters. International Standards Organization, Geneva, Switzerland.
ISO 15007-2, 2001. Road Vehicles - Measurement of Driver Visual Behaviour with Respect to Transport Information and Control Systems - Part 2: Equipment and Procedures. International Standards Organization, Geneva, Switzerland.
ISO 17488, 2016. Road Vehicles - Transport Information and Control Systems - Detection- response Task (DRT) for Assessing Attentional Effects of Cognitive Load in Driving.
International Organization for Standardization, Geneva, Switzerland.
Langfield, A., 2015, May 21. Will Smartwatches Lure Drivers to More Distractions?
Retrieved January 31, 2016 from CBS News. http://www.cbsnews.com/news/
smartwatch-tap-may-lure-drivers-to-more-distractions/.
Mehler, B., Kidd, D., Reimer, B., Reagan, I., Dobres, J., McCartt, A., 2016. Multi-modal assessment of on-road demand of voice and manual phone calling and voice navi- gation entry across two embedded vehicle systems. Ergonomics 59 (3), 344–367.
https://doi.org/10.1080/00140139.2015.1081412.
Mehler, B., Reimer, B., Coughlin, J.F., 2012a. Sensitivity of physiological measures for detecting systematic variations in cognitive demand from a working memory task: an on-road study across three age groups. Hum. Factors 54 (3), 396–412.
Mehler, B., Reimer, B., Lee, C., Kidd, D., Reagan, I., 2017, June. Considering self-report in the interpretation of objective performance data in the comparison of HMI systems.
In: Proceedings Of the 9thInternational Driving Symposium On Human Factors In Driver Assessment, Training, and Vehicle Design, June 27-29, Manchester Village, Vermont, USA.
Mehler, B., Reimer, B., Zec, M., 2012b. Defining workload in the context of driver state detection and HMI evaluation. In: Proceedings Of the 4thInternational Conference On Automotive User Interfaces And Interactive Vehicular Applications. AutoUI 2012), Portsmouth, NH, pp. 187–191.https://doi.org/10.1145/2390256.2390288.October 17-19, 2012.
Munger, D., Mehler, B., Reimer, B., Dobres, J., Pettinato, A., Pugh, B., et al., 2014. A simulation study examining smartphone destination entry while driving. In:
Proceedings of the 6th International Conference on Automotive User Interfaces and Interactive Vehicular Applications. Association for Computing Machinery, New York, pp. 1–5.
National Highway Traffic Safety Administration, 2013. Visual-manual NHTSA Driver Distraction Guidelines for In-vehicle Electronic Devices (Docket No. NHTSA-2010- 0053). U.S. Department of Transportation National Highway Traffic Safety Administration (NHTSA), Washington, DC 2013.
Östlund, J., Peters, B., Thorslund, B., Engström, J., Markkula, G., Keinath, A., Horst, D., Juch, S., Mattes, S., Foehl, U., 2005. Driving Performance Assessment-methods and Metrics. AIDE report under contract IST-1-507674-IP. http://www.aide-eu.org/pdf/
sp2_deliv_new/aide_d2_2_5.pdf.
R Core Team, 2014. R: a Language and Environment for Statistical Computing. R Foundation for Statistical Computing, Vienna, Austria.
Ranney, T.A., Baldwin, G.S., Parmer, E., Martin, J., Elizabeth, M.N., 2011. Distraction Effects of Manual Number and Text Entry while Driving. National Highway Traffic
Safety Administration, Washington: USDOT.
Reimer, B., Angell, L., Strayer, D., Tijerina, L., Mehler, B., 2016a. Evaluating demands associated with the use of voice-based in-vehicle interfaces. In: Proceedings Of the Human Factors And Ergonomics Society Annual Meeting, Washington D.C, pp.
2083–2087. September 19-23, 2016. https://doi.org/10.1177/1541931213601472.
Reimer, B., Mehler, B., 2011. The impact of cognitive workload on physiological arousal in young adult drivers: afield study and simulation validation. Ergonomics 54 (10), 932–942.
Reimer, B., D'Ambrosio, L.A., Coughlin, J.A., Kafrissen, M.E., Biederman, J., 2006. Using self-reported data to assess the validity of driving simulation data. Behav. Res. Meth.
38 (2), 314–324.
Reimer, B., Mehler, B., Reagan, I., Kidd, D., Dobres, J., 2016b. Multi-modal demands of a smartphone used to place calls and enter addresses during highway driving relative to two embedded systems. Ergonomics 59 (12), 1565–1585.https://doi.org/10.1080/
00140139.2016.1154189.
Samost, A., Perlman, D., Domel, A.G., Reimer, B., Mehler, B., Mehler, A., Dobres, J., McWilliams, T., 2015. Comparing the relative impact of smartwatch and smartphone use while driving on workload, attention, and driving performance. In: Proceedings of the Annual Meeting of the Human Factors and Ergonomics Society, Los Angeles, CA, October 26-30, 2015, pp. 1602–1606.
Sawyer, B.D., Finomore, V.S., Calvo, A.A., Hancock, P., 2014. Google Glass: a driver distraction cause or cure? Hum. Factors 56 (7), 1307–1321.
Simmons, S.M., Caird, J.K., Steel, P., 2017. A meta-analysis of in-vehicle and nomadic voice-recognition system interaction and driving performance. Accid. Anal. Prev.
106, 31–43.
Solovey, E.T., Zec, M., Perez, E.A., Reimer, B., Mehler, B., 2014. Classifying driver workload using physiological and driving performance data: twofield studies. In:
Proceedings of the 32nd Annual ACM Conference on Human Factors in Computing Systems. ACM Press, New York, pp. 4057–4066.
The Canadian Press, 2014, September 17. Do Distracted Driving Laws Cover Smartwatches? Retrieved December 19, 2014, from CBC News.http://www.cbc.ca/
news/canada/toronto/do-distracted-driving-laws-cover-smartwatches-1.2769209.
Wang, Y., Mehler, B., Reimer, B., Lammers, V., D'Ambrosio, L.A., Coughlin, J.F., 2010.
The validity of driving simulation for assessing differences between in-vehicle in- formational interfaces: a comparison withfield testing. Ergonomics 53 (3), 404–420.
Wiggers, K., 2014, December 16. Incredulous Cop Cites Man for Using His Smartwatch while Driving. Retrieved December 19, 2014, from Digital Trends. http://www.
digitaltrends.com/mobile/incredulous-cop-cites-man-using-smartwatch-driving/.