Research Journal of Pharmaceutical, Biological and Chemical
Sciences
The Effect of Turmeric Extract (
Curcuma Domestica
Val.) on the
Pharmacokinetic Profile of Paracetamol in Male White Wistar Rats.
Ahmad Muhtadi
1*, Mufki Ardi Wibowo
2, Aliya Nur Hasanah
2, Muchtaridi Muchtaridi
2, and
Ida Musfiroh
2*.
1
Department of Pharmacology and Clinical Pharmacy, Faculty of Pharmacy, University Padjadjaran, Indonesia.
2
Department of Pharmaceutical Analysis and Medicinal Chemistry, Faculty of Pharmacy, University Padjadjaran, Indonesia.
ABSTRACT
This aim of this study was to assess the effect of turmeric extract (Curcuma domestica Val.) on the pharmacokinetic profile of paracetamol. The pharmacokinetic profile of paracetamol was determined by analyzing levels in rat plasma. Rats were given turmeric extract 1 hour before and after the administration of paracetamol. Paracetamol levels in rat plasma were analyzed by validated high performance liquid chromatography using a C-18 column and methanol-acetate buffer pH 5 (15:85) as the mobile phase. The result show that if turmeric extract was given 1 hour after the administration of paracetamol, the maximum concentration (Cmax) and area under the curve (AUC) values were lower, but the absorption rate constant and
half-life of elimination remained steady. If the turmeric extract was given 1 hour before the administration of paracetamol, the Cmax was higher but the absorption rate constant, elimination rate constant, half-life of elimination and AUC values remained the same. Based on these results, the administration of turmeric extract before and after oral paracetamol consumption affects the pharmacokinetic profile of paracetamol.
Keywords: Paracetamol, Pharmacokinetic Profile, Turmeric Extract
INTRODUCTION
In Indonesia, herbal medicine has been used for hundreds of years, long before the advent of modern medicine involving laboratory diagnosis and chemicals. Herbal medicine is consumed daily in Indonesian society; 59.12% of Indonesians consume herbs, and 4.36% of them consume turmeric every day. Turmeric is one of the herbs that is most commonly consumed in Indonesia, and constitutes approximately 40% of national herbal medicine consumption [1]. Empirically, turmeric is used to increase appetite, to initiate menstruation, to treat thrush and heartburn and refresh the body [2]. In addition, turmeric is also used as an analgesic, antipyretic and also as an anti-inflammatory agent [3, 4] and antioxidant [5,6]. However, synthetic drugs are more often chosen for pain therapy by the public, rather than herbal medicine [7].
The use of synthetic drugs is still an option to treat pain, fever or headache. One of the most commonly used synthetic drugs is paracetamol. Paracetamol belongs to the class of analgesic and antipyretic drugs and is a metabolite of phenacetin, which has been widely used as an analgesic. Paracetamol works by inhibiting prostaglandin synthesis through inhibition of the cyclooxygenase-2 enzyme (COX-2). The inhibitory effect of paracetamol is greater in the central nervous system (CNS) than in the peripheral system. Paracetamol has almost no activity as an anti-inflammatory so it is not used as an antirheumatic [8, 9, 10]. The pharmacokinetic profile of paracetamol has been published previously; plasma concentrations reach a maximum 0.5 to 1.0 hours after dosing with 500 mg or 1000 mg of paracetamol [11].
Consumption of turmeric extracts and paracetamol at the same time can cause some interactions. Drug interactions occur via three mechanisms, namely: pharmaceutical interactions, pharmacokinetic interactions, and pharmacodynamic interactions [12]. Pharmacokinetic interactions occur when a drug affects the absorption, distribution, metabolism or excretion of other drugs such that its plasma levels might be increased or decreased. As a result, drug toxicity and drug effectiveness might also be increased or decreased [13]. This study was performed to assess the effect of turmeric extract (Curcuma domestica Val.) on the pharmacokinetic profile of paracetamol.
MATERIALS AND METHODS
Plant materials:
Fresh turmeric rhizomes (Curcuma domestica Val.) were obtained from the Manoko farm in Lembang-Bandung and processed at the Department of Biology, Faculty of Mathematics and Natural Sciences, Universitas Padjadjaran.
Experimental animals:
The experimental animals used were male rats (Rattus norvegicus) weighing 150-250 g obtained from the Department of Biology, Faculty of Mathematics and Natural Sciences, Universitas Padjadjaran. Rats were quarantined for one week and fasted for 18-20 hours before blood sampling, with water provided ad libitum. The experiment was approved by the Health Research Ethics Committee of the Faculty of Medicine, Universitas Padjadjaran No: 349/UN6.C1.3.2/KEPK/PN/2015.
Chemical materials:
The materials used in this study were paracetamol compendial standard (BPFI), pharmaceutical grade paracetamol, double-distilled water for HPLC, methanol for HPLC, ethyl acetate, ethanol 95%, NaOH, and Na2
EDTA.
Instruments:
Methods:
Turmeric Extraction:
A 69 g sample of fresh turmeric rhizome was boiled in distilled water for 15 minutes then filtered (while hot) through flannel. Subsequently, it was diluted to a volume of 1 L.
Optimization of HPLC conditions and analytical method validation:
Optimization of the HPLC conditions involved mobile phase selection regarding the composition of the solvent used:
a. methanol:double-distilled water (15:85) b. methanol:acetate buffer pH 5 (15:85)
The flow rate used was 1 mL/min with a detection wavelength of 244 nm. The resolution value, tailing factor and retention time were then calculated to determine the ratio of the mobile phase to be used in the analysis. After all the HPLC conditions had been optimized, the precision, accuracy, limit of quantitation (LOQ), limit of detection (LOD) and linearity test were then validated.
Determination of the paracetamolpharmacokinetic profile:
The pharmacokinetic profile of paracetamol before and after administration of turmeric extract was determined.
Preparation of experimental animals:
For this experiment, 15 male white Wistar rats were used. Rats were acclimatized for two weeks in order to adapt to the new environment. In this study, the 15 rats were divided into three groups randomly. Each group consisted of five rats. Group I and II were the assay groups (the groups given turmeric extract and paracetamol); Group III was the control group (the group given paracetamol only).
Blood sampling was conducted at 0.0, 0.25, 0.5, 0.75, 1.0, 1.5, 2.0, 3.0, 4.0, 5.0 and 6.0 hours after oral administration of the assay preparation.
Analysis of drugs in plasma:
A total of 0.2 mL of plasma was placed in a centrifuge tube that already contained 0.02 mL of 1% Na2EDTA and ethyl acetate was added up to 0.6 mL in each tube. Each tube was shaken horizontally for 2
minutes, then agitated on a vortex mixer for 3 minutes, then the tubes were centrifuged for 15 minutes. Next, 0.6 mL of ethyl acetate was added into each tube. The tube contents were place in a glass vial and evaporated at 40°C with under vacuum. Once dried, the material was redissolved in 0.6 mL of methanol.
The sample solution was filtered illipore filter . μ , then diluted in methanol. A total sample
olu e of μL as i je ted i to the HPLC a d re orded the area was obtained.
Data processing and calculation of pharmacokinetic parameters:
The equations and curves of the kinetic analysis and the pharmacokinetic parameters of paracetamol were calculated using mathematical equations that correspond to the open two-compartment model.
Interpretation of results:
RESULTS AND DISCUSSION
Optimization of HPLC conditions:
In this study, optimization was performed to find the optimum conditions for the analysis of paracetamol. Optimization was performed by varying the mobile phase of methanol:double-distilled water (15:85) with methanol:acetate buffer pH 5 (15:85). The mobile phase optimization results can be seen in Figures 1 and 2.
Figure 1: Chromatogram of paracetamol with methanol: acetate buffer pH 5 (15:85) as the mobile phase
Figure 2: Chromatogram of paracetamol with methanol: double-distilled water (15:85) as the mobile phase
Figures 1 and 2 show that the chromatogram of paracetamol with methanol: double-distilled water (15:85) as the mobile phase and the chromatogram of paracetamol with methanol: acetate buffer pH 5 (15:85) as the mobile phase, respectively. The chromatogram in Figure 2 has a resolution value (Rs) = 2.8, retention time (tR) = 9 minutes and tailing factor (Tf) = 0.5. The chromatogram in Figure 1 has a resolution value (Rs) =
2.45, retention time (tR) = 9.08 minutes and tailing factor (Tf) = 0.8. Based on the results of the determination
of these parameters, methanol: acetate buffer pH 5 gave better results.
Validation of analytical methods:
In this study, a validation of the analytical methods was performed to ensure and confirm that the analysis method is appropriate for the intended use. For this study, the analytical parameters selected for validation were precision, accuracy, LOD (limit of detection), LOQ (limit of quantitation) and linearity.
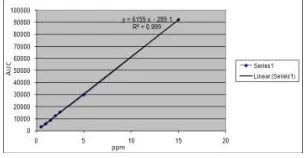
The linearity determination of the Indonesian pharmacopoeia paracetamol calibration curve in plasma was determined by the relationship between the concentration and peak area, at concentrations of 0.5, 1, 1.5, 2, 2.5, 5 and 15 mg/mL. A linear relationship was obtained with a correlation coefficient (r) = 0.9998 and a regression equation y = 6159.9x - 289.18. The results of the calibration curve can be seen in Figure 3.
Figure 3: Calibration curve of paracetamol solution in plasma
The results of parameter validation can be seen in Table 1.
Table 1: Results of parameter validation
Minute
(18-03-11)-02 baku pct 7koma5 met-Air(15-85) kolom C18 10uL 0.5mlmenit
Validation parameter Value
Accuracy (% recovery) 100.26%
Precision (RSD) 2.16
LOD . μg/ L
LOQ . μg/ L
Linearity (r) 0.9998
Determination of the paracetamol pharmacokinetic profile:
Plasma was taken from the blood of rats in each group at specific time points (0.0, 0.25, 0.5, 0.75, 1.0, 1.5, 2.0, 3.0, 4.0, 5.0, 6.0 hours), then analyzed for levels of paracetamol. The results of the paracetamol analysis in plasma in groups 1-3 are shown in Tables 2-4.
Table 2: Plasma levels of paracetamol after a single oral dose of 9 mg/kg BW
No T (hours) Concentration (µg/ mL) ±
Average ± SD (n=5)
1 0 0±0
2 0.25 7.60±0.85
3 0.50 11.46±0.12
4 0.75 12.14±0.16
5 1.00 14.84±0.26
6 1.50 10.25±0.30
7 2.00 6.38±0.22
8 3.00 2.39±0.18
9 4.00 0.82±0.05
10 5.00 0.49±0.08
11 6.00 0.28±0.04
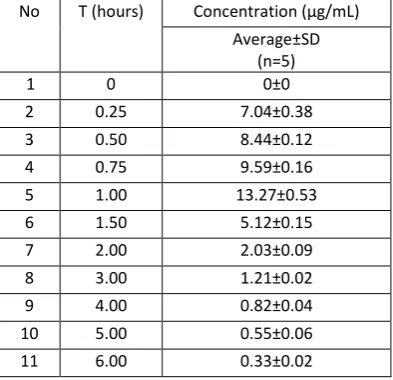
Table 3: Plasma levels of paracetamol given 1 hour after the administration of turmeric extract (276 mg/kg BW)
No T (hours) Concentration (µg/mL)
Average±SD (n=5)
1 0 0±0
2 0.25 7.04±0.38
3 0.50 8.44±0.12
4 0.75 9.59±0.16
5 1.00 13.27±0.53
6 1.50 5.12±0.15
7 2.00 2.03±0.09
8 3.00 1.21±0.02
9 4.00 0.82±0.04
10 5.00 0.55±0.06
11 6.00 0.33±0.02
No T (hours) Concentration (µg/ mL) Average ± SD
(n=5)
1 0 0±0
2 0.25 5.42 ±0.15
3 0.50 10.66±0.24
4 0.75 22.24±0.19
5 1.00 13.48±0.23
6 1.50 8.81±0.48
7 2.00 3.36±0.17
8 3.00 1.03±0.09
9 4.00 0.70±0.05
10 5.00 0.49±0.03
11 6.00 0.35±0.02
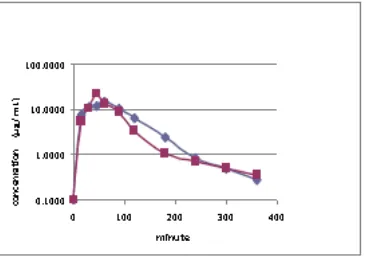
The drug concentration versus time curves wer epreapred to obtain a kinetic equation. The kinetic curves of paracetamol without and with turmeric extract can be seen Figures 4 and 5.
Figure 4: Paracetamol levels in rat plasma versus time
paracetamol only: Cp = 5.01 e-0.473t + 28.84 e-1.114t - 32.36 e-7.467t
paracetamol given before turmeric extract administration: Cp = 2.2 e-0.287t + 26.3 e-0.928t– 33.1 e-12.575 t
Figure 5: Paracetamol levels in rat plasma versus time
paracetamol only: Cp = 5.01 e-0.473t + 28.84 e-1.114t - 32.36 e-7.467t
paracetamol given after turmeric extract administration: Cp = 3.16 e-0.353t + 26.3 e-1.868t - 31.62 e-5.34t
Furthermore, from the paracetamol pharmacokinetic equation, its pharmacokinetic parameters were calculated based on the applicable equation for the open two-compartment model. The results for the pharmacokinetic parameters are shown in Tables 5 and 6.
Table 5: Pharmacokinetic parameters of paracetamol given 1 hour before turmeric extract
Pharmacokinetic parameter
Paracetamol
Alone Before turmeric extract administration A 31.128±1.29 28.400±2.37
B 4.012±1.48 3.388±0.1
C 35.974±1.45 34.394±2.38
Α 1.114±0.07 2.126±0.25
Β 0.412±0.05 0.404±0.06
Ka 11.892±2.64 5.266±1.69 t1/2α 0.622±0.04 0.330±0.05
t1/2β 1.707±0.24 1.755±0.29
K12 0.101±0.04 0.463±0.16
K21 0.480±0.06 0.543±0.07
Ke 0.958±0.12 1.563±0.03
Cmax 14.844±0.26 13.266±0.53
tmax 1.000±0 1.000±0
AUC0-∞ 41.193±5.11 28.913±1.11
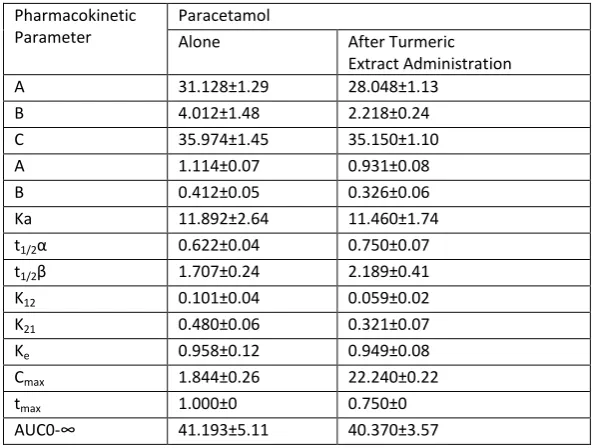
Table 6: Pharmacokinetic parameters of paracetamol given 1 hour after turmeric extract
Pharmacokinetic Parameter
Paracetamol
Alone After Turmeric Extract Administration
A 31.128±1.29 28.048±1.13
B 4.012±1.48 2.218±0.24
C 35.974±1.45 35.150±1.10
Α 1.114±0.07 0.931±0.08
Β 0.412±0.05 0.326±0.06
Ka 11.892±2.64 11.460±1.74
t1/2α 0.622±0.04 0.750±0.07
t1/2β 1.707±0.24 2.189±0.41
K12 0.101±0.04 0.059±0.02
K21 0.480±0.06 0.321±0.07
Ke 0.958±0.12 0.949±0.08
Cmax 1.844±0.26 22.240±0.22
tmax 1.000±0 0.750±0
AUC0-∞ 41.193±5.11 40.370±3.57
Description:
A : intersection ordinate with the distribution phase B : intersection ordinate with the elimination phase C : intersection ordinate with the absorption phase
Α : distribution rate constant (hour-1)
t1/2 α : half-life of distribution (hour)
t1/2β : half-life of elimination (hour)
k12 : distribution rate constant from central compartment to peripheral compartment
k21 : distribution rate constant from peripheral compartment to central compartment ke : elimination velocity constant (hour-1)
Cmax : a i u peak le els μg/ l
tmax : time to achieve peak levels (hour)
AUC0-∞ : area u der the ur e fro t = to t = ∞ μg/ l.hour
In the Tables 5 and 6, the known pharmacokinetic parameters of paracetamol in each treatment are given. The pharmacokinetic parameters of paracetamol administration alone and paracetamol administration 1 hour before or after turmeric extract administration show that the average value of Cmax, t1/2 β, a d AUC
were greater with paracetamol administration alone compared to paracetamol administration 1 hour before turmeric extract administration, except for t1/2 β. For para eta ol ad i istratio alo e, the alues of Cmax, t1/2
β, a d AUC ere . ± . g/ L, . ± . hours a d . ± . g/ L.hour, respe ti el , a d
13.266 ± 0.287 mg/mL, 1.755 ± 0.038 hours and 28.406 ± 0.614 g/mL.hour, respectively, when paracetamol was given 1 hour before turmeric extract administration . This indicates that paracetamol given 1 hour before turmeric extract administration reduced the degree of paracetamol absorption.
The comparison of pharmacokinetic parameters Cmax, t1/2 β, AUC sho ed that the alues ere lo er
when paracetamol was administered alone compared to when paracetamol was given 1 hour after turmeric extract administration For paracetamol administration alone, these values were 14.84 ± 0.32 mg/mL, 1.707 ± 0.037 hours, and 41.193 ± 1.075 g/mL. hour, respectively, and 22.240 ± 0.58 mg/mL, 2.189 ± 0.057 hour, and 40.37 ± 1.053 g/mL.hour, respectively, when paracetamol was given 1 hour after turmeric extract administration. This indicates that turmeric extract administration 1 hour before paracetamol administration may increase the concentration of paracetamol thus the degree of paracetamol absorption increased.
The results of phar a oki eti al ulatio s ere a al zed statisti all Stude t’s at hed-pair test. The results of the pharmacokinetic calculations for oral administration of paracetamol alone with paracetamol given 1 hour before turmeric extract administration showed that the absorption velocity constant (ka) was not
significantly different. This means that turmeric extract administration 1 hour after paracetamol administration did not affect the velocity of paracetamol absorption. The elimination half-life (t1/2β a d ti e
to achieve maximum peak levels (tmax) were also not significantly different between oral administration of
paracetamol alone with paracetamol given 1 hour before turmeric extract administration.
The elimination constant value (ke) showed a significant difference between oral administration of
para eta ol alo e ith para eta ol gi e hour efore tur eri e tra t ad i istratio usi g Stude t’s
matched-pair test with a degree of confidence (p) of 0.05. Administration of turmeric extract 1 hour after paracetamol administration in rats increased the velocity of paracetamol elimination.
The concentration value (Cmax) and area under the curve (AUC) showed significant differences
between oral administration of paracetamol alone with paracetamol given 1 hour before turmeric extract administration. From these results, it can be concluded that the degree of paracetamol absorption decreases if turmeric extract is given 1 hour after paracetamol administration.
The comparison of the pharmacokinetic parameters such as the area under the curve (AUC), elimination half-life (t1/2 β , ti e to rea h a i u peak o e tratio tmax), absorption velocity constant (ka)
and elimination velocity constant (ke) did not show significant differences with a degree of confidence (p) of
0.05 between paracetamol administration alone and when turmeric extract was given 1 hour before paracetamol administration. From these results, it can be concluded that turmeric extract given 1 hour before paracetamol administration did not affect the total level of paracetamol in the blood, the time to reach maximum peak levels, the velocity of paracetamol absorption or the velocity of paracetamol elimination.
The maximum peak concentration (Cmax) showed significant differences between paracetamol
administration paracetamol, it is rapidly absorbed from the gastrointestinal tract and its systemic bioavailability is dose-dependent, ranging from 70 to 90%. Its rate of oral absorption is predominantly dependent on the rate of gastric emptying, and is delayed by the presence of food [14]. Turmeric extract administration 1 hour before paracetamol delayed the absorption of paracetamol, resulting in a lower maximum peak concentration.
CONCLUSIONS
The pharmacokinetic profile of paracetamol given 1 hour before the administration of turmeric extract showed changes in the degree of absorption, elimination rate constant and the peak concentration, but the absorption rate constant and elimination half-life were unchanged. The pharmacokinetic profile of paracetamol given 1 hour after the administration of turmeric extract showed changes in the peak concentration, but the absorption rate constant, elimination rate constant, elimination half-life and the degree of absorption were unchanged.
REFERENCES
[1] http://dinkesjatengprov.go.id/sik/riskesdas_2010/5_JAMU.pdf
[2] Prasad S and Aggarwal BB. Turmeric, the Golden Spice: From Traditional Medicine to Modern
Medicine, in Herbal Medicine Biomolecular and Clinical Aspects (2nd ed), Iris F. F. Benzie and Sissi Wachtel-Galor (Ed.), Boca Raton (FL): CRC Press, 2011, pp 7-8.
[3] Jacob JN, Badyal DK. Nat Prod Commun 2014; 9(2): 225-228.
[4] Agarwal KA, Tripathi CD, Agarwal BB, Saluja S. Surg Endosc 2011; 25(12): 3805-3810. [5] Tilak JC, Banerjee M, Mohan H, Devasagayam TP. Phytother Res 2004;18(10): 798-804.
[6] Kuptniratsaikul VMD, Thanakhumtom S, Chrinswangwatanakul P, Wattanamongkonsil L, Thamikitkul V. J Altern Complement Med 2009; 15(98): 891-897.
[7] Fuzier R, & Lapeyre-Mestre M. J Pain 2014;155(12): 2721-2722.
[8] Buch JG. Clinically Oriented Pharmacology, India: Pandit Deendayal Upadhyay, 2010, pp. 175-180. [9] Freddy WP. Analgesic, Nonsteroidal Anti-Inflammatory, and Gout Drug. Sulistia G. Ganiswara (Ed),
Jakarta, Gaya Baru, 2005, pp. 214.
[10] Graham GG, Scott KF. Am J Therapy 2005; 12(1): 46-55.
[11] Rawlins MD, Henderson DB, Hijab AR. Eur J Clin Pharmacol 1977; 11: 283-286. [12] Schmidt LE, Dalhoff K. Drugs 2002; 62(10): 1481-1502.
[13] Bushra R, Aslam N, Khan AY, Oman Med J 2011;26(2): 77-83.