L1
Kuisioner Strategi Bersaing dan Customer Relationship Management terhadap Loyalitas Pelanggan
Petunjuk Pengisisan:
1. Isilah identitas dengan benar pada kolom yang disediakan
2. Isilah semua nomor dalam angket ini dan jangan ada yang
terewatkan
3. Beri tanda √ pada kolom yang anda pilih
4. Keterangan:
STS = Sangat Tidak Setuju (1)
TS = Tidak Setuju (2) N = Netral (3) S = Setuju (4) SS = Sangat Setuju (5) Nama Perusahaan :__________________________ No Keterangan STS TS N S SS
Strategi Bersaing
1 Perusahaan selalu melakukan diferensiasidalam produk dan pelayanan 2 Perusahaan memiliki fokus dalam
3 Perusahaan memiliki konsep yang jelas dalam menjalankan bisnisnya
4 Perusahaan memiliki kemampuan spesifik yang tidak mudah ditiru
5 Kualitas pelayanan jasa yang dilakukan perusahaan menyebabkan pelanggan loyal terhadap perusahaan
Customer Relationship Management
6 Perusahaan senantiasa meng -updateinformasi yang dibutuhkan pelanggan 7 Proses Layanan jasa yang diberikan
memberikan kontribusi terhadap produktivitas dan profitabilitas bagi perusahaan
8 Perusahaan memiliki
Account Manager
yang mengerti kebutuhan pelanggan dan senantiasa menjalin hubungan baik dengan pelanggan.Loyalitas Pelanggan
9 Layanan jasa yang diberikan senantiasameciptakan hubungan yang baik dengan perusahaan
10 Pelanggan tidak akan menggunakan layanan jasa lain yang ditawarkan perusahaan lain 11 Pelanggan akan terus menerus berhubungan
dengan perusahaan di masa yang akan datang
L2
Output Lisrel 8.80 Nilai Statistik Goodness of Fit, Uji Normalitas dan Path Diagram
90 Depress path.out
DATE: 12/ 4/2009 TIME: 14:52
LISREL 8.80 (STUDENT EDITION) BY
Karl G. J”reskog & Dag S”rbom This program is published exclusively by
Scientific Software International, Inc. 7383 N. Lincoln Avenue, Suite 100
Lincolnwood, IL 60712, U.S.A.
Phone: (800)247-6113, (847)675-0720, Fax: (847)675-2140 Copyright by Scientific Software International, Inc., 1981-2006
Use of this program is subject to the terms specified in the Universal Copyright Convention.
Website: www.ssicentral.com
The following lines were read from file C:\data skripsi\test 10 riil revisi 3 \depress path.SPJ:
SYSTEM FILE from file ‘C:\data skripsi\test 10 riil revisi 3 \depress path.DSF’ Sample Size = 55
Latent Variables loyalita strategi crm Relationships
Y1 = 0.71*loyalita Y2 = loyalita
Y3 = loyalita X1 = strategi X2 = strategi X3 = strategi X4 = crm X5 = crm X6 = crm loyalita = strategi crm
Set the Variance of strategi to 1.00 Set the Variance of crm to 1.00 Path Diagram End of Problem Sample Size = 55 Covariance atriz Y1 Y2 Y3 X1 X2 X3 --- --- --- --- --- --- Y1 0.67 Y2 0.48 0.71 Y3 0.46 0.47 0.53 X1 0.28 0.28 0.32 0.39 X2 0.32 0.34 0.34 0.28 0.40 X3 0.33 0.39 0.30 0.28 0.19 0.46 X4 0.43 0.43 0.41 0.31 0.28 0.30
X5 0.52 0.43 0.44 0.28 0.30 0.28 X6 0.43 0.36 0.45 0.37 0.33 0.26 Covariance atriz X4 X5 X6 --- --- --- X4 0.56 X5 0.43 0.55 X6 0.37 0.39 0.65 Number of Iterations = 13
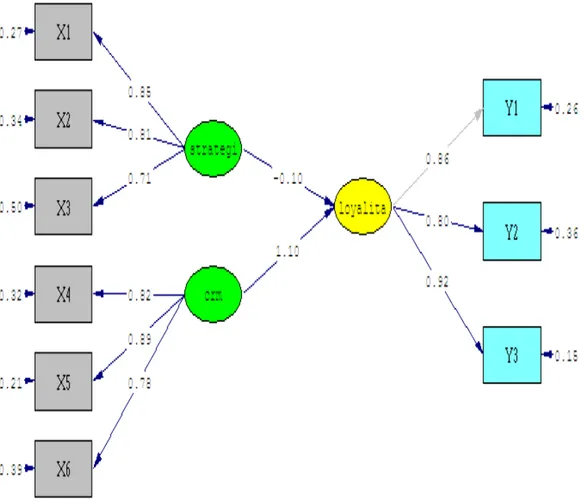
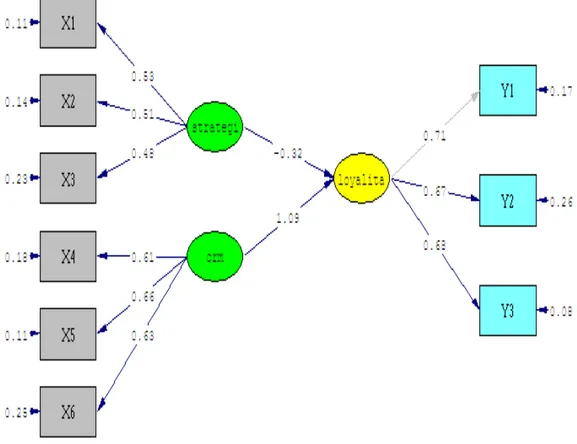
LISREL Estimates (Maximum Likelihood)
Measurement Equations Y1 = 0.71*loyalita, Errorvar.= 0.17 , Rý = 0.74 (0.039) 4.42 Y2 = 0.67*loyalita, Errorvar.= 0.26 , Rý = 0.64 (0.090) (0.054) 7.46 4.74 Y3 = 0.68*loyalita, Errorvar.= 0.078 , Rý = 0.85 (0.069) (0.023) 9.86 3.47
X1 = 0.53*strategi, Errorvar.= 0.11 , Rý = 0.73 (0.071) (0.030) 7.52 3.52 X2 = 0.51*strategi, Errorvar.= 0.14 , Rý = 0.66 (0.074) (0.034) 6.97 4.03 X3 = 0.48*strategi, Errorvar.= 0.23 , Rý = 0.50 (0.083) (0.050) 5.73 4.61 X4 = 0.61*crm, Errorvar.= 0.18 , Rý = 0.68 (0.084) (0.039) 7.33 4.61 X5 = 0.66*crm, Errorvar.= 0.11 , Rý = 0.79 (0.079) (0.029) 8.29 3.93 X6 = 0.63*crm, Errorvar.= 0.25 , Rý = 0.61 (0.093) (0.053) 6.76 4.79
Structural Equations
loyalita = - 0.10*strategi + 1.09*crm, Errorvar.= -0.015 , Rý = 1.02 (0.32) (0.34) (0.055)
-0.32 3.22 -0.28
Correlation Matrix of Independent Variables
strategi crm --- --- strategi 1.00 crm 0.91 1.00 (0.05) 18.04
Covariance Matrix of Latent Variables
loyalita strategi crm --- --- --- loyalita 0.99
strategi 0.90 1.00
crm 1.00 0.91 1.00
Goodness of Fit Statistics
Degrees of Freedom = 24
Normal Theory Weighted Least Squares Chi-Square = 56.41 (P = 0.00020) Estimated Non-centrality Parameter (NCP) = 32.41
90 Percent Confidence Interval for NCP = (14.23 ; 58.29)
Minimum Fit Function Value = 1.22
Population Discrepancy Function Value (F0) = 0.60 90 Percent Confidence Interval for F0 = (0.26 ; 1.08) Root Mean Square Error of Approximation (RMSEA) = 0.16
90 Percent Confidence Interval for RMSEA = (0.10 ; 0.21) P-Value for Test of Close Fit (RMSEA < 0.05) = 0.0014
Expected Cross-Validation Index (ECVI) = 1.82 90 Percent Confidence Interval for ECVI = (1.49 ; 2.30)
ECVI for Saturated Model = 1.67 ECVI for Independence Model = 16.24
Chi-Square for Independence Model with 36 Degrees of Freedom = 858.82 Independence AIC = 876.82 Model AIC = 98.41 Saturated AIC = 90.00 Independence CAIC = 903.89 Model CAIC = 161.56 Saturated CAIC = 225.33
Normed Fit Index (NFI) = 0.92 Non-Normed Fit Index (NNFI) = 0.92 Parsimony Normed Fit Index (PNFI) = 0.62
Incremental Fit Index (IFI) = 0.95 Relative Fit Index (RFI) = 0.89
Critical N (CN) = 36.25
Root Mean Square Residual (RMR) = 0.030 Standardized RMR = 0.056
Goodness of Fit Index (GFI) = 0.81 Adjusted Goodness of Fit Index (AGFI) = 0.65 Parsimony Goodness of Fit Index (PGFI) = 0.43
The Modification Indices Suggest to Add the
Path to from Decrease in Chi-Square New Estimate X1 crm 12.3 -1.20
The Modification Indices Suggest to Add an Error Covariance Between and Decrease in Chi-Square New Estimate X3 X2 9.3 -0.10
X5 Y1 12.7 0.09 X6 X1 9.6 0.09
2. Uji Normalitas
DATE: 12/07/2009 TIME: 15:01
P R E L I S 2.80 (STUDENT) BY
Karl G. J”reskog & Dag S”rbom This program is published exclusively by
Scientific Software International, Inc. 7383 N. Lincoln Avenue, Suite 100
Lincolnwood, IL 60712, U.S.A.
Phone: (800)247-6113, (847)675-0720, Fax: (847)675-2140 Copyright by Scientific Software International, Inc., 1981-2006
Use of this program is subject to the terms specified in the Universal Copyright Convention.
Website: www.ssicentral.com
The following lines were read from file C:\data skripsi\test 10 riil revisi 3\depress.PR2: SY='C:\data skripsi\test 10 riil revisi 3 kemungkinan yang dipakai (dipake 3)\depress.PSF' NS 1 2 3 4 5 6 7 8 9
OU MA=CM RA=depress_normal.psf XM Total Sample Size = 55
Variable Mean St. Dev. T-Value Skewness Kurtosis Minimum Freq. Maximum Freq. --- --- - --- --- X1 4.091 0.624 48.598 0.060 0.157 2.728 3 5.370 4 X2 3.927 0.634 45.936 -0.043 2.988 2.376 4 5.396 5 X3 3.800 0.678 41.585 -0.366 2.221 2.286 5 5.504 3 X4 4.000 0.745 39.799 0.045 0.867 2.402 5 5.290 10 X5 3.836 0.739 38.476 -0.136 1.641 2.300 6 5.450 5 X6 4.018 0.805 37.024 -0.116 0.034 2.380 5 5.206 13 Y1 3.873 0.818 35.123 -0.034 0.671 2.311 7 5.370 8 Y2 3.818 0.841 33.675 -0.039 0.667 2.277 8 5.425 7 Y3 3.855 0.731 39.118 -0.098 1.950 2.307 6 5.480 5
Test of Univariate Normality for Continuous Variables
Skewness Kurtosis Skewness and Kurtosis
Variable Z-Score P-Value Z-Score P-Value Chi-Square P-Value
X1 0.195 0.845 0.467 0.640 0.256 0.880 X2 -0.140 0.889 2.800 0.005 7.857 0.020 X3 -1.169 0.243 2.394 0.017 7.097 0.029 X4 0.146 0.884 1.348 0.178 1.838 0.399 X5 -0.443 0.658 2.013 0.044 4.247 0.120 X6 -0.379 0.705 0.272 0.786 0.217 0.897 Y1 -0.109 0.913 1.138 0.255 1.307 0.520 Y2 -0.126 0.900 1.134 0.257 1.301 0.522
Y3 -0.318 0.751 2.226 0.026 5.054 0.080
Histograms for Continuous Variables
X1
Frequency Percentage Lower Class Limit 3 5.5 2.728 2 3.6 2.992 0 0.0 3.256 0 0.0 3.520 29 52.7 3.785 0 0.0 4.049 0 0.0 4.313 17 30.9 4.577 0 0.0 4.841 4 7.3 5.106 X2
Frequency Percentage Lower Class Limit 4 7.3 2.376 1 1.8 2.678 0 0.0 2.980 0 0.0 3.282 0 0.0 3.584 45 81.8 3.886 0 0.0 4.188 0 0.0 4.490 0 0.0 4.792 5 9.1 5.094 X3
Frequency Percentage Lower Class Limit 5 9.1 2.286 4 7.3 2.608 0 0.0 2.930 0 0.0 3.252 0 0.0 3.573 43 78.2 3.895 0 0.0 4.217 0 0.0 4.539 0 0.0 4.860 3 5.5 5.182 X4
Frequency Percentage Lower Class Limit 5 9.1 2.402 0 0.0 2.691 0 0.0 2.980 0 0.0 3.268 0 0.0 3.557 40 72.7 3.846 0 0.0 4.135 0 0.0 4.423 0 0.0 4.712 10 18.2 5.001 X5
Frequency Percentage Lower Class Limit 6 10.9 2.300
2 3.6 2.615 0 0.0 2.930 0 0.0 3.245
0 0.0 3.560 42 76.4 3.875 0 0.0 4.190 0 0.0 4.505 0 0.0 4.820 5 9.1 5.135 X6
Frequency Percentage Lower Class Limit 5 9.1 2.380 2 3.6 2.662 0 0.0 2.945 0 0.0 3.228 0 0.0 3.510 35 63.6 3.793 0 0.0 4.075 0 0.0 4.358 0 0.0 4.640 13 23.6 4.923 Y1
Frequency Percentage Lower Class Limit 7 12.7 2.311 1 1.8 2.617 0 0.0 2.923 0 0.0 3.229 0 0.0 3.535 39 70.9 3.840 0 0.0 4.146 0 0.0 4.452 0 0.0 4.758 8 14.5 5.064
Y2
Frequency Percentage Lower Class Limit 8 14.5 2.277 1 1.8 2.592 0 0.0 2.907 0 0.0 3.222 0 0.0 3.537 39 70.9 3.851 0 0.0 4.166 0 0.0 4.481 0 0.0 4.796 7 12.7 5.111 Y3
Frequency Percentage Lower Class Limit 6 10.9 2.307 1 1.8 2.624 0 0.0 2.942 0 0.0 3.259 0 0.0 3.576 43 78.2 3.893 0 0.0 4.211 0 0.0 4.528 0 0.0 4.845 5 9.1 5.163
Covariance Matrix X1 X2 X3 X4 X5 X6 --- --- --- --- --- --- X1 0.390 X2 0.162 0.402 X3 0.224 0.112 0.459 X4 0.241 0.242 0.211 0.556 X5 0.186 0.237 0.201 0.350 0.547 X6 0.305 0.254 0.219 0.294 0.282 0.648 Y1 0.190 0.261 0.267 0.343 0.440 0.327 Y2 0.183 0.300 0.328 0.359 0.369 0.250 Y3 0.254 0.293 0.264 0.307 0.340 0.384 Covariance Matrix Y1 Y2 Y3 --- --- --- Y1 0.669 Y2 0.406 0.707 Y3 0.365 0.403 0.534 Means X1 X2 X3 X4 X5 X6
--- --- --- --- --- --- 4.091 3.927 3.800 4.000 3.836 4.018 Means Y1 Y2 Y3 --- --- --- 3.873 3.818 3.855 Standard Deviations X1 X2 X3 X4 X5 X6 --- --- --- --- --- --- 0.624 0.634 0.678 0.745 0.739 0.805 Standard Deviations Y1 Y2 Y3 --- --- --- 0.818 0.841 0.731
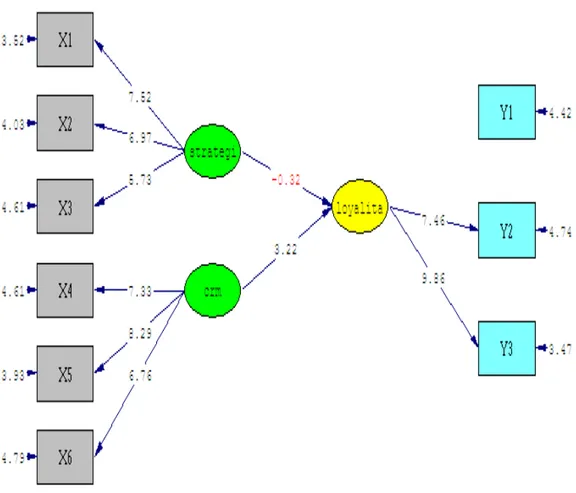
3. Path Diagram
Gambar Path Diagram Structural Equation Modeling (t-values)
L3 Data Mentah X1 X2 X3 X4 X5 X6 Y1 Y2 Y3 4.5 4 4 4 4 4 5 4 4 4.5 4 5 4 3 4 4 4 4 4 5 4 5 4 4 5 5 4 5 4 4 4 3 4 2 4 4 4.5 5 2 4 4 5 4 2 5 4.5 4 4 5 4 5 4 3 4 4 4 4 4 4 4 4 4 4 2 2 2 2 2 2 2 2 2 4 4 4 4 4 4 4 5 4 4.5 4 4 4 4 4 4 4 4 3 2 3 4 2 2 2 2 2 4 4 4 4 4 4 4 4 4 4 4 4 4 4 4 4 4 4 4.5 4 4 4 4 4 5 4 4 4.5 4 4 4 4 4 4 4 4 4 4 4 4 4 4 4 5 4 4 4 4 4 4 4 4 4 4 4 4 4 4 4 4 4 4 4 4.5 4 4 4 4 4 4 4 4 4 4 4 4 4 5 4 4 4 4.5 4 4 4 4 4 4 4 4 4.5 4 4 5 4 5 5 4 4 4.5 4 4 5 4 5 4 4 4 4 4 4 4 4 4 4 4 4 4 4 4 4 4 5 4 4 4 4 4 4 4 4 4 4 4 4 4 4 4 4 4 3 4 4 4 4.5 4 4 4 4 5 4 4 4 4 4 4 2 2 2 2 2 2 4 4 4 4 4 4 4 4 4 4 4 3 4 4 4 4 4 4 4 4 4 4 4 4 4 4 4 5 5 5 5 5 5 5 5 5 4 4 4 4 4 4 5 4 4 4 4 2 2 2 4 2 2 2 4 4 4 4 4 4 4 4 4 4.5 4 4 5 4 4 4 4 4 2 2 2 2 2 2 2 2 2 4 4 4 4 4 4 4 4 5 4 4 4 4 4 4 4 4 4 4 4 4 4 4 5 4 4 4
5 4 4 5 5 5 5 5 5 2 2 2 2 2 2 2 2 2 4 4 4 4 4 4 4 4 4 5 4 4 4 4 5 4 4 4 4 4 4 4 4 4 4 4 4 4 4 4 4 4 4 4 4 4 4 4 4 5 4 4 4 4 4 4.5 4 4 5 4 4 3 4 4 4 5 3 4 4 5 4 4 4 4.5 3 4 4 5 4 4 2 3 3.5 4 4 4 5 4 5 4 4 4.5 4 4 4 4 4 4 4 4 4 5 3 5 5 3 4 5 4 4.5 4 5 4 4 5 4 5 5