Multivariate Analysis of Morphometric Traits of Three Different Indigenous
Cattle Populations from North East States of India
Pundir RK, Singh PK, Sadana DK
National Bureau of Animal Genetic Resources, Karnal 132001 India E-mail: [email protected]; [email protected]; [email protected]
(received 12-01-2015; revised 13-03-2015; accepted 17-03-2015)
ABSTRAK
Pundir RK, Singh PK, Sadana DK. 2015. Analisis multivariate sifat-sifat morfometrik pada tiga populasi sapi asli bagian Timur Laut India yang berbeda. JITV 20(2): 79-86. DOI: http://dx.doi.org/10.14334/jitv.v20i2.1162
Penelitian ini dilakukan untuk membedakan 3 populasi sapi bagian Timur Laut India yaitu Tripura, Mizoram, dan Maniour berdasarkan sifat-sifat morfometrik menggunakan analisis pembeda canonical untuk melihat apakah mereka sama atau berbeda. Data terdiri dari 8 sifat morfometrik yang berbeda dari 383 sapi asli Tripura (136), Mizoram (71) dan Manipur (176). Sifat morfometrik berupa panjang tubuh, tinggi bagian punggung tertinggi, lingkar jantung, lingkar tembolok, lebar wajah, panjang telinga, panjang tanduk, dan panjang ekor tanpa sendi. Semua sifat morfometrik yang diamati memiliki perbedaan yang signifikan untuk semua populasi kecuali pada panjang tanduk. Nilai semua sifat pada sapi Tripura lebih rendah dibandngkan sapi Mizoram dan Manipur. Analisis pembeda bertahap menunjukkan bahwa tinggi bagian punggung tertinggi, panjang badan, panjang telinga, panjang ekor tanpa sendi, lingkat tembolok, and panjang wajah merupakan sifat yang paling berbeda diantara ketiga populasi sapi tersebut. Jarak Mahalanobis berpasangan antara populasi sapi Tripura dan Mizoram, Tripura dan Manipur, serta Mizoram dan Manipur adalah 9,72578, 5,72089 dan 4,65239 berturut-turut dan signifikan. Dendogram menunjukkan bahwa terdapat 2 kelompok, kelompok 1 terdiri dari sapi Manipur dan Mizoram serta kelpompok 2 adalah sapi Tripura yang di[isahkan secara jelas dari kelompok 1. Penempatan individu dari populasi yang berbeda dengan pengelompokkan validasi silang mengungkapkan bahwa 84,13% sapi Tripura, 82,09% sapi Mizoram, dan 79,87% sapi Manipur ditempatkan dengan benar di dalam populasi masing-masing. Berdasarkan pengamatan ini, kita tidak dapat menyimpulkan bahwa mereka adalah tiga bangsa yang berbeda. Tetapi, informasi saat ini, pada tiga populasi sapi tersebut dapat di dimanfaatkan dalam perancangan strategi-strategi yang tepat untuk managemen dan pelestarian sapi-sapi tersebut.
Kata Kunci: Sapi Asli, Sifat Morfometrik, Analisis Multivariate, Analisis Kelompok, Analisis Pembeda Kanonikal
ABSTRACT
Pundir RK, Singh PK, Sadana DK. 2015. Multivariate analysis of morphometric traits of three different indigenous cattle populations from North East states of India. JITV 20(2): 79-86. DOI: http://dx.doi.org/10.14334/jitv.v20i2.1162
INTRODUCTION
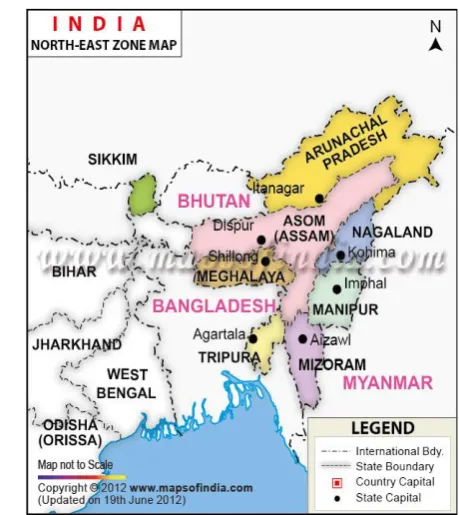
North East states of India comprises of Arunachal Pradesh, Assam, Manipur, Meghalaya, Mizoram, Nagaland, Sikkim and Tripura states (Figure 1 and 2). India had 190.9 million cattle heads in the year 2012 including 151.17 million indigenous and 39.73 million exotic and crossbreds (LC 2012). All these states has populations available in these states and observed similarity/dissimilarity with existing populations using multivariate techniques. If such populations are found distinct/unique, then register them as a distinct breed and if not, search a breed/ population where they can be merged or mixed.
Previous efforts on the phenotypic characterization of breeds of livestock have been restricted to the use of analysis of variance, whereas the current trends in livestock classification involve the use of multivariate statistical tools (Traore et al. 2008; Yakubu &
Akinyemi 2010; Peter et al. 2012; Aziz & Al-Hur 2013). Univariate statistical analysis analyzes each variable separately and do not explain how the populations under investigations differ when all measured morphological traits are considered simultaneously (Dossa et al. 2007). Multifactorial discriminant analyses have been found to be more suitable in assessing variation within a population and can discriminate different population types when all measured morphological traits are considered jointly. Discriminate function analysis can be used not only as a means to explain differences among populations, but also to predict group membership for sampling entities of unknown membership. Discriminate analysis has been used for differentiating populations utilizing various morphological measurements simultaneously (Herrera et al. 1996; Capote et al. 1998; Zaitoun et al. 2005; Dossa et al. 2007; Martins et al. 2009; Yakubu et al. 2010a; Yakubu et al. 2010b; Yakubu et al. 2010c; Peter et al. 2012; Aziz & Al-Hur 2013). In the present study an attempt will be made to differentiate between three cattle populations of North East states of India i.e. Tripura, Mizoram and Manipur based on morphological traits, using canonical discriminant analysis to see whether they are distinct or similar.
Table 1. Cattle population (in thousands) in north east states in India in the year 2012
State Cattle population Indigenous cattle Indigenous female Exotic cattle Arunachal
India 190904.00 151172.00 89223.00 39731.00
Figure 1. North East zone of India Source: http://www.mapsofindia.com/states/
Figure 2. North East zone of India Source: http://www.mapsofindia.com/states/
MATERIALS AND METHODS
Collection of data and location of study
Data consisted of 8 different morphometric traits of 383 indigenous cows from Tripura (136 from West, South, Gomti and Dhalai districts), Mizoram (71 from Champhai and Kolasib districts) and Manipur states
(176 from Imphal East, Imphal west and
Churachandpur districts) of the union of India. These indigenous cattle in all the three states were not described earlier and so far known as nondescript/desi. All the measurements were recorded by the same recorder to avoid between recorder effects. All the traits were recorded from the left side of the cows. The circumference measurements were taken from a tape while the other measures were taken by a measuring stick. Cows were reared through the extensive management system and originated from different herds in different states.
Measured traits
elbow joint), paunch girth (the circumference at paunch region just anterior to the hip joint), ear length (distance from the point of attachment of ear to the tip of the ear) face length(distance from between the horn site to the lower lip), horn length (distance from part of horn attachment to the tip of the horn) and tail length without switch (measured from the root of tail droop to the tip of the tail excluding switch). Physical traits like coat colour, body shape, face, horns, udder and tail characters were also recorded.
Statistical analysis
calculated the Mahalanobis distances between the three cattle populations. Based on the Mahalanobis distance matrix dendogram was created using PROC CLUSTER (SAS 2009) with Average Linkage Method. The ability of these canonical functions to assign each individual animal to its respective population calculated as the percentage of correct assignment to each cattle population using the DISCRIM (SAS 2009) procedure by Nearest Neighbour Discriminant Analysis. The cross-validation approach was used for assignment of individual to their respective population in which one individual is removed from the original matrix and the discriminant analysis is then performed from the remaining observations and used to classify the omitted individual. It also providesan unbiased estimate of error. The proportion of individuals correctly re-allocated is taken as a measure of the morphological distinctness of the population.
RESULTS AND DISCUSSIONS
Tripura, Mizoram and Manipur states are adjoining and located in eastern part of the country. In these states temperature ranged from 10°C to 32ºC. Rice is major crop and no green fodder was grown for animals. Annual rainfall is high more than 2000 mm. Animals were reared mainly on extensive system of management i.e. grazing from morning to evening. Physical traits recorded on these three cattle populations did not reveal significant differences as majority of traits were over lapping. Analysis of physical traits (frequencies) in these cattle population showed that they are differing in proportion of different physical traits, but there was not a single physical trait which can differentiate them
small. The head was small. Face was short and concave. Ears were small to moderate in length and horizontal in orientation. The neck was short in length and thin. hock with black, brown and white switch. Temperament was docile in all the cases. Cows of these three cattle populations are presented in Figures 3-5.
Descriptive statistics of the morphological traits of three different indigenous cows from three different states are given in Table 2. All the traits under study differ significantly in these populations except horn length. All the traits, values were lower in Tripura cows than that of Mizoram and Manipur cows. Manipuri and Mizoram cows differ significantly in body length, ear length and tail length without switch.
The considerable variation in body dimensions of the three cattle populations might not be unconnected with individual population potential and peculiarities. The minimum and maximum variability was observed in horn length and ear length, respectively. The
Table 2. Descriptive statistics of different morphometric traits (cm) in indigenous cows of NEH states
State Overall (383) Tripura (136) Mizoram (71) Manipur (176) Trait Mean+S.E. C.V. Mean+S.E. C.V. Mean+S.E. C.V. Mean+S.E. C.V. Body lenght 101.14+0.46** 8.75 98.09+0.54c 6.43 109.03+1.39a 10.77 100.32+0.59b 7.88 Height at
wither
101.80+0.45** 8.81 93.39+0.44b 5.52 106.92+0.84a 6.67 106.22+0.51a 6.48
Heart girth 132.45+0.72** 10.72 122.05+1.09b 10.46 139.52+1.59a 9.67 137.69+0.78a 7.53 Paunch girth 136.89+0.82** 11.67 125.41+1.08b 10.13 146.64+1.80a 10.41 142.12+0.98a 9.10 Ear length 19.26+0.13** 13.70 19.47+0.24b 14.38 18.02+0.33a 15.88 19.59+0.17b 11.58 Face length 36.73+0.15** 8.63 35.30+0.20b 6.71 36.15+0.37a 8.82 38.06+0.23c 8.02 Tail length
without switch
71.20+0.38** 10.57 68.63+0.51a 8.88 68.54+1.07a 13.23 74.31+0.50b 8.96
Horn length 11.34+0.26 4.37 10.87+0.50 5.20 11.01+0.42 31.90 11.85+0.38 41.01
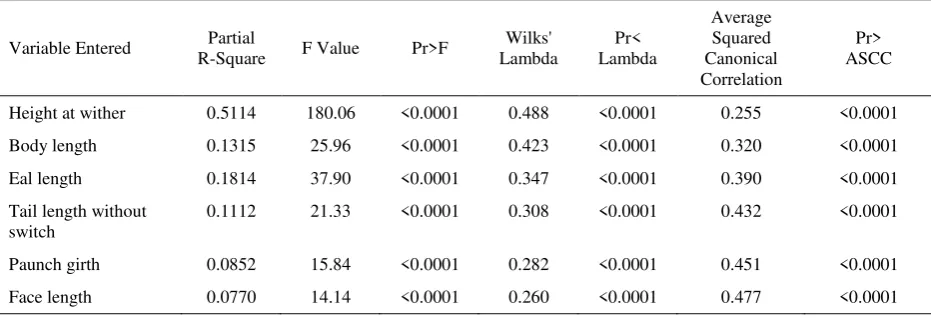
Table 3. Summary of step wise selection of different traits in indigenous cows of of NEH states
Variable Entered Partial
R-Square F Value Pr>F
Wilks' Lambda
Pr< Lambda
Average Squared Canonical Correlation
Pr> ASCC
Height at wither 0.5114 180.06 <0.0001 0.488 <0.0001 0.255 <0.0001 Body length 0.1315 25.96 <0.0001 0.423 <0.0001 0.320 <0.0001 Eal length 0.1814 37.90 <0.0001 0.347 <0.0001 0.390 <0.0001 Tail length without
switch
0.1112 21.33 <0.0001 0.308 <0.0001 0.432 <0.0001
Paunch girth 0.0852 15.84 <0.0001 0.282 <0.0001 0.451 <0.0001 Face length 0.0770 14.14 <0.0001 0.260 <0.0001 0.477 <0.0001
Similar estimation of face length and tail length without switch were obtained by Pundir et al. (2007; 2012; 2013). Higher estimates of both the traits were observed by Singh et al. (2012), Pundir et al. (2009; 2011). Comparable estimates of horn length to the present study was reported by Pundir et al. (2013) However, Pundir et al. (2007; 2009; 2011; 2012) and Singh et al. (2012) obtained higher estimates of the same trait.
The stepwise discriminate analysis showed that height at wither, body length, ear length, tail length without switch, paunch girth and face were the most discriminating variables between these three cattle populations (Table 3). Their respective partial R2 were 0.5114, 0.1315, 0.1814, 0.1112, 0.0852 and 0.0770,
These six morphological variables obtained in the present study are more important and informative, and could be used to assign the three cattle populations into distinct populations, thereby reducing the errors of selection in future breeding and selection programmes. Similar to the present study, Yakubu et al. (2010a) also reported height at wither and face length most discriminating traits in two distinct cattle breeds. In an attempt to distinguish between brown and gray Bengal goats, Mukeherjee et al. (1979) reported significant differences between both breeds due to body length and chest circumference.
Figure 6. Canonical discriminiant functions of three indigenous cows populations (State 1 Tripura 2 Mizoram 3 Manipur) In these studies, step-wise discriminant analysis was
first applied to select the most important discriminator variables used for differentiation among breeds under study. The canonical discriminant function representation is shown in Figure 6 which revealed overlapping of these populations in the present study.The Mahalanobis distances between three cattle populations are given in Table 4. The pairwise distance Tripura and Mizoram, Tripura and Manipur and Mizoram and Manipur were 9.72578, 5.72089 and 4.65239, respectively, and highly significant (P<0.0001). Yakubu et al. (2010a) Observed Mahalanobis distance between the two cattle populations as 7.19 which was high and significant and indicated that that they belong to genetically different groups. Yakubu et al. (2010c) estimated Mahalanobis distance of 72.28 between West African Dwarf and Red Sokoto goats in Nigeria, indicating that there is considerable genetic variation between both breeds. Aziz & Al-Haur (2013) observed Mahalanobis distance of 0.55 between two lines of goat and between Ardi and each of Line1 and Line2 were 25.03 and 21.45, respectively.
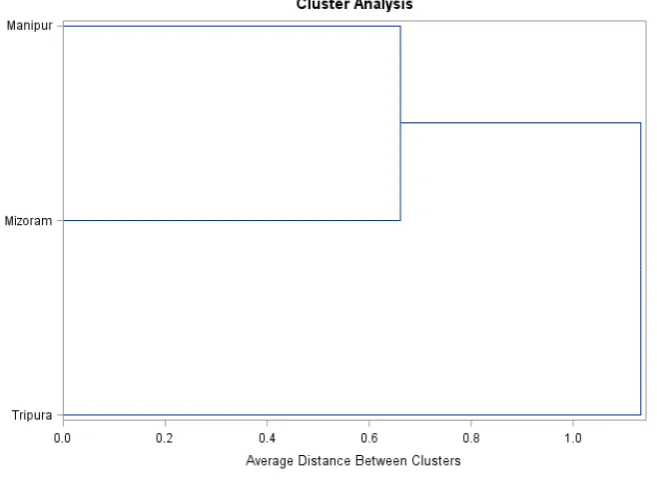
The dendogram (Figure 7) based on the average linkage methodshowed that there are two clusters; cluster one includes Manipur and Mizoram cows and cluster two Tripura cows those are clearly separated from cluster one.
Table 4. Mahalanobis distances between three different populations of indigenous cows in North East States
In the lower triangular probability of significance is shown
The individual assignment to different cattle populations by the Cross-validation classification was given in table 5. The proportion of individuals correctly assigned to their respective population is considered as a measure of the morphological distinctness of the population.High values of error 0.158, 0.179 and 0.201 were observed for Tripura, Mizoram and Manipur cattle populations, respectively. The reason for this misclassification may be a high degree of intermingling these populations as they are from the adjoining states. The high morphological distances between the cattle populations coupled with high correct assignment to source populations is an indication that they belong to different populations. But there was no distinct physical trait which could differentiate these populations.
State Tripura Mizoram Manipur Tripura 0 9.72578 5.72089 Mizoram P<0.0001 0 4.65239 Manipur P<0.0001 P<0.0001 0 Canonical Discriminant Functions
F
u
n
cti
o
n
2
Figure 7. Dendogram showing similarity/distinctness in three indigenous cows populations Table 5. Percent of individual cows classified in to different populations of north east states
Population Tripura Mizoram Manipur Total
Tripura 106
(84.13)
7 (5.56)
13 (10.32)
126 (100)
Mizoram 4
(5.97)
55 (82.09)
8 (11.94)
67 (100)
Manipur 13
(8.44)
18 (11.69)
123 (79.87)
154 (100)
Error level 0.158 0.179 0.201 0.158
Priors 0.333 0.333 0.333
Yakubu et al. (2010a) reported that 85.48% of Bunaji cattle and 96.55% of Sokoto Gudali classified into their source population assigned correctly by the Nearest Neighbour Discriminant Analysis. Aziz & Al-Haur (2013) observed 100% assignment of Ardi animals into their genetic group and percentages of animals assigned in Line1 and line2 were 86.10 and 42.55, respectively. The use of multivariate discriminant analyses therefore could be successfully used in morphometric differentiation. Similar reports on
CONCLUSION
Capote J, Delgado JV, Fresno M, Camacho ME, Molina A.1998. Morphological variability in the Canary goat population. Small Rumin Res. 27:167-162.
Dossa LH, Wollny C, Gauly M. 2007.Spatial variation in goatpopulations from Benin as revealed by multivariate analysisof morphological traits. Small Rumin Res. 73:150-159
Herrera M, Rodero E, Gutierrez MJ, Pena F, Rodero JM. 1996. Application of multifactorial discriminant analysis in the morphostructural differentiation of Andalusian caprine breeds. Small Rumin Res. 22:39-47. Johari S, Kurnianto E, Sutopo S, Hamayanti WA. 2009. Multivariate analysis on phenotypic traits of body measurementin swamp buffalo (Bubalus bubalis). J Indones Trop Anim Agric. 34:289-294.
[LC] Livestock Census. 2012. Animal Husbandry Statistics. Department of Animal husbandry and Dairying, MoA, GOI, New Delhi.
Martins CEN, Quadros SAF, Trindade JPP, Quadros FLF,Costa JHC, Raduenz G. 2009. Shape and function in Braford cows: The body shape as an indicative of performance and temperament. Arch Zootec. 58:425-433.
Mukeherjee DK, Singh CSP, Mishra HR. 1979. A note on some phenotypic parameters in grey and brown Bengal goats. Indian J Anim Sci. 49:671-671.
Ndumu DB, Baumung R, Hanotte O, Wurzinger M, OkeyoMA, Jianlin H, Kibogo H,Solkner J. 2008. Genetic andmorphological characterization of the Ankole Longhorn cattle in the African Great Lakes region. Genet Sel Evol. 40:467-490.
Peter TB, Peters SO, Yakuba AA, Michael OO. 2012. Multivariate characterisation of the phenotypic traits of Djallonke and Sahel sheep in Northern Ghana. Trop Anim Health Prod. http://dx.doi.org/10.1007/s11-250-012-02114.
Pundir RK, Singh PK, Prakash B, Ahlawat SPS. 2007. Characterization and evaluation of Kenkatha breed in its native tract. Indian J Anim Sci. 77:177-180.
Pundir RK, Kathiravan P, Singh PK, Manikhandan VA. 2009. Bargur cattle: status, characteristics and performance. Indian J Anim Sci. 79:681-685.
Pundir RK, Singh PK, Singh KP, Dangi PS. 2011. Factor analysis of biometric traits of kankrej cows to explain body. Asian Aust J Anim Sci. 24:449-456.
Pundir RK, Singh PK, Sharma D, Saini A, Singh CV, Prakash B. 2012. Hill cattle of Pithoragarh district of Uttarakhand. Indian J Anim Sci. 82:1591-1593. Pundir RK, Singh PK, Neelkant, Sharma D, Singh CV,
Prakash B. 2013. Uttara- A new cattle germ plasm from Uttarakhand hills. Indian J Anim Sci. 83:51-58.
[SAS] Statistical Analysis System. 2009. Statistical Analysis
System User’s guide: Release 9.2. SAS Institute, Inc.,
Cary, NC, USA.
Singh PK, Pundir RK, Kumarasamy P, Vivekanandav P. 2012. Management and physical features of migratory Pullikulam cattle of Tamilnadu. Indian J Anim Sci.
Yakubu A, Akinyemi MO. 2010. An evaluation of sexual size dimorphism in Uda sheep using multifactorial discriminant analysis. Acta Agriculturae Sci Section A. 60:74-78.
Yakubu A, Idahor KO, Haruna HS, Wheto M, Amusan S. 2010a. Multivariate analysis of phenotypic differenciation in Bunaji and Sokoto Gudali Cattle. Acta Agriculturae Solvenica A. 96:75-80.
Yakubu A, Salako AE, Imumorin IG. 2010b. Multivariate analysis of spatial patterns of morphological traits in West African Dwarf goats in three agro-ecological zones of Nigeria. J Appl Anim Res. 38:257-260. Yakubu A, Salako AE, Imumorin IG, Ige AO, Akinyemi MO.
2010c. Discriminant analysis of morphometric differentiation in the West African Dwarf and Red Sokoto goats. S Afr J Anim Sci. 40:381-387.


