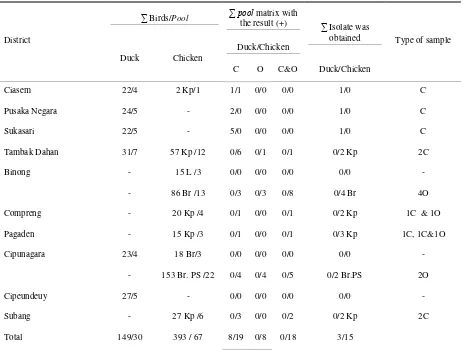
Indonesian Journal of Animal and Veterinary Sciences
JITV Volume 20 Number 2 Page 79-157 Bogor, June 2015 ISSN 0853-7380
E-ISSN 2252-696X
Editor PREFACE
In this edition volume 20 no.2 June 2015, we publish Jurnal Ilmu Ternak dan Veteriner in English. We will henceforth always publish this journal in English. This is done because this journal can be accessed from around the world, then an English version is needed in order to get a wider audience.
The articles published in this edition are: "Multivariate analysis of morphometric traits of three different indigenous cattle Populations from North East states of India"; “Isolation and identification of indigenous lactic acid bacteria from North Sumatra river buffalo milk"; "Effectivity of probiotic, micro mineral enriched yeast and their combination with Azadirachta indica leaves containing tannin on fermentability and digestibility of Pennisetum hybrid"; "Productivity of Calliandra calothyrsus, Indigofera zollingeriana, and Gliricidia sepium on acid soil in the greenhouse"; "Molecular analysis of the hemagglutinin gene of avian Influenza viruses isolated in 2012-2013"; "Reliability of the DIVA test based on M2E exceed Reviews those on HA2 peptide or peptides NSI"; "Newcastle Disease Virus infection study on duck and chicken in Subang district"; and "Curcumin effect on Bleomuchin-induced pulmonary fibrosis in Mus musculus"
Hopefully these articles would be useful for their readers and farmers the users of technological innovation needed for the development of the world of farming.
Bogor, June 2015
Chief Editor
Advisor:
Head of Indonesian Center for Animal Research and Development
Chief Editor:
Prof. Dr. Ismeth Inounu, M.S. (Animal Breeding and Genetic)
Vice Chief Editor:
Dr. Dra. M.B. Tresnawati Purwadaria (Agricultural Biotechnology)
Editorial Members:
Dr. Ir. R.A. Yeni Widiawati (Animal Feed and Nutrition) Prof. Dr. Sofjan Iskandar, M.Rur.Sc. (Animal Feed and Nutrition) Ir. Bambang Setiadi, M.S. (Animal Breeding and Genetic)
Dr. Ir. Dwi Yulistiani, M.App.Sc. (Ruminant Nutrition) Dr. Ir. L. Hardi Prasetyo, M.Agr. (Animal Breeding and Genetic) Dr. Drs. Simson Tarigan, M.Sc. (Pathology)
drh. Suhardono, M.V.Sc., Ph.D. (Parasitology)
Dr. Raphaella Widiastuti, B.Sc. (Toxicology and Mycology)
Technical Editors: Linda Yunia, S.E.
Rahmawati Elvianora Pulungan Ahmadi Riyanto, Sm.Hk. M. Indra Fauzy, A.Md.
English Editor:
Ir. Nurhasanah Hidajati English Translator
Cahyatina Tri Rahayu, S.Pt Published by:
Indonesian Center for Animal Research and Development Indonesian Agency for Agricultural Research and Development, Ministry of Agriculture
Collaborated with:
Secretariat of IJAVS:
Jalan Raya Pajajaran Kav. E. 59, Bogor 16128 - Indonesia Telephone (0251) 8322185
Fax (0251) 8380588
E-mail: [email protected]; [email protected]
Website: http://medpub.litbang.pertanian.go.id/index.php/jitv
Indonesian Journal for Animal and Veterinary Sciences is published four times a year in March, June, September and December.
Complete paper may be accessed through: http://medpub.litbang.pertanian.go.id/index.php/jitv or
http://peternakan.litbang.pertanian.go.id/index.php?option=com_content&view=article&id=3633&Itemid=119 or through database CAB DIRECT (www.cabdirect.org) or
Indonesian Journal of Animal and Veterinary Sciences
Volume 20, Number 2, June 2015 ISSN 0853-7380 E-ISSN 2252-696X
LIST OF CONTENT
Page Multivariate analysis of morphometric traits of three different indigenous cattle
populations from North East states of India
Pundir RK, Singh PK, Sadana DK ... 79-86 Isolation and identification of indigenous lactic acid bacteria from North Sumatra
river buffalo milk
Rizqiati H, Sumantri C, Noor RR, Damayanthi E, Rianti EI ... 87-94 Effectivity of probiotic, micromineral enriched yeast and their combination with
Azadirachta indica leaves containing tannin on fermentability and digestibility of Pennisetum hybrid
Sofyan A, Sakti AA, Karimy MF, Julendra H, Istiqomah L, Herdian H, Damayanti
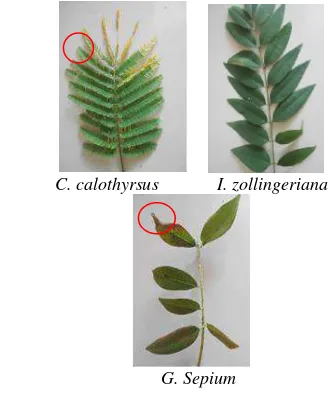
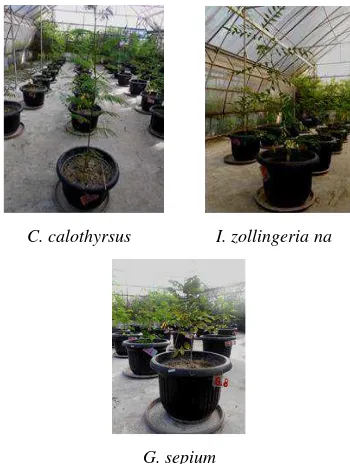
E, Suryani AE ... 95-104 Productivity of Calliandra calothyrsus, Indigofera zollingeriana, and Gliricidia
sepium on acid soil in the greenhouse
Herdiawan I, Sutedi ... 105-114 Molecular analysis of hemagglutinin gene of Avian Influenza viruses isolated in
2012-2013
Kurniasih SW, Soejoedono RD, Mayasari NLPI ... 115-125 The reliability of DIVA test based on M2e peptide exceed those on HA2 or NS1
peptides
Tarigan S, Sumarningsih, Ignjatovic J ... 126-133 Newcastle Disease Virus infection study on duck and chicken in Subang district
Panus A, Setiyaningsih S, Mayasari NLPI ... 134-147 Curcumin effect on Bleomuchin-induced pulmonary fibrosis in Mus musculus
Multivariate Analysis of Morphometric Traits of Three Different Indigenous
Cattle Populations from North East States of India
Pundir RK, Singh PK, Sadana DK
National Bureau of Animal Genetic Resources, Karnal 132001 India E-mail: [email protected]; [email protected]; [email protected]
(received 12-01-2015; revised 13-03-2015; accepted 17-03-2015)
ABSTRAK
Pundir RK, Singh PK, Sadana DK. 2015. Analisis multivariate sifat-sifat morfometrik pada tiga populasi sapi asli bagian Timur Laut India yang berbeda. JITV 20(2): 79-86. DOI: http://dx.doi.org/10.14334/jitv.v20i2.1162
Penelitian ini dilakukan untuk membedakan 3 populasi sapi bagian Timur Laut India yaitu Tripura, Mizoram, dan Maniour berdasarkan sifat-sifat morfometrik menggunakan analisis pembeda canonical untuk melihat apakah mereka sama atau berbeda. Data terdiri dari 8 sifat morfometrik yang berbeda dari 383 sapi asli Tripura (136), Mizoram (71) dan Manipur (176). Sifat morfometrik berupa panjang tubuh, tinggi bagian punggung tertinggi, lingkar jantung, lingkar tembolok, lebar wajah, panjang telinga, panjang tanduk, dan panjang ekor tanpa sendi. Semua sifat morfometrik yang diamati memiliki perbedaan yang signifikan untuk semua populasi kecuali pada panjang tanduk. Nilai semua sifat pada sapi Tripura lebih rendah dibandngkan sapi Mizoram dan Manipur. Analisis pembeda bertahap menunjukkan bahwa tinggi bagian punggung tertinggi, panjang badan, panjang telinga, panjang ekor tanpa sendi, lingkat tembolok, and panjang wajah merupakan sifat yang paling berbeda diantara ketiga populasi sapi tersebut. Jarak Mahalanobis berpasangan antara populasi sapi Tripura dan Mizoram, Tripura dan Manipur, serta Mizoram dan Manipur adalah 9,72578, 5,72089 dan 4,65239 berturut-turut dan signifikan. Dendogram menunjukkan bahwa terdapat 2 kelompok, kelompok 1 terdiri dari sapi Manipur dan Mizoram serta kelpompok 2 adalah sapi Tripura yang di[isahkan secara jelas dari kelompok 1. Penempatan individu dari populasi yang berbeda dengan pengelompokkan validasi silang mengungkapkan bahwa 84,13% sapi Tripura, 82,09% sapi Mizoram, dan 79,87% sapi Manipur ditempatkan dengan benar di dalam populasi masing-masing. Berdasarkan pengamatan ini, kita tidak dapat menyimpulkan bahwa mereka adalah tiga bangsa yang berbeda. Tetapi, informasi saat ini, pada tiga populasi sapi tersebut dapat di dimanfaatkan dalam perancangan strategi-strategi yang tepat untuk managemen dan pelestarian sapi-sapi tersebut.
Kata Kunci: Sapi Asli, Sifat Morfometrik, Analisis Multivariate, Analisis Kelompok, Analisis Pembeda Kanonikal
ABSTRACT
Pundir RK, Singh PK, Sadana DK. 2015. Multivariate analysis of morphometric traits of three different indigenous cattle populations from North East states of India. JITV 20(2): 79-86. DOI: http://dx.doi.org/10.14334/jitv.v20i2.1162
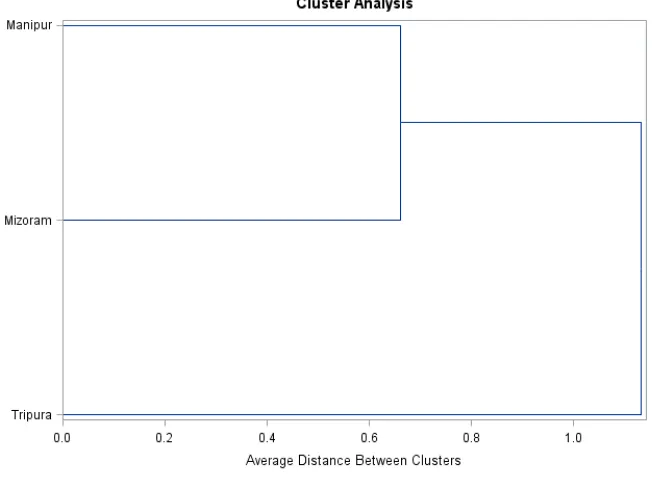
In the present study an attempt has been made to differentiate three cattle populations of North East states of India i.e. Tripura, Mizoram and Manipur based on morphometric traits, using canonical discriminant analysis to see whether they are similar or distinct. Data consisted of eight different morphometric traits of 383 indigenous cows from Tripura (136), Mizoram (71) and Manipur (176). Morphometric traits included body length, height at withers, heart girth, paunch girth, face length, ear length, horn length and tail length without switch. All the morphometric traits under study differ significantly in these populations except horn length. All the traits, values were lower in Tripura cows than that of Mizoram and Manipur cows. The stepwise discriminant analysis showed that height at withers, body length, ear length, tail length without switch, paunch girth and face length were the most discriminating traits in these three cattle populations. The pair wise Mahalanobis distances between Tripura and Mizoram, Tripura and Manipur and Mizoram and Manipur were 9.72578, 5.72089 and 4.65239, respectively, and significant. The dendogram showed that there are two clusters; cluster one includes Manipur and Mizoram cows and cluster two Tripura cows those are clearly separated from cluster one. The Individual assignment of different cattle populations by the cross-validation classification revealed 84.13% of Tripura cows, 82.09% of Mizoram cows and 79.87% Manipur cows were assigned correctly into their respective population. Based on the present study we cannot conclude that they are three different distinct breeds. However, the present information on the three cattle populations could therefore be exploited in designing appropriate strategies for their management and conservation.
INTRODUCTION
North East states of India comprises of Arunachal Pradesh, Assam, Manipur, Meghalaya, Mizoram, Nagaland, Sikkim and Tripura states (Figure 1 and 2). India had 190.9 million cattle heads in the year 2012 including 151.17 million indigenous and 39.73 million exotic and crossbreds (LC 2012). All these states has around 6.9% of total cattle population of the country. The proportion of indigenous and exotic cattle as compared to whole country was 8.19% and 2.28% in these states (Table 1). In this region, there is only one registered cattle breed known as Siri (Sikkim). Rest of the cattle in this region is known as known as Desi (non described). There is a need to characterize these cattle populations available in these states and observed similarity/dissimilarity with existing populations using multivariate techniques. If such populations are found distinct/unique, then register them as a distinct breed and if not, search a breed/ population where they can be merged or mixed.
Previous efforts on the phenotypic characterization of breeds of livestock have been restricted to the use of analysis of variance, whereas the current trends in livestock classification involve the use of multivariate statistical tools (Traore et al. 2008; Yakubu &
Akinyemi 2010; Peter et al. 2012; Aziz & Al-Hur 2013). Univariate statistical analysis analyzes each variable separately and do not explain how the populations under investigations differ when all measured morphological traits are considered simultaneously (Dossa et al. 2007). Multifactorial discriminant analyses have been found to be more suitable in assessing variation within a population and can discriminate different population types when all measured morphological traits are considered jointly. Discriminate function analysis can be used not only as a means to explain differences among populations, but also to predict group membership for sampling entities of unknown membership. Discriminate analysis has been used for differentiating populations utilizing various morphological measurements simultaneously (Herrera et al. 1996; Capote et al. 1998; Zaitoun et al. 2005; Dossa et al. 2007; Martins et al. 2009; Yakubu et al. 2010a; Yakubu et al. 2010b; Yakubu et al. 2010c; Peter et al. 2012; Aziz & Al-Hur 2013). In the present study an attempt will be made to differentiate between three cattle populations of North East states of India i.e. Tripura, Mizoram and Manipur based on morphological traits, using canonical discriminant analysis to see whether they are distinct or similar.
Table 1. Cattle population (in thousands) in north east states in India in the year 2012
State Cattle population Indigenous cattle Indigenous female Exotic cattle
Arunachal Pradesh
463.76 440.53 248.67 23.23
Assam 10307.60 9911.70 5695.29 395.90
Manipur 263.84 219.54 133.80 44.31
Meghalaya 896.00 860.75 513.61 35.25
Mizoram 34.57 23.28 14.75 11.30
Nagaland 234.97 106.02 64.46 128.95
Sikkim 140.47 13.95 8.90 126.52
Tripura 948.79 815.69 502.89 133.31
Total 13290.00
(6.96%)
12391.46 (8.19%)
7182.37 (8.05%)
898.77 (2.28%)
India 190904.00 151172.00 89223.00 39731.00
Figure 1. North East zone of India Source: http://www.mapsofindia.com/states/
Figure 2. North East zone of India Source: http://www.mapsofindia.com/states/
MATERIALS AND METHODS
Collection of data and location of study
Data consisted of 8 different morphometric traits of 383 indigenous cows from Tripura (136 from West, South, Gomti and Dhalai districts), Mizoram (71 from Champhai and Kolasib districts) and Manipur states (176 from Imphal East, Imphal west and Churachandpur districts) of the union of India. These indigenous cattle in all the three states were not described earlier and so far known as nondescript/desi. All the measurements were recorded by the same recorder to avoid between recorder effects. All the traits were recorded from the left side of the cows. The circumference measurements were taken from a tape while the other measures were taken by a measuring stick. Cows were reared through the extensive management system and originated from different herds in different states.
Measured traits
The recorded morphometric traits were body length (the distance from the point of the shoulder joint to the point of the pin bone), height at withers (the distance from the highest point of withers to the ground), heart girth (the circumference of the chest just behind the
elbow joint), paunch girth (the circumference at paunch region just anterior to the hip joint), ear length (distance from the point of attachment of ear to the tip of the ear) face length(distance from between the horn site to the lower lip), horn length (distance from part of horn attachment to the tip of the horn) and tail length without switch (measured from the root of tail droop to the tip of the tail excluding switch). Physical traits like coat colour, body shape, face, horns, udder and tail characters were also recorded.
Statistical analysis
calculated the Mahalanobis distances between the three cattle populations. Based on the Mahalanobis distance matrix dendogram was created using PROC CLUSTER (SAS 2009) with Average Linkage Method. The ability of these canonical functions to assign each individual animal to its respective population calculated as the percentage of correct assignment to each cattle population using the DISCRIM (SAS 2009) procedure by Nearest Neighbour Discriminant Analysis. The cross-validation approach was used for assignment of individual to their respective population in which one individual is removed from the original matrix and the discriminant analysis is then performed from the remaining observations and used to classify the omitted individual. It also providesan unbiased estimate of error. The proportion of individuals correctly re-allocated is taken as a measure of the morphological distinctness of the population.
RESULTS AND DISCUSSIONS
Tripura, Mizoram and Manipur states are adjoining and located in eastern part of the country. In these states temperature ranged from 10°C to 32ºC. Rice is major crop and no green fodder was grown for animals. Annual rainfall is high more than 2000 mm. Animals were reared mainly on extensive system of management i.e. grazing from morning to evening. Physical traits recorded on these three cattle populations did not reveal significant differences as majority of traits were over lapping. Analysis of physical traits (frequencies) in these cattle population showed that they are differing in proportion of different physical traits, but there was not a single physical trait which can differentiate them strictly. In general animals were small in size with the cylindrical type of body. Animals were well built and compact with strong legs. The coat colour varied in different colours i.e. brown, black and grey/white but brown colour predominates. Dewlap and hump were
small. The head was small. Face was short and concave. Ears were small to moderate in length and horizontal in orientation. The neck was short in length and thin. Horns were small, black or gray in colour. Orientation was outward and then upward. Hoofs were black. Muzzles were brown and black. Udder was small, not well developed and milk veins were not prominent. Sizes of fore and rear udder were small. Teats were small 5-12 cm long. Penis sheath flap was short and tucked up with the body. The tail was longer up to the hock with black, brown and white switch. Temperament was docile in all the cases. Cows of these three cattle populations are presented in Figures 3-5.
Descriptive statistics of the morphological traits of three different indigenous cows from three different states are given in Table 2. All the traits under study differ significantly in these populations except horn length. All the traits, values were lower in Tripura cows than that of Mizoram and Manipur cows. Manipuri and Mizoram cows differ significantly in body length, ear length and tail length without switch.
The considerable variation in body dimensions of the three cattle populations might not be unconnected with individual population potential and peculiarities. The minimum and maximum variability was observed in horn length and ear length, respectively. The estimates of body length obtained in the present study were in agreement with the reports of Pundir et al. (2013) in Uttara cows, Pundir et al. (2012) in Pithoragarh cows and Pundir et al. (2009) in Bargur cows. However, higher estimates of body length were observed by Singh et al. (2012) in Pullikumam cows, Pundir et al. (2011) in Kankrej cows and Pundiret al. (2007) in Kenkatha cows.The estimates of height at wither, heart girth and paunch girth were comparablewith the reports of Pundir et al. (2012; 2013). Higher estimates of height at wither were reported by Singh et al. (2012), Pundir et al. (2007; 2011).
Table 2. Descriptive statistics of different morphometric traits (cm) in indigenous cows of NEH states
State Overall (383) Tripura (136) Mizoram (71) Manipur (176)
Trait Mean+S.E. C.V. Mean+S.E. C.V. Mean+S.E. C.V. Mean+S.E. C.V.
Body lenght 101.14+0.46** 8.75 98.09+0.54c 6.43 109.03+1.39a 10.77 100.32+0.59b 7.88 Height at
wither
101.80+0.45** 8.81 93.39+0.44b 5.52 106.92+0.84a 6.67 106.22+0.51a 6.48
Heart girth 132.45+0.72** 10.72 122.05+1.09b 10.46 139.52+1.59a 9.67 137.69+0.78a 7.53 Paunch girth 136.89+0.82** 11.67 125.41+1.08b 10.13 146.64+1.80a 10.41 142.12+0.98a 9.10 Ear length 19.26+0.13** 13.70 19.47+0.24b 14.38 18.02+0.33a 15.88 19.59+0.17b 11.58 Face length 36.73+0.15** 8.63 35.30+0.20b 6.71 36.15+0.37a 8.82 38.06+0.23c 8.02 Tail length
without switch
71.20+0.38** 10.57 68.63+0.51a 8.88 68.54+1.07a 13.23 74.31+0.50b 8.96
Horn length 11.34+0.26 4.37 10.87+0.50 5.20 11.01+0.42 31.90 11.85+0.38 41.01
Table 3. Summary of step wise selection of different traits in indigenous cows of of NEH states
Variable Entered R-Square Partial F Value Pr>F Lambda Wilks' Lambda Pr<
Average Squared Canonical Correlation
Pr> ASCC
Height at wither 0.5114 180.06 <0.0001 0.488 <0.0001 0.255 <0.0001
Body length 0.1315 25.96 <0.0001 0.423 <0.0001 0.320 <0.0001
Eal length 0.1814 37.90 <0.0001 0.347 <0.0001 0.390 <0.0001
Tail length without switch
0.1112 21.33 <0.0001 0.308 <0.0001 0.432 <0.0001
Paunch girth 0.0852 15.84 <0.0001 0.282 <0.0001 0.451 <0.0001
Face length 0.0770 14.14 <0.0001 0.260 <0.0001 0.477 <0.0001
Similar estimation of face length and tail length without switch were obtained by Pundir et al. (2007; 2012; 2013). Higher estimates of both the traits were observed by Singh et al. (2012), Pundir et al. (2009; 2011). Comparable estimates of horn length to the present study was reported by Pundir et al. (2013) However, Pundir et al. (2007; 2009; 2011; 2012) and Singh et al. (2012) obtained higher estimates of the same trait.
The stepwise discriminate analysis showed that height at wither, body length, ear length, tail length without switch, paunch girth and face were the most discriminating variables between these three cattle populations (Table 3). Their respective partial R2 were 0.5114, 0.1315, 0.1814, 0.1112, 0.0852 and 0.0770, respectively, with high significant values (P<0.0001). The corresponding F values for these traits were 180.6, 25.96, 37.90, 21.33, 15.84 and 14.14, respectively and highly significant.
These six morphological variables obtained in the present study are more important and informative, and could be used to assign the three cattle populations into distinct populations, thereby reducing the errors of selection in future breeding and selection programmes. Similar to the present study, Yakubu et al. (2010a) also reported height at wither and face length most discriminating traits in two distinct cattle breeds. In an attempt to distinguish between brown and gray Bengal goats, Mukeherjee et al. (1979) reported significant differences between both breeds due to body length and chest circumference.
Figure 6. Canonical discriminiant functions of three indigenous cows populations (State 1 Tripura 2 Mizoram 3 Manipur) In these studies, step-wise discriminant analysis was
first applied to select the most important discriminator variables used for differentiation among breeds under study. The canonical discriminant function representation is shown in Figure 6 which revealed overlapping of these populations in the present study.The Mahalanobis distances between three cattle populations are given in Table 4. The pairwise distance Tripura and Mizoram, Tripura and Manipur and Mizoram and Manipur were 9.72578, 5.72089 and 4.65239, respectively, and highly significant (P<0.0001). Yakubu et al. (2010a) Observed Mahalanobis distance between the two cattle populations as 7.19 which was high and significant and indicated that that they belong to genetically different groups. Yakubu et al. (2010c) estimated Mahalanobis distance of 72.28 between West African Dwarf and Red Sokoto goats in Nigeria, indicating that there is considerable genetic variation between both breeds. Aziz & Al-Haur (2013) observed Mahalanobis distance of 0.55 between two lines of goat and between Ardi and each of Line1 and Line2 were 25.03 and 21.45, respectively.
The dendogram (Figure 7) based on the average linkage methodshowed that there are two clusters; cluster one includes Manipur and Mizoram cows and cluster two Tripura cows those are clearly separated from cluster one.
Table 4. Mahalanobis distances between three different populations of indigenous cows in North East States
In the lower triangular probability of significance is shown
The individual assignment to different cattle populations by the Cross-validation classification was given in table 5. The proportion of individuals correctly assigned to their respective population is considered as a measure of the morphological distinctness of the population.High values of error 0.158, 0.179 and 0.201 were observed for Tripura, Mizoram and Manipur cattle populations, respectively. The reason for this misclassification may be a high degree of intermingling these populations as they are from the adjoining states. The high morphological distances between the cattle populations coupled with high correct assignment to source populations is an indication that they belong to different populations. But there was no distinct physical trait which could differentiate these populations.
State Tripura Mizoram Manipur
Tripura 0 9.72578 5.72089
Mizoram P<0.0001 0 4.65239
Manipur P<0.0001 P<0.0001 0 Canonical Discriminant Functions
F
un
cti
on
2
Figure 7. Dendogram showing similarity/distinctness in three indigenous cows populations Table 5. Percent of individual cows classified in to different populations of north east states
Population Tripura Mizoram Manipur Total
Tripura 106
(84.13)
7 (5.56)
13 (10.32)
126 (100)
Mizoram 4
(5.97)
55 (82.09)
8 (11.94)
67 (100)
Manipur 13
(8.44)
18 (11.69)
123 (79.87)
154 (100)
Error level 0.158 0.179 0.201 0.158
Priors 0.333 0.333 0.333
Yakubu et al. (2010a) reported that 85.48% of Bunaji cattle and 96.55% of Sokoto Gudali classified into their source population assigned correctly by the Nearest Neighbour Discriminant Analysis. Aziz & Al-Haur (2013) observed 100% assignment of Ardi animals into their genetic group and percentages of animals assigned in Line1 and line2 were 86.10 and 42.55, respectively. The use of multivariate discriminant analyses therefore could be successfully used in morphometric differentiation. Similar reports on goats (Dossa et al. 2007; Yakubu et al. 2010a; Yakubu et al. 2010b; Yakubu et al. 2010c), sheep (Traore et al. 2008; Yakubu & Akinyemi 2010), cattle (Ndumu et al. 2008) and buffalo (Johari et al. 2009) respectively were observed.
CONCLUSION
In the present study correct assignment of individual animals to their respective population ranged from 80 to 84% but we could not get a physical /discontinuous trait which can distinct these populations may be due to intermingling. Canonical discriminiantanalysis also showed that these three indigenous cow populations were overlapping, so we cannot conclude that they are distinct breeds.
REFERENCES
Capote J, Delgado JV, Fresno M, Camacho ME, Molina A.1998. Morphological variability in the Canary goat population. Small Rumin Res. 27:167-162.
Dossa LH, Wollny C, Gauly M. 2007.Spatial variation in goatpopulations from Benin as revealed by multivariate analysisof morphological traits. Small Rumin Res. 73:150-159
Herrera M, Rodero E, Gutierrez MJ, Pena F, Rodero JM. 1996. Application of multifactorial discriminant analysis in the morphostructural differentiation of Andalusian caprine breeds. Small Rumin Res. 22:39-47. Johari S, Kurnianto E, Sutopo S, Hamayanti WA. 2009. Multivariate analysis on phenotypic traits of body measurementin swamp buffalo (Bubalus bubalis). J Indones Trop Anim Agric. 34:289-294.
[LC] Livestock Census. 2012. Animal Husbandry Statistics. Department of Animal husbandry and Dairying, MoA, GOI, New Delhi.
Martins CEN, Quadros SAF, Trindade JPP, Quadros FLF,Costa JHC, Raduenz G. 2009. Shape and function in Braford cows: The body shape as an indicative of performance and temperament. Arch Zootec. 58:425-433.
Mukeherjee DK, Singh CSP, Mishra HR. 1979. A note on some phenotypic parameters in grey and brown Bengal goats. Indian J Anim Sci. 49:671-671.
Ndumu DB, Baumung R, Hanotte O, Wurzinger M, OkeyoMA, Jianlin H, Kibogo H,Solkner J. 2008. Genetic andmorphological characterization of the Ankole Longhorn cattle in the African Great Lakes region. Genet Sel Evol. 40:467-490.
Peter TB, Peters SO, Yakuba AA, Michael OO. 2012. Multivariate characterisation of the phenotypic traits of Djallonke and Sahel sheep in Northern Ghana. Trop Anim Health Prod. http://dx.doi.org/10.1007/s11-250-012-02114.
Pundir RK, Singh PK, Prakash B, Ahlawat SPS. 2007. Characterization and evaluation of Kenkatha breed in its native tract. Indian J Anim Sci. 77:177-180.
Pundir RK, Kathiravan P, Singh PK, Manikhandan VA. 2009. Bargur cattle: status, characteristics and performance. Indian J Anim Sci. 79:681-685.
Pundir RK, Singh PK, Singh KP, Dangi PS. 2011. Factor analysis of biometric traits of kankrej cows to explain body. Asian Aust J Anim Sci. 24:449-456.
Pundir RK, Singh PK, Sharma D, Saini A, Singh CV, Prakash B. 2012. Hill cattle of Pithoragarh district of Uttarakhand. Indian J Anim Sci. 82:1591-1593. Pundir RK, Singh PK, Neelkant, Sharma D, Singh CV,
Prakash B. 2013. Uttara- A new cattle germ plasm from Uttarakhand hills. Indian J Anim Sci. 83:51-58. [SAS] Statistical Analysis System. 2009. Statistical Analysis
System User’s guide: Release 9.2. SAS Institute, Inc., Cary, NC, USA.
Singh PK, Pundir RK, Kumarasamy P, Vivekanandav P. 2012. Management and physical features of migratory Pullikulam cattle of Tamilnadu. Indian J Anim Sci.
82:15287-90.
Traore A, Tamboura HH, Kabore A, Royo LJ, Fernandez I, Alvarez I, Sangare M, Bouchel D, Poivey JP, Francois D, Sawadogo L, Goyache F. 2008. Multivariate analyses on morphological traits of goats in Burkina Faso. Arch Tierz Dummerstorf. 6:588-600.
Yakubu A, Akinyemi MO. 2010. An evaluation of sexual size dimorphism in Uda sheep using multifactorial discriminant analysis. Acta Agriculturae Sci Section A. 60:74-78.
Yakubu A, Idahor KO, Haruna HS, Wheto M, Amusan S. 2010a. Multivariate analysis of phenotypic differenciation in Bunaji and Sokoto Gudali Cattle. Acta Agriculturae Solvenica A. 96:75-80.
Yakubu A, Salako AE, Imumorin IG. 2010b. Multivariate analysis of spatial patterns of morphological traits in West African Dwarf goats in three agro-ecological zones of Nigeria. J Appl Anim Res. 38:257-260. Yakubu A, Salako AE, Imumorin IG, Ige AO, Akinyemi MO.
2010c. Discriminant analysis of morphometric differentiation in the West African Dwarf and Red Sokoto goats. S Afr J Anim Sci. 40:381-387.
Isolation and Identification of Indigenous Lactic Acid Bacteria from North
Sumatra River Buffalo Milk
Rizqiati H1, Sumantri C2, Noor RR2, Damayanthi E3, Rianti EI4
1Graduate of Department of Animal Production and Technology, Bogor Agricultural University, Bogor 16680 2Department of Animal Production and Technology, Faculty of Animal Science, Bogor Agricultural University, Bogor 16680
3Department of Community Nutrition, Faculty of Human Ecology, Bogor Agricultural University, Bogor 16680 4ICABIOGRAD, Kampus Penelitian Pertanian Cimanggu, Bogor, Jl. Tentara Pelajar 3A, Bogor 16111
E-mail:[email protected]
(received 04-05-2015; revised 25-06-2015; accepted 29-06-2015)
ABSTRAK
Rizqiati H, Sumantri C, Noor RR, Damayanthi E, Rianti EI. 2015. Isolasi dan identifikasi bakteri asam laktat indigenus susu kerbau sungai Sumatera Utara. JITV 20(2): 87-94. DOI: http://dx.doi.org/10.14334/jitv.v20i2.1163
Susu kerbau merupakan salah satu sumber bakteri asam laktat (BAL) yang berpotensi sebagai kultur untuk starter maupun probiotik. Penelitian ini bertujuan untuk mengisolasi dan mengidentifikasi BAL asal susu kerbau sungai Sumatera Utara, serta menguji ketahanannya pada pH rendah. Bakteri asam laktat diisolasi dan ditumbuhkan pada medium De Man Rogosa Sharpe Agar (MRSA). Isolasi dilakukan sampai diperoleh kultur murni. Identifikasi BAL dengan pengujian karakteristik morfologi, fisiologi dan biokimia. Karakteristik morfologi dilakukan dengan pewarnaan Gram dan melihat bentuk sel. Karakteristik fisiologi dilakukan dengan uji ketahanan pada pH 4,5 dan suhu 45oC. Karakteristik biokimia dilakukan dengan uji produksi CO2, NH3 dan dekstran. Pengujian sifat probiotik dilakukan dengan menguji ketahanan isolat BAL pada pH rendah. Pengujian dengan kit API tes CHL 50 untuk mengetahui jenis spesies dari sepuluh BAL terpilih. Hasil identifikasi diperoleh 41 isolat BAL, yang secara umum memiliki karakterisitik Gram positif, katalase negatif, berbentuk batang dan bulat. Pengujian ketahanan BAL pada pH rendah (pH 2) menunjukkan penurunan jumlah populasi sebanyak 1,24±0,68 log cfu/ml. Isolat terbaik dari pengujian ketahanan pada pH rendah adalah isolat L12, L16, L17, L19, L20, M10, P8, S3, S19 dan S20. Hasil pengujian dengan API test CHL 50 pada sepuluh isolat terpilih tersebut menunjukkan ada empat spesies BAL dari susu kerbau sungai Sumatera Utara, yaitu Lactobacillus plantarum, L. brevis, L. pentosus dan Lactococus lactis.
Kata Kunci: Susu Kerbau, BAL, Isolasi, Identifikasi
ABSTRACT
Rizqiati H, Sumantri C, Noor RR, Damayanthi E, Rianti EI. 2015. Isolation and identification of indigenous lactic acid bacteria from North Sumatra river buffalo milk. JITV 20(2): 9-16. DOI: http://dx.doi.org/10.14334/jitv.v20i2.1163
Buffalo milk is a source of various lactic acid bacteria (LAB) which is potential as culture starter as well as the probiotic. This study was conducted to isolate and identify LAB from indigenous North Sumatra river buffalo milk. Lactic acid bacteria was isolated and grown in medium De Man Rogosa Sharpe Agar (MRSA). The isolation was conducted to obtain pure isolate. The identification of LAB was studied in terms of morphology, physiology, biochemistry and survival on low pH. Morphology tests were conducted by Gram staining and cell forming; physiology tests were conducted for growing viability at pH 4.5 and temperature at 45oC; whereas biochemistry tests were conducted for CO2, dextran and NH3 productions. Determination of LAB species was conducted using Analytical Profile Index (API) test CHL 50. Results of identification showed that 41 isolates were identified as LAB with Gram-positive, catalase-negative, rod and round shaped characteristics. Resistance test done to low pH (pH 2) for the lactic acid bacteria showed decrease of bacteria viability up to1.24±0.68 log cfu/ml. The resistant isolates at low pH were L12, L16, L17, L19, L20, M10, P8, S3, S19 and S20. Identification with API test CHL 50 for 10 isolates showed that four isolates were identified as Lactobacillus plantarum, L. brevis, L. pentosus and Lactococuslactis.
Key Words: Buffalo Milk, LAB, Isolation, Identification
INTRODUCTION
Milk is one of food stuffs that naturally containing Lactic Acid Bacteria (LAB) which is generally used for culture starter forming various processed food products. The LAB originated from milk is also potentially developed into probiotic for functional food
LAB isolation of various milk had been done, among others from raw cow milk (Abdullah & Osman 2010), goat milk (Tserovska et al. 2002; Setyawardani et al. 2013), Bima horse milk (Antara et al. 2009), wild horse milk (Sugitha et al. 2011), Sumbawa horse milk Sharma 2009; Patel & Patel 2012; Sharma et al. 2013; Shafakatullah & Chandra 2014; Kumar et al. 2014). In Indonesia, LAB isolation from the produced buffalo milk products had been done to produce a product of West Sumatran buffalo called “dadih” (Surono 2003; Sunaryanto & Marwoto 2013), whereas isolation and identification of LAB from fresh buffalo milk in Indonesia has not been much done.
North Sumatra river buffalo is one of genetic sources of Indonesian local animal which has not been explored. River buffalo milk production could reach 8 liter/day. Its quality was better compared to cow milk, where in the content of protein and fat was higher but its cholesterol content was lower (Damayanthi et al. 2014). Exploration of LAB from North Sumatra river buffalo and its utilization to produce the culture starter of probiotic product currently have not been much reported. This LAB exploration was first step to get probiotic bacteria candidate by testing several probiotic characteristics (Rizqiati et al. 2015); in further it was applied in mozzarella cheese into probiotic mozzarella cheese with North Sumatra river buffalo milk as raw material.
One condition for microorganism called as probiotic was its capability to survive in intestinal track condition such as endurance to low pH and bile salt (Nuraida et al. 2011). The first exposure of probiotic when entering the intestinal track was a gastric with pH around 2. Endurance test to low pH was needed to determine whether the LAB culture was survive in the gastric acid or not (Wildman & Medeiros 2000).
This study was aimed to isolate the LAB from North Sumatra river buffalo milk and identify it based on morphology, physiology, biochemical, and identify species of the LAB. Besides, this study was aimed to select LAB isolate which could survive in low pH (pH 2) which was one of probiotic characteristic tests. Isolation and identification results of LAB became first step of selection of LAB from North Sumatra river Patumbak, and Siborong-borong where from each location was taken 6 samples. The milk samples were brought in cold sterile tube in the cooling box to the Integrated Laboratory of Faculty of Animal Science of Bogor Agricultural University. Conducted tests were isolation and identification of LAB from the river buffalo milk. The isolation was done using media De Man Rogosa Sharpe (MRS). LAB identification consisted of characteristic of morphology, physiology, and biochemical. Characteristic tests of the probiotic were done by testing LAB resistance to low pH. LAB (10 ml) was taken aseptically and inserted into 90 ml of sterile physiological NaCl solution (0.85%), and further it was done a gradual dilution into 105 dilutions. One ml diluted sample was distributed on MRS agar (MRSA) media containing of bromo cresol purple (BCP) 0.01% on petridish, and then the samples were incubated anaerobically for 24 hours at 37oC. LAB colony seemed as colony which was surrounded by yellow zone, and further that colony was taken and scratched on MRSA media. That scratching was done continuously to obtain one pure colony.
Morphology characteristic to identify the LAB
Characterizing of cell morphology was aimed to see isolate form and Gram staining characteristic. Cell form was viewed by microscope and done after the Gram staining. Cell morphology expected was positive Gram with tube or oval cell (Iranmanesh et al. 2012).
Physiology characteristic to identify the LAB
environment with pH of 4.5 and in neutral condition (pH 7) as control, and further were incubated at 37oC for 7 days. Growth was marked by turbidity in the media (Aziz et al. 2009).
Biochemical characteristic to identify the LAB
Biochemical characteristic test to identify the LAB consisted of catalase test, production test of CO2, dextran, and NH3. CO2 production test was conducted to determine isolate capability to produce CO2 from glucose, which showed whether the isolate was homofermentative or heterofermentative. Catalase test was done to determine the isolate capability to produce catalase enzyme. Catalase test was done using hydrogenperoxide (H2O2) 3%. Dextran production test was done to determine whether the isolate could produce dextran (mucus formed) which was generally produced by Leuconostoc genus. NH3 production test was done to determine isolate which could produce ammoniac which was generally produced by
Streptococcus genus (Harrigan 1998).
Probiotic characteristic testing of LAB resistance in low pH
LAB resistance test to low pH was done using PBS media by regulating the pH into 2 using HCL 0.1 N and incubated for 3 hours at 27oC. LAB number was counted before and after the incubation. Cell number was counted by casting method using MRSA. Each test was done 3 times duple repetition (Lin et al. 2006).
LAB identification using kit API CHL 50
LAB identification using kit API CHL 50 (Biomerieux, France) was conducted to determine species of the LAB. The testing was done by 1 ose of LAB inserted into 10 ml MRSB media then incubated at 37oC for 24 hours. LAB culture was centrifuged 9800 x g for 10 minutes. Separated pellet was inserted into API 50 CHL media by sterile pipette and homogenized. The culture inserted into 50 pits of kit API CHL 50 strips. All of the pits were closed by paraffin oil to give anaerobic environment and incubated at 37oC for 24-48 hours. Testing parameter was color change from blue into yellow after incubation for 24-48 hours because of formation of acid which was detected by pH change. Observation result was processed by software ApiwebTM (Gawad et al. 2010).
RESULT AND DISCUSSION
LAB isolates
LAB isolation used MRSA media, added by BCP as bacteria indicator of acid former, where the isolate which produced acid, would form yellow zone. LAB colony appearance was in form of white oval surrounded by yellow zone. It was obtained 96 isolates from North Sumatra river buffalo milk from 4 locations, namely: Lubuk Pakam (L), Medan (M), Patumba (P),
Morphology characteristic of LAB isolate was identified through Gram staining. It showed that from 96 pure isolates which was isolated successfully from river buffalo milk, 84 isolates were positive Gram bacteria and 12 isolates were negative Gram bacteria. Test result of LAB cell form showed 19 of the 84 isolates were in oval form (22.6%) and 65 isolates were in tube form (77.4%). Lactic Acid Bacteria was in oval or tube form positive Gram bacteria, did not form spore, able to ferment carbohydrate, negative catalase, and
microaerophilic (Axel’s son 2004). In the testing of
morphology characteristic from 96 isolates, 84 isolates were of positive Gram bacteria. It was followed by physiology characterizing.
Physiology characteristic testing consisted of resistance to temperature and pH. It showed 78 of 84 isolates (92.8%) were resistant to high temperature and 6 isolates (7.1%) were not resistant to high temperature. Surono (2004) said that one of factors affected
bacteria’s growth was temperature. Elgadi et al. (2008) said that resistance of 14 isolates from fresh milk could grow at 45oC of temperature. According to El Soda et al. (2003), termophylic lactobacilli and cocci groups could grow at 45oC of temperature, but could not at 10oC of temperature. Mesophylic group could not grow at 45oC but could grow at 10oC of temperature. Mesophilic lactococci could grow at 10oC but could not grow at 45oC of temperature. Enterococci group could grow at 45oC and 10oC of temperature.
lived at 2 of pH was fewer. This type of bacteria had better ability to life in very acidic condition, and able to produce bigger organic acid number. Organic acid produced could be used to improve aroma, texture, and flavor of fermented products. In the physiology characteristic testing, 70 of 84 isolates were resistant to high temperature and low pH. It was followed by biochemistry characteristic testing.
Result of biochemistry characteristic testing showed that in testing of production of CO2 from glucose to 70 isolates of indigenous LAB of North Sumatra river buffalo milk showed that 21 isolates (30%) could produce CO2 (heterofermentative), whereas 49 isolates (70%) did not produce CO2 (homofermentative). Abdulah & Oman (2010) also reported similar result that homofermentative LAB number was found more in cow milk, cheese, and fermented milk. According to Axelsson (2004), based on fermentation pattern, LAB was divided into 3 groups, namely: homofermentative obligative, heterofermentative facultative, and heterofermentative obligate LAB.
Catalase testing showed that 52 of 70 isolates (74.3%) did not produce O2 vesicle, so that it was grouped into negative catalase bacteria, whereas 18 isolates (25.7%) produced O2 vesicle and grouped into positive catalase bacteria. Catalase testing was aimed to determine catalase enzyme presence in the culture of bacteria starter. Catalase enzyme production could be known by dripping H2O2 on bacteria preparate. If there was gas vesicle, it showed that the bacteria released O2 and grouped into positive catalase bacteria. Bacteria that did not release the O2 vesicle showed that the bacteria had peroxidase enzyme which could prevent O2 production and it was stated as negative catalase bacteria (Surono 2004).
Testing result of production of dextran from sucrose to 52 isolates of indigenous LAB of North Sumatra river buffalo milk showed that 4 isolates (7.7%) produced dextran positively, whereas 48 isolates (92.3%) did not produce dextran. It was concluded that the LAB isolates which did not produce dextran did not included into Leuconostoc group. One of characters of the Leuconostoc is dextran production visualized as
mucoid. Dextran was defined as water soluble polygosacaride formed from α1-6 glucosides with proportion of 0-20% (Sarwat et al. 2008).
Testing of 48 isolates in producing NH3 from arginine showed that isolates (14.6%) produced NH3 positively, whereas 41 isolates (85.4%) did not produce NH3. Isolates that produced NH3 did not selected to further testing because by producing NH3, it was feared will affect the product aroma. Tserovska et al. (2002) said that 60% of LAB from cheese and milk able to produce NH3 from arginine.
Research result of LAB identification by biochemistry characteristic testing showed that it was
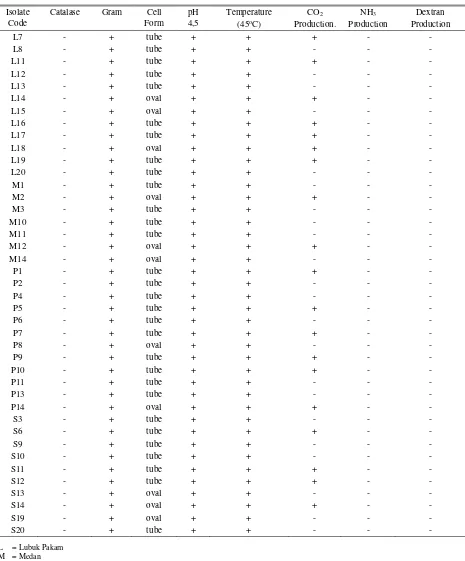
obtained 40 of 70 LAB isolates which meet LAB characteristics, so that it was continued to further test. The further test was probiotic characterizing to evaluate LAB resistance to low pH. LAB 41st characteristic identified successfully was presented in Table 1. LAB resistance testing of low pH
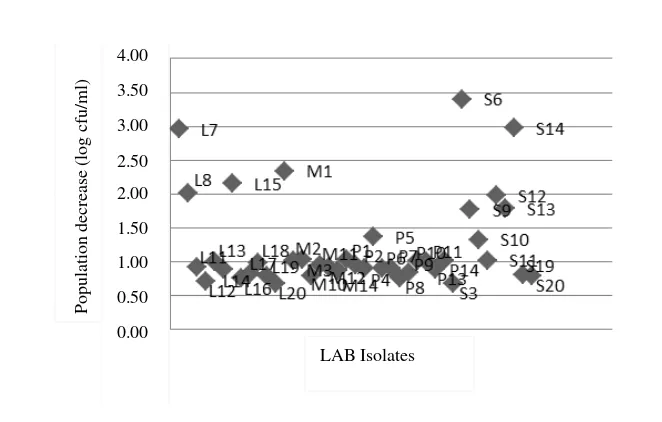
LAB isolates resistance to low pH was one of probiotic conditions, because stress of probiotic LAB was started at the time the LAB exposured by acidity condition of the gastric. According to Wildman & Medeiros (2000), gastric had around 2 of pH. Resistance testing of low pH was needed to determine capability of LAB culture of isolates of river buffalo milk to survive to the gastric acidity.
Figure 1, shows LAB population before and after exposured to low pH which experienced a population decline of 1.24±0.68 log cfu/ml. In other study, in LAB isolate from buffalo milk in India showed just 2 of 3 isolates tested that survived at 2 of pH for 3 hours incubation, whereas 1 isolate only survived for 1.5 hours (Shafakatullah & Chandra 2014). In the testing of LAB isolate from breast milk, all of the isolates experienced number cell decreasing with different decreasing value to each isolate with decreasing range around 0.57-7.24 log cfu/ml (Nuraida et al. 2011). Resistance testing at low pH of LAB isolate from goat milk showed that all of the tested isolates experienced population decrease less than 1 log cfu/ml (Setyawardani et al. 2014).
Ability to survive in better acidic condition for each isolate was showed by different cell number change of all tested isolates. According to Nuraida (2011), isolate ability to survive at this acidic condition was strain dependent. This was due to cytoplasm membrane difference of each bacteria. The difference affected characteristic and permeability of membrane.
Under acidic condition, LAB could maintain acidity of cytoplasm, so that protein and enzyme in the cell could still work optimally. LAB isolate was adaptable in low pH because it had an internal cell pH regulation. This can be achieved by existence of enzyme synthesis and producing proton (H+) from inside of the cell that was occurred through ATP hydrolysis (H+-ATPase) process. The Lactic Acid Bacteria was survive from acid damage because the existence of histidine decarboxylase and arginine of deaminase enzyme. LAB tolerance of high acidity was caused by its capability to maintain more alkaline pH of cytoplasm than extracellular pH (Pan et al. 2011).
Table 1. Identification of LAB isolates from North Sumatra river buffalo milk Isolate
Code
Catalase Gram Cell Form
pH 4,5
Temperature (45oC)
CO2 Production.
NH3 Production
Dextran Production
L7 - + tube + + + - -
L8 - + tube + + - - -
L11 - + tube + + + - -
L12 - + tube + + - - -
L13 - + tube + + - - -
L14 - + oval + + + - -
L15 - + oval + + - - -
L16 - + tube + + + - -
L17 - + tube + + + - -
L18 - + oval + + + - -
L19 - + tube + + + - -
L20 - + tube + + - - -
M1 - + tube + + - - -
M2 - + oval + + + - -
M3 - + tube + + - - -
M10 - + tube + + - - -
M11 - + tube + + - - -
M12 - + oval + + + - -
M14 - + oval + + - - -
P1 - + tube + + + - -
P2 - + tube + + - - -
P4 - + tube + + - - -
P5 - + tube + + + - -
P6 - + tube + + - - -
P7 - + tube + + + - -
P8 - + oval + + - - -
P9 - + tube + + + - -
P10 - + tube + + + - -
P11 - + tube + + - - -
P13 - + tube + + - - -
P14 - + oval + + + - -
S3 - + tube + + - - -
S6 - + tube + + + - -
S9 - + tube + + - - -
S10 - + tube + + - - -
S11 - + tube + + + - -
S12 - + tube + + + - -
S13 - + oval + + - - -
S14 - + oval + + + - -
S19 - + oval + + - - -
S20 - + tube + + - - -
Figure 1. Population decrease of LAB after it exposured by low pH Table 2. Identification of LAB species using API test CHL 50
Code of isolate
Name of LAB species Percentation (%)
L12 Lactobacillus pentosus 94.4
L16 Lactobacillus brevis 96.6
L17 Lactobacillus brevis 96.6
L19 Lactobacillus brevis 99.5
L20 Lactobacillus plantarum 99.9
M10 Lactobacillus plantarum 99.9
P8 Lactococcus lactis 96.2
S3 Lactobacillus plantarum 99.9
S19 Lactococcus lactis 96.2
S20 Lactobacillus plantarum 98.3
L= Lubuk Pakam; M= Medan; P= Patumbang; S= Siborong-borong
LAB identification using API test CHL 50
Identification of LAB species using API test CHL 50 was done to the best 10 isolates based on resistance testing to low pH. It was presented completely in Table 2. Testing by API test CHL 50 resulted in 4 LAB species, namely: Lactobacillus plantarum (4 isolates),
Lactobacillus brevis (3 isolates), Lactobacillus pentosus
(1 isolate) and Lactococus lactis (2 isolates).
L12 isolate was identified as Lactobacillus pentosus
with acid level of 94.4%, isolate L16, L17, and L19 were identified as L. brevis with acid level of 96.6%; 96.60%, and 99.50%, respectively. Isolate L20, M10,
S3, and S2 were identified as L. plantarum with same acid level of 96.20%. Based on genotyping testing result by analysis of gene 16 sequences of S rRNA and after alignment of nucleotide sequence from selected isolate (isolate S3) on GenBank database showed that S3 isolate had similarity to the isolates of L. plantarum
strain JCM 1149 with access code NCBI BLAST NR. 117813.1 with similarity level of 99% (unpublished data). This result showed that isolation and identification of API test CHL 50 was in line with the genotyping sequence of gene 16 S rRNA.
Testing result of species identification using API test CHL 50 of isolates from buffalo milk in India showed that there were 6 LAB species, namely: L. bulgaricus, L. plantarum, L. lactis, L. acidophilus, L. brevisand L. rhamnosus (Tambekar et al. 2009; Singh & Sharma 2009; Azis et al. 2009; Syafakatullah et al. 2014). LAB species testing of processed buffalo milk (cruds) in Indonesia showed that there were 6 LAB species, namely: L. brevis, L. plantarum, L. casei, L.
paracasei, Lactococcus lactis, Leuconostoc
mesenteroides (Surono 2003), whereas Sunaryanto & Mawoto (2012) identified successfully one of LAB species, namely: L. plantarum.
CONCLUSION
In this research 41 LAB isolates from North Sumatra river buffalo milk were isolated and identified. They survived successfully in low pH. Identification result of species tested by API test CHL 50 showed that from selected 10 isolates, 4 species were identified successfully, namely: Lactobacillus plantarum, L. brevis, L. pentosus and Lactococus lactis.
P
op
ulatio
n
de
cre
ase
(lo
g
cfu
/ml)
LAB Isolates 4.00
ACKNOWLEDGEMENTS
The author gratefully appreciate KKP3N program of Indonesian Agency for Agricultural Research and Development (IAADR), Ministry of Agriculture through SPK No.: 62/PL.220/I.1/3/2014.K on 10 March 2014 funded this research.
REFERENCES
Abbas MM, Mahasneh AM. 2015. Functional characteristics of Lactobacillus strains isolated from camel’s milk. Br J Med Med Res. 7:25-39.
Abdullah SA, Osman MM. 2010. Isolation and identification of lactic acid bacteria from raw cow milk, White Cheese and Rob in Sudan. Pak J Nutr. 9:1203-1206.
Ahmed T, Kanwal R, Athar IH, Ayub N. 2002. Isolation and identification of lactic acid producing bacteria from camel milk. Pak Vet J. 22:141-144.
Antara NS, Dibia IN, Aryanta WR. 2009. Karakterisasi Bakteri Asam Laktat yang diisolasi dari susu kuda Bima. Agritech. 29:1-9.
Axelsson L. 2004. Lactic acid bacteria: Classification and physiology. Dalam: Salminen S & Von Wright A, editor. Lactic Acid Bacteria: Microbiology and Functional Aspects. New York (USA): Marcel Dekker Inc. p. 1-73.
Aziz T, Khan H, Bakhtiar SM, Naurin M. 2009. Incidence dan relative abundance of lactic acid bacteria in raw milk of buffalo, cow and sheep. J Anim Plant Sci. 19:168-173. Damayanthi E, Yopi, Hasinah H, Setyawardani T, Rizqiati H,
Putra S. 2014. Karakteristik susu kerbau sungai dan rawa di Sumatera Utara. JIPI. 19:67-73.
Elgadi Z, Abdel GWS, Dirar NA. 2008. Isolation and identification of lactic acid bacteria and yeast from raw milk in Khartoum State (Sudan). Res J Microbiol. 3:163-168.
ElSodaM, AhmedN, Omran N, Osman G, Morsi A. 2003.Isolation, identification and selection of lactic acid bacteria cultures for cheese making. Emir J Agric Sci 15:51-71.
Fowoyo PT, Ogunbanwo ST. 2010. Phenotypic diversity of lactic acid bacteria isolated from Massa, a fermented maize dough. Afr J Microbiol Res. 4:2682-2691. Gawad AE, Fatah AE, Rubayyi A. 2010. Identification and
characterization of dominant lactic acid bacteria isolated from traditional rayeb milk in Egypt. J Am Sci. 6:728-735.
Harrigan WF. 1998. Laboratory methods in food microbiology. New York (USA): Academic Press. Iranmanesh M, Ezzatpanah H, Mojgani N, Torshizi MAK,
Aminafshar M, Maohamadi M. 2012. Isolation of lactic acid bacteria from Ewe milk, traditional yoghurt and sour buttermilk in Iran. Eur J Food Res Rev. 2:79-92
Khedid K, Faid M, Mokhtari A, Soulaymani A, Zinedine A. 2009. Characterization of lactic acid bacteria isolated from the one humped camel milk produced in Morocco. Microbiol Res. 164:81-91.
Kumar R, Pandey S, Kapoor P, Awasthi S, Bhatnagar T. 2014. Isolation and characterization of endemic strains of Lactobacillus sp. and evaluation of their probiotic activity. Int J Curr Microbiol App Sci. 3:907-916. Lin WH, Wang CFH, Chen LW, Tsen HY. 2006. Viable
counts, characteristic evaluation for commercial lactic acid bacteria product. Food Microbiol. 23:78-81. Nuraida L, Winarti S, Hana, Prangdimurti E. 2011. Evaluasi
in vitro terhadap kemampuan isolate bakteri asam laktat asal air susu ibu untuk mengasimilasi kolesterol dan mendekonjugasi garam empedu. J Teknologi Industri Pangan. 22:46-52.
Pan DD, Zeng QX, Yan YT. 2011. Characterisation of Lactobacillus fermentum SM-7 isolated from koumiss, a potential probiotic bacterium with cholesterol-lowering effects. J Sci Food Agric. 91:512-518.
Patel N, Patel V. 2012. Isolation, identification and antimocrobial activity determination of lactic acid bacteria from buffalo milk in Gujarat state India. Int J Pharm World Res. 3:1-8.
Rizqiati H, Sumantri C, Noor RR, Damayanthi E, Rianti EI. 2015. Characteristics of indigenous probiotic from river buffalo milk in North Sumatera Indonesia. Int J Sc Basic Appl Res. 22:113-120.
Roberfroid MB. 2000. Prebiotics and probiotics: are they functional food?. Am Clin Nutr. 71:1682S-1687S. Sarwat F, Ali S, Qader, Aman A, Ahme N. 2008. Production
and characterization of a unique dextran from an indigenous Leuconostoc mesenteroides CMG713. Int J Biol Sci. 4:379-386.
Shafakatullah N, Chandra M. 2014. Screening of row
buffalo’s milk from Karnataka for potential probiotic
strains. Res J Resecnt Sci. 3:73-78.
Sharma R, Sanodiya BS, Thakur GS, Jaiswal P, Pal S, Sharma A, Bisen PS. 2013. Characterization of lactic acid bacteria from raw milk samples of cow, goat, sheep, camel and buffalo with special eludation to lactic acid production. Br Microbiol Res J. 3:743-752.
Singh GP, Sharma RR. 2009. Dominating species of Lactobacilli and Leuconostoc present among the lactic acid bacteria of milk of different cattles. Asian J Exp Sci. 23:173-179.
Sugitha IM, Arisandhi PW, Sinaga KYRH. 2011. Isolasi Bakteri Asam Laktat susu kuda liar sebagai starter dadih. The Excellence Research Universitas Udayana. Bali. p. 121-125
Sunaryanto R, Marwoto B. 2013. Isolasi, identifikasi dan karakterisasi bakteri asam laktat dari dadih susu kerbau. J Sains Teknologi Indonesia. 14:228-233.
Surono IS. 2003. In vitro probiotic properties of indigenous dadih lactic acid bacteria. Asian-Aust J Anim Sci. 16:726-731.
Surono IS. 2004. Probiotik: Susu fermentasi dan kesehatan. Jakarta (Indonesia): PT Tri Cipta Karya.
Setyawardani T, Rahayu WP, Maheswari RRA, Palupi NHS. 2013. Identification and characterization of probiotic lactic acid bacteria isolated from indigenous goat milk. J Anim Prod. 1:57-63.
Tambekar DH, Bhutada SA, Choudhary SD, Khond MD. 2009. Assessment of potensial probiotic bacteria isolated from milk of domestic animals. J Appl Bio. 15:815-819.
Tserovska L, Stefanova S, Yordanova T. 2002. Identification of lactic acid bacteria isolated from katyk, goat’s milk
and cheese. J Cult Coll. 3:48-52.
Effectivity of Probiotic, Micromineral Enriched Yeast and Their
Combination with
Azadirachta indica
Leaves Containing Tannin on
Fermentability and Digestibility of
Pennisetum
hybrid
Sofyan A, Sakti AA, Karimy MF, Julendra H, Istiqomah L, Herdian H, Damayanti E, Suryani AE
Division of Animal Feed and Nutrition, Research Unit for Processes Development and Chemical Engineering (BPPTK), Indonesian Institute of Sciences (LIPI), Jl. Jogja-Wonosari Km. 31.5, Gading, Playen, Gunungkidul, DI Yogyakarta 55861
Telephone/Faximile: 0274-392570/391168 E-mail: [email protected]/[email protected]
(received 16-02 2015; revised 13-03-2015; accepted 17-03-2015)
ABSTRAK
Sofyan A, Sakti AA, Karimy MF, Julendra H, Istiqomah L, Herdian H, Damayanti E, Suryani AE. 2014. Efektivitas probiotik, mikromineral terkorporasi khamir yang dikombinasikan dengan daun Azadirachta indica mengandung tanin terhadap fermentabilitas dan kecernaan Pennisetum hybrid. JITV 20(2): 95-104. DOI: http://dx.doi.org/10.14334/jitv.v20i2.1164
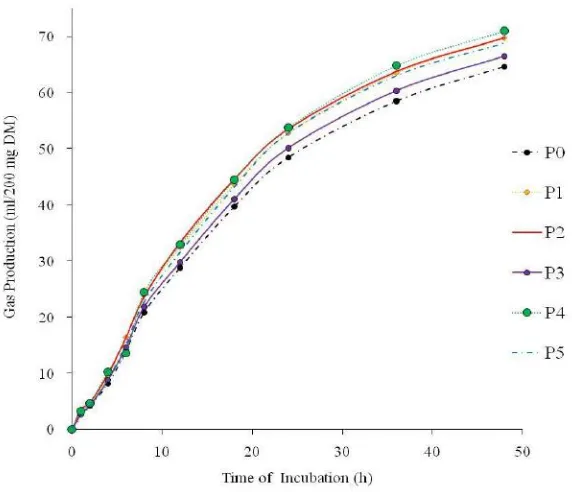
Eksplorasi imbuhan pakan organik untuk ternak saat ini terus dilakukan untuk menggantikan antibiotik sebagai pemacu pertumbuhan. Probiotik dari bakteri asam laktat telah digunakan secara luas untuk mendukung keseimbangan mikroba saluran pencernaan. Selain itu, mineral organik ditambahkan pada pakan untuk meningkatkan ketersediaan dalam mencegah kelainan metabolisme akibat defisiensi mineral. Penelitian ini bertujuan untuk mengevaluasi penambahan probiotik (Pediococcus acidilactici RS2) dan mikromineral terkorporasi khamir/micromineral enriched yeast (MEY) yang dikombinasikan dengan tanin dari daun mimba (Azadirachta indica) terhadap fermentabilitas rumput Raja (P. hybrid) dengan menggunakan teknik produksi gas in vitro. Perlakuan terdiri dari P0 (kontrol/hijauan tanpa imbuhan), P1 (P0+MEY); P2 (P0+MEY+tanin); P3 (P0+Probiotik); P4 (P0+Probiotik+MEY), dan P5 (P0+Probiotik+MEY+tanin) yang disusun dalam rancangan acak lengkap dengan 3 ulangan setiap perlakuan. Suplementasi MEY (P1), probiotik+MEY (P4) dan probiotik+MEY+tanin (P5) nyata (P<0,05) meningkatkan produksi gas hijauan tanpa berpengaruh pada asam lemak volatil (VFA), jumlah protozoa, produksi metana dan kecernaan in vitro. Produksi gas tertinggi tercatat pada hijauan yang diberi perlakuan P4 diikuti P5, P1, P2, P3 dan kontrol. Pengaruh perlakuan terhadap kinetika produksi gas menunjukkan perbedaan yang nyata pada inkubasi setelah 8 jam. Walaupun perlakuan hanya berpengaruh terhadap kinetika produksi gas (b, c dan total gas), berdasarkan analisis kluster-hirarki menunjukkan beberapa parameter yang terdiri dari asetat, propionat, kecernaan in vitro, jumlah protozoa dan produksi gas metana sangat berkorelasi dengan parameter kinetika produksi gas. Dapat disimpulkan bahwa fermentabilitas hijauan dapat ditingkatkan dengan suplementasi mineral organik maupun kombinasinya dengan probiotik maupun probiotik+tanin tanpa berpengaruh negatif terhadap kecernaan in vitro.
Kata Kunci: Fermentabilitas, Kecernaan In Vitro, Mineral Organik, Probiotik, Tanin
ABSTRACT
Sofyan A, Sakti AA, Karimy MF, Julendra H, Istiqomah L, Herdian H, Damayanti E, Suryani AE. 2015. Effectivity of probiotic, micromineral enriched yeast and their combination with Azadirachta indica leaves containing tannin on fermentability and digestibility of Pennisetum hybrid. JITV 20(2): 95-104. DOI: http://dx.doi.org/10.14334/jitv.v20i2.1164
Organic additive for animal had been explored to replace antibiotic growth promoter. Probiotic from lactic acid bacteria was widely used to support the microbial balances in digestive tract, while organic mineral was added into diets to improve bioavailability for preventing mineral deficiency disorders. This experiment was aimed to assess probiotic (Pediococcus acidilactici RS2) and micromineral enriched yeast (MEY) combined with tannin from neem (Azadirachta indica) leaves containing tannin on king grass (P. hybrid) fermentability using in vitro gas production technique. Treatments consisted of P0 (control/forage without additive), P1 (P0+MEY); P2 (P0+MEY+crude tannin); P3 (P0+Probiotic); P4 (P0+Probiotic+MEY), and P5 (P0+Probiotic+MEY+crude tannin). The study was arranged in a completely randomized design (CRD) with three replications in each treatment. Probiotic, MEY or tannin supplementation significantly increased (P<0.05) gas production without affecting volatile fatty acid, protozoa numbers, methane production and in vitro digestibility of forage. The highest cumulative gas production was found in forage treated by P4 followed by P5, P1, P5, P2, P3 and control. Kinetic of gas production was significantly affected by treatments after 8 h incubation. Although the treatments were only significantly affected gas production kinetic (b, c and total gas), the hierarchical cluster analysis indicated that some parameters consisted of acetate, propionate, in vitro digestibility, protozoa numbers, and methane production were closely correlated to the gas production kinetic parameters. It was concluded that either organic mineral supplementation or its combination with probiotic, and probiotic+tannin improved fermentabilty of forage without negative effect on in vitro digestibility.