386$73(1(/,7,$1'$13(1*(0%$1*$13(7(51$.$1
%$'$13(1(/,7,$1'$13(1*(0%$1*$13(57$1,$1
.(0(17(5,$13(57$1,$1
9RO1R6HSWHPEHU-XUQDO,OPX7HUQDNGDQ9HWHULQHU
-XUQDO,OPX7HUQDNGDQ9HWHULQHU
9ROXPH1XPEHU-XQH,661(,661;5HJLVWHUHGLQ
'LUHFWRU\RI 5HVHDUFK -RXUQDOV ,QGH[LQJ /,672)&217(17
3DJH 0XOWLYDULDWH DQDO\VLV RI PRUSKRPHWULF WUDLWV RI WKUHH GLIIHUHQW LQGLJHQRXV FDWWOH
SRSXODWLRQV
IURP1RUWK(DVWVWDWHVRI,QGLD3XQGLU5.6LQJK3.6DGDQD'.
,VRODWLRQ DQG LGHQWLILFDWLRQ RI LQGLJHQRXV ODFWLF DFLG EDFWHULD IURP 1RUWK 6XPDWHUD
ULYHUEXIIDORPLON5L]TLDWL+6XPDQWUL&1RRU55'DPD\DQWKL(5LDQWL(, (IIHFWLYLW\RISURELRWLFPLFURPLQHUDOHQULFKHG\HDVWDQGWKHLUFRPELQDWLRQZLWK
$]DGLUDFKWDLQGLFDOHDYHVFRQWDLQLQJWDQQLQRQIHUPHQWDELOLW\DQGGLJHVWLELOLW\RI 3HQQLVHWXP
K\EULG
6RI\DQ$6DNWL$$.DULP\0)-XOHQGUD+,VWLTRPDK/+HUGLDQ+'DPD\DQWL
(6XU\DQL$(
3URGXFWLYLW\ RI&DOOLDQGUD FDORWK\UVXV,QGLJRIHUD ]ROOLQJHULDQD DQG*OLULFLGLD VHSLXP
RQDFLGVRLOLQWKHJUHHQKRXVH+HUGLDZDQ,6XWHGL(
0ROHFXODUDQDO\VLVRIKHPDJJOXWLQLQJHQHRI$YLDQ,QIOXHQ]DYLUXVHVLVRODWHGLQ
.XUQLDVLK 6: 6RHMRHGRQR 5' 0D\DVDUL 1/3,
7KHUHOLDELOLW\RI',9$WHVWEDVHGRQ0HSHSWLGHH[FHHGWKRVHRQ+$RU16 SHSWLGHV
7DULJDQ66XPDUQLQJVLK,JQMDWRYLF-
1HZFDVWOH
'LVHDVH9LUXVLQIHFWLRQVWXG\RQGXFNDQGFKLFNHQLQ6XEDQJGLVWULFW3DQXV$6HWL\DQLQJVLK60D\DVDUL1/3,
&XUFXPLQ
HIIHFWRQ%OHRPXFKLQLQGXFHGSXOPRQDU\ILEURVLVLQ0XVPXVFXOXV
5DKPL$6HWL\RQR$-XQLDQWLWR9
$FNQRZOHGJHPHQW
,QGRQHVLDQ-RXUQDORI$QLPDODQG9HWHULQDU\6FLHQFHV
-XUQDO,OPX7HUQDNGDQ9HWHULQHU
,QGRQHVLDQ-RXUQDORI$QLPDODQG9HWHULQDU\6FLHQFHV
'LUHFWRU\RI
5HVHDUFK
-,79 9ROXPH 1XPEHU 3DJH %RJRU6HSWHPEHU ,661
,661
(,661[
$FFUHGLWHGE\/,3,
&HUWLILFDWH1XPEHU$830,/,3,
9ROXPH
1XPEHU
6HSWHPEHU
Ǥ
2SHQ FDGHPLF$ -RXUQDOV QGH[,
'$ -
'LUHFWRU\RIDEVWUDFWLQGH[LQJIRU-RXUQDOV,
ZZZ
GDLMRUJ
,3,
DO@<>OJM
><?@HD>>D@IODAD>JPMI<GNΒ Η Ν Ύ Λ Η Ί Ν Β Θ Η Ί Ε
ΒΗΎΡ
ΌΘΙΎΛΗΒΌΞΜ
)RRGDQG $JULFXOWXUH 2UJDQL]DWLRQ RIWKH 8QLWHG1DWLRQV 'LUHFWRU\RI 5HVHDUFK -RXUQODV ,QGH[LQJ
and
... 167 of
... 174 zed
.... 183
nel
.... 192 eric
... 199 ck
... 206 ium
... 213
loro
... 223 yer
Indonesian Journal of Animal and Veterinary Sciences
JITV Volume 20 Number 3 Page 159-232 Bogor, September 2015 ISSN 0853-7380 E-ISSN 2252-696X
Editor PREFACE
Research findings would be beneficial if they are presented and widely distributed to wider audiences. This journal brings you the latest research results in animal production and veterinary technologies from Egypt and Indonesia.
In this edition, volume 20 no. 3 September 2015, we proudly present articles from various disciplines such as Animal breeding; food technology; feed technology; forages technology; and veterinary technology. The articles published in this edition are: "Multi-trait and multi-source selection indices for milk production and reproductive traits in a herd of Holstein cattle in Egypt"; "Heritability estimation and non-genetic factors affecting production traits of Indonesian Ongole cross"; "Antimicrobial and anti-oxidative activities of peptides from goat milk hydrolyzed with various protease"; "Effect of enzyme supplementation on nutritive values of fermented palm kernel cake used to substitute soybean meal in broiler diet"; "Administration of extract Salix tetrasperma combined with turmeric and neem extract to improve eggs quality of chicken reared under heat stress"; "Lipid profiles of blood serum and fatty acid composition of meat of hybrid duck fed diet with Noni (Morinda citrifolia) fruit meal"; "Production and quality of Murdannia bracteata biomass as impact of magnesium foliar fertilizer"; “Pathological changes of suspected tetrachloro dibenzo-ɐ-dioxins/tetrachloro dibenzofurans toxication in beef cattle” and "Circulating H5N1 virus among native chicken living around commercial layer farms".
Hopefully these articles would offer any benefit to readers and the end-users of technological innovation, and attract interests from other authors to contribute in the future.
Bogor, September 2015
Chief Editor
Advisor:
Head of Indonesian Center for Animal Research and Development
Chief Editor:
Prof. Dr. Ismeth Inounu, M.S. (Animal Breeding and Genetic)
Vice Chief Editor:
Dr. Dra. M.B. Tresnawati Purwadaria (Agricultural Biotechnology)
Editorial Members:
Dr. Ir. R.A. Yeni Widiawati (Animal Feed and Nutrition) Prof. Dr. Sofjan Iskandar, M.Rur.Sc. (Animal Feed and Nutrition) Ir. Bambang Setiadi, M.S. (Animal Breeding and Genetic)
Dr. Ir. Dwi Yulistiani, M.App.Sc. (Ruminant Nutrition)
Dr. Ir. L. Hardi Prasetyo, M.Agr. (Animal Breeding and Genetic) Dr. Drs. Simson Tarigan, M.Sc. (Pathology)
drh. Suhardono, M.V.Sc., Ph.D. (Parasitology)
Dr. Raphaella Widiastuti, B.Sc. (Pathology and Toxicology)
Technical Editors:
Linda Yunia, S.E.
Rahmawati Elvianora Pulungan Ahmadi Riyanto, Sm.Hk. M. Indra Fauzy, A.Md.
English Editor:
Ir. Nurhasanah Hidajati
English Translator:
Cahyatina Tri Rahayu, S.Pt.
Published by:
Indonesian Center for Animal Research and Development
Indonesian Agency for Agricultural Research and Development Ministry of Agriculture
Collaborated with:
Secretariat of IJAVS:
Pajajaran St. Kav. E. 59, Bogor 16128 - Indonesia Telephone (0251) 8322185
Fax (0251) 8380588
E-mail: [email protected]; [email protected]
Website: http://medpub.litbang.pertanian.go.id/index.php/jitv/index
Indonesian Journal for Animal and Veterinary Sciences is published four times a year in March, June, September and December.
Complete paper may be accessed through: http://medpub.litbang.pertanian.go.id/index.php/jitv/index
http://peternakan.litbang.pertanian.go.id/index.php?option=com_content&view=article&id=3633&Itemid=119 through database CAB DIRECT (www.cabdirect.org)
Indonesian Journal of Animal and Veterinary Sciences
Volume 20, Number 3, September 2015 ISSN 0853-7380 E-ISSN 2252-696X
LIST OF CONTENT
Page Multi-trait and multi-source selection indices for milk production and
reproductive traits in a herd of Holstein cattle in Egypt
Faid-Allah E ... 159-167
Heritability estimation and non-genetic factors affecting production traits of Indonesian Ongole cross
Hartati, Muladno, Jakaria, Priyanto R, Gunawan A, Aryogi, Talib C ... 168-174 Antimicrobial and antioxidative activities of peptides from goat milk hydrolyzed
with various protease
Kusumaningtyas E, Widiastuti R, Kusumaningrum HD, Suhartono MT ... 175-183 Effect of enzyme supplementation on nutritive values of fermented palm kernel
cake used to substitute soybean meal in broiler diet
Sinurat AP, Purwadaria T, Purba M ... 184-192
Administration of extract Salix tetrasperma combined with extract of turmeric and neem to improve eggs quality of chicken reared under heat stress
Sugito, Hambal M, Isa M, Nurliana, Delima D ... 193-199
Lipid profiles of blood serum and fatty acid composition of meat of hybrid duck fed diet supplemented with Noni (Morinda citrifolia) fruit meal
Kurniawan D, Widodo E, Djunaidi IH ... 200-206 Production and quality of Murdannia bracteata biomass as impact of magnesium
foliar fertilizer
Rahmawati T, Abdullah L, Prihantoro I ... 207-213 Pathological changes of suspected tetrachloro dibenzo--dioxins/tetrachloro
dibenzofurans toxication in beef cattle
Sani Y, Indraningsih ... 214-223
Circulating H5N1 virus among native chicken living around commercial layer farms
Tarigan S, Indriani R, Ignjatovic J ... 224-232
Multi-Trait and Multi-Source Selection Indices for Milk Production and
Reproductive Traits in a Herd of Holstein Cattle in Egypt
Faid-Allah E
Department of Animal Production, Faculty of Agriculture, Minoufiya University, Egypt E-mail: [email protected]
(received 30-06-2015; revised 24-07-2015; accepted 28-08-2015)
ABSTRAK
Faid-Allah E. 2015. Indeks seleksi multi-trait dan multi-source untuk sifat-sifat produksi susu dan reproduksi pada sapi Holstein di Mesir. JITV 20(3): 159-167. DOI: http://dx.doi.org/10.14334/jitv.v20i3.1182
Penelitian ini dilakukan dengan tujuan mencari kemungkinan meningkatkan produksi susu dan reproduktifitas sapi Holstein melalui pemanfaatan metode indeks seleksi yang meliputi indeks berikut: umum, tidak lengkap, sub dan multi informasi (Own-Performance, Full-Sibs and Half-Sibs). Data diperoleh dari peternakan komersial (Safi Masr for Developing the Animal Resources), berlokasi di Delta sungai Nil, Dakahlia, Mesir. Data meliputi 4791 catatan dari 1797 ekor sapi, 794 induk dan 76 pejantan yang mewakili catatan pada kurun waktu 2002 sampai 2012. Estimasi parameter genetika dan phenotipik untuk penelitian trait/sifat dihitung dan digunakan untuk membentuk 18 indeks seleksi guna meningkatkan produksi susu dan reproduksi. Indeks penuh melibatkan produksi susu 305 hari (305-dMY), periode laktasi (LP), days open (DO) dan umur beranakn pertama (AFC) mempunyai korelasi paling tinggi dengan nilai aggregate breeding (Rih = 0.518; RE=100%).
Korelasinya berada pada 0,455 bila 305-dMY dihilangkan dari index. Index umum mempunyai pendugaan genetic yang maximum pada 305-dMY (132.6 kg) per generasi diikuti dengan menurunnya LP (-4,679 hari), DO (-3.449 day) dan AFC (-1,41 bulan) jika ke empat sifat dimasukkan ke dalam index (I 1). Pendugaan genetik untuk 305-dMY menurun sampai
26,84kg/generasi bila 305-dMY dihilangkan dari dari index 5 (I5). Selanjutnya menggunakan informasi multi-sumber akan
meningkatkan korelasi dengan nilai aggregate breeding (Rih= 0.740; RE=142.91%) dan meningkatkan pendugaan peningkatan
genetik tiap generasi untuk 305-dMY (209 kg) dan menurunkan pendugaan peningkatan genetik untuk LP (-6,37 hari), DO (-4,244 hari) dan AFC (1,843 bulan) apabila keempat trait/sifat dimasukkan kedalam index (I16). Dapat disarankan untuk
menggunakan indeks yang lebih tinggi untuk Rih (I1 (RE=100)) untuk meningkatkan produksi susu dan sifat reproduksi pada sapi
Holstein berdasarkan strategi performannya sendiri dan menggunakan (I16 (RE=142.91)) berdasarkan strategi multi-sumber untuk
mendapatkan akurasi yang tinggi dan perubahan genetik harapan yang tinggi per generasi dibandingkan dengan indeks general.
Kata Kunci: Bobot Badan, Parameter Genetik, Selection Index, Sapi Holstein
ABSTRACT
Faid-Allah E. 2015. Multi-trait and multi-source selection indices for milk production and reproductive traits in a herd of Holstein cattle in Egypt. JITV 20(3): 159-167. DOI: http://dx.doi.org/10.14334/jitv.v20i3.1182
The main aim of this study was explore possibility to improve milk production and reproductive traits of Holstein cattle via selection index method which include general, reduced, sub and Multi-source of information indices (Own-Performance, Full-Sibs and Half-Full-Sibs). Data was obtained from a commercial farm (Safi Masr for Developing the Animal Resources), located in the Nile Delta, Dakahlia, Egypt. Data included 4791 records of 1797 cows, 794 dams and 76 sires that represented the period from 2002 to 2012. Estimates of genetic and phenotypic parameters for studied traits were computed and used to construct 18 selection indices to improve milk production and reproductive traits. Full index incorporating milk yield at 305d (305-dMY), lactation period (LP), days open (DO) and age at first calving (AFC) had the highest correlation with aggregate breeding value (Rih = 0.518; RE=100%). The correlation fell to 0.455 when 305-dMY was omitted from the index. The general index has the
maximum expected genetic gain in 305-dMY (132.6 kg) per generation were accompanied by decrease of LP (-4.679 day), DO (-3.449 day) and AFC (-1.41 month) when all four traits were included in the index (I 1). The expected genetic gain for 305-dMY
decreased to 26.84 kg/generation when 305-dMY was excluded in index 5 (I5). In addition, Using multi-source of information
will enhance correlation with aggregate breeding value (Rih= 0.740; RE=142.91%) and raised the expected genetic gain per
generation for 305-dMY (209 kg) and decreasing the expected genetic gain for LP (-6.37 day), DO (-4.244 day) and AFC (1.843 month) when all four traits were included in the index (I16). It could be suggested using the higher indexes of Rih (I1 (RE=100)) to
improve milk production and reproductive traits in Holstein cattle under own-performance strategy and using (I16 (RE=142.91))
under multi-source strategy to get high accuracy and higher expected genetic changes per generation compare to general index.
INTRODUCTION
Breeding programs are basically designed to identify superior genotypes for different traits of economic interest, based on performance information of animals and their relatives, in order to disseminate their genes in the population. Literature shows that the implementation of selection indexes was an important step in the evolution of the dairy industry in the developed countries (Cardoso et al. 2014).
Increasing use of selection indices and greater scope in number of traits has been observed in dairy cattle populations in the past two decades included main components related to production, durability, health and reproduction in each selection index (Miglior et al. 2005). The traits that were considered for selection were milk yield, daily gain, weaning weight, calving interval, milk fat yield, productive lifetime, pre-weaning survival rate, post-pre-weaning survival rate and age at first calving. Age at first calving and calving interval are important because they determine the days a cow is in milk and the number of calves in the productive lifetime for replacement or sale (Wahinya et al. 2015).
Multiple trait selection index is widely accepted as the method of choice when improvement is desired for more than one trait (Banga 2009). Undesirable effects were observed on traits with unfavorable correlations with milk production, such as decline in fertility. As information on other traits related to health, fertility and longevity started being recorded and genetic evaluations for these traits were performed, they were gradually included as breeding goals of dairy cattle (Norman et al. 2010).
This study was carried out to investigate the possibility to improve milk production and reproductive traits of Holstein cattle via selection index method under two strategies, own-performance strategy to use easy index and multi-source of information strategy to get high accuracy and higher expected genetic changes per generation compare to general index when more information is used.
MATERIALS AND METHODS
Data, Feeding and management: Data of Holstein cattle were obtained from a commercial farm (Safi Masr for Developing the Animal Resources), located at the Nile Delta, Dakahlia, Egypt. Data were comprised of 4791 records of 76 sires and 794 dams from the year 2002 to 2012. Genetic and non-genetic factors as sire, parity (1st to ≥6th), year of calving (2002 to 2012) and
calving season (winter from 22/12 to 21/3, spring form 22/3 to 21/6, summer from 22/6 to 21/9 and autumn from 22/9 to 21/12). Animals were housed free in shaded open yards, grouped according to average daily
milk yield, and fed on TMR system a round year as recommended by NRC (2001). Holstein heifers were artificially inseminated (imported semen of Holstein sires) for the first time when reaching 350:370 kg of weight and pregnancy was detected by rectal palpation at 60 days after service. The cows were machine milked three times per day. Studied traits are 305-day milk
Genetic parameters: The genetic parameters were estimated by derivative free REML with a simplex algorithm using the Multiple Trait Derivative-Free Restricted Maximum Likelihood (MTDFREML) program of Boldman et al. (1995). The animal model in matrix notation as follow:
Y = Xb + Za + e in combinations to construct 18 selection indexes grouped under two strategies based on (305-dMY, LP, DO and AFC) as follows: Strategy 1: own-performance. Strategy 2: Multi-source of information (Own-Performance, Full-Sibs and Half-Sibs). The Selection criterion and the selection objectives are the same.
General Selection Index: Selection Index Program
where:
P = Phenotypic variances (cov.) matrix G = Genetic variances (cov.) matrix a = Economic weights column vector b = Weighting factors column vector
Reduced selection index: The reduced selection index can be developed by omitting one or more traits from the original index. In relation to the original index the efficiency of the new index, the reduced one, is expected to be decreased depending on the value of the omitted trait in the original index.
Sub-selection index: The sub-index of each trait was achieved by solving the following equation according to Cunningham (1969):
b = P-1 G
where:
b = Weighting factors vector for the sub index P-1 = P matrix inverse
G = Covariance vector between the variables in the index and the main trait in the aggregate genotypes
Multi-Source selection index: The sources of information used in different combinations for each trait were individual's own phenotypic value (OP), its full (FS) and half sibs (HS) averages. The general outline of the selection indices for ranking of the breeding value
The P and G matrices, respectively consisting of the variances (cov.) from OP, FS and HS family sources were obtained for animals. Estimation of genetic and phenotypic variances (cov.) for FS and HS performance for the P and G matrix were estimated according to the procedures given by Liljedahl et al. (1979) as follow:
σpijpi' j'= C1 σpipi'+ C2 σAiAi' for P matrix
σpijAi = CσAiAi' (i = i' or i ≠ i') for G matrix
where:
σpij = Phenotypic variances (cov.) between traits
in i and i' (i = i' or i ≠ i')
σAiAi' = Additive genetic variances (cov.) or
between traits in i and i' (i = i' or i ≠ i')
The procedures for obtaining C1 and C2 values for each element in P matrix and C values for each element in G matrix have been utilized according to Liljedahl et al. (1979).
Properties of the selection index: the properties of the selection index according to Cunningham (1969) were calculated as following:
1. Standard deviation of the index (i) = √b'Pb 2. Standard deviation of the aggregate genotype
(t) = √a'Ga
3. Correlation between the index and the aggregate genotype (RIH )= i/t P = Phenotypic variances (cov.) matrix B = Weighting factors column vector wii =a diagonal element of p-1
Expected genetic change G (EG): EG for each trait, after one generation of selection on the index (i = 1) was obtained by solving either of the following equations (Van der Werf & Goddard 2003):
Gi= (ib’ Gi)/i where:
i = Selection intensity
I = Standard deviation of the index Gi = the ith column of the G matrix
The relative economic value (Rev): The economic values (a) were calculated as one phenotypic standard deviation (σp) as relative economic weight of each trait as reported by Atil (2006) and Faid-Allah & Ghoneim (2012) as shown in table 1. It is Non-objective methods with modification in its charge to be negative for LP, DO and AFC to get higher desired genetic gain for traits under selection depends on the trait phenotypic period are 6384.95 kg and 332 day, respectively.
Table 1. Descriptive statistics of studied traits for milk production and reproductive status in Holstein cows
found to vary from 286 to 407 days and it’s CV ranged
from 5 to 31.74 % as mentioned by El-Arian et al. (2003), Salem et al. (2006), Hammoud (2013) and Osman et al. (2013a) in Egypt.
Usman et al. (2012) reported that LP of Holstein cows ranged from 185 to 514 days with mean of 366.5±76.71 days (CV= 20.93).
The mean (CV %) of reproductive traits as days open and age at first calving (Table 1) are 157.93 day (22.62) and 30.51 month (16.79), respectively. The low age at first calving in a particular dairy cattle herd is a reflection of the good managerial strategy adopted in al. (2006) being 9038 kg, respectively Holstein cows in Egypt. The mean of LP was lower than the mean of 370 and 407 days obtained by Abou-Bakr et al. (2006) and Salem et al. (2006), respectively. The estimated of DO obtained in this study was shorter than that of 255 days found by Abou-Bakr et al. (2000), but was similar to 154 days obtained by Abou-Bakr et al. (2006). High phenotypic dispersion in the data of studied traits will enhance the selection response in our planned for breeding program by selection index method.
Variance components
Table (2) show estimates of variance components, heritability (h2) as well as genetic correlations (r
G) and
phenotypic correlations (rP) among different milk
production and reproductive traits. The variance components of 305-dMY per kg, LP per day, Do per day and AFC per month are 281500, 273.1 , 134 and 7.471 for genetic variance, 1530000, 2438, 1276 and 26.21 for phenotypic variance, respectively. These estimates are in agreement with Hammoud (2013) working on a herd of Holstein cows in Egypt and
reported that the variance components of 305-dMY per kg, LP per day and DO per day were 466296, 2848.64 and 3075.04 for genetic variance, 1102847, 5933.22 and 5741.82 for phenotypic variance, respectively.
Table (2) show estimates of heritability for 305-dMY, LP, DO and AFC are 0.184, 0.112, 0.105, and 0.285, respectively. These estimates are low to moderate and in agreement with most of the previous investigators. Heritability estimated were 0.17, 0.29 and 0.20 as reported by Meyer (1985), Dadpasand et al. (2013), Ghiasi et al. (2013) and Kaygisiz (2013) for 305-dMY; 0.06, 0.07 and 0.184 ±0.161 as reported by Lakshmi et al. (2009), El-Arian et al (2003) and Usman et al. (2012) for LP; 0.20 ±0.06, and 0.23 ±0.105 as Holstein crossbred cows was 0.24 ±0.12, respectively.
In Egypt, heritability estimated of LP and DO were 0.38 and 0.42 (El-Shalmani 2011) and 0.04 and 0.20 (Shalaby et al. 2012) for first lactation of Friesian cows. Moreover, Hammoud (2013) showed that heritability estimates of 305-dMY, LP, and DO were 0.42, 0.48 and 0.54 for first lactation Holstein cows, respectively.
Osman et al. (2013b) showed that heritability estimates at the first parity of LP, DO and AFC were 0.107±0.07, 0.313±0.09 and 0.431±0.103, respectively for Holstein cows, respectively. Furthermore, the estimated LP and DO at the second parity were 0.166±0.077 and 0.117±0.071, respectively. Furthermore, Abdel-Gader et al. (2007) in Sudan and Tekerli & Kocak (2009) in Turkey found that heritability estimated of LP were 0.17 and 0.02 of Holstein cows, respectively.
Table 2. Heritability estimates (diagonal), genetic (below), phenotypic (above) correlation coefficients and variance components of studied traits for milk production and reproductive status in Holstein cows
Traits 305-dMY LP DO AFC
305-dMY 0.184±0.032 0.037 -0.005 0.009
LP 0.406±0.131 0.112±0.025 0.894 0.092
DO 0.413±0.135 0.882±0.035 0.105±0.024 0.145*
AFC -0.178±0.118 0.601±0.106 0.725±0.095 0.285±0.042
Listing of P-matrix
305-dMY 1530000 2260 -220.9 57
LP 2260 2438 1577 23.26
DO -220.9 1577 1276 26.52
AFC 57 23.26 26.52 26.21
Listing of G-matrix
305-dMY 281500 3560 2536 -258.1
LP 3560 273.1 168.7 27.15
DO 2536 168.7 134 22.94
AFC -258.1 27.15 22.94 7.471
Estimated genetic correlations (rG) and phenotypic
correlations (rP) among previous traits were positive in
general except between 305-dMY and DO (Table 2). Similar results were obtained by Ghiasi et al. (2013).
Selection index and the expected genetic gain
Heritability is used to calculate genetic evaluations, to predict response to selection, and to help breeders decide if it is more efficient to improve traits through management or through selection and making many practical decisions in breeding methods to predict the
animal’s estimated breeding value (EBV). By regarding heritability as the regression of breeding value on
phenotypic value, an individual’s EBV is simply
calculated as the product of heritability and the phenotypic value. So, the moderate values of heritability for studied traits (305-dMY and AFC) will enhance the possibility of selection by raising its expected genetic gain per generation. König & Swalve (2009) revealed that correlations between indices and aggregate genotypes (rti) fall-down for traits with
heritability’s close to zero. There is a positive relationship between rti and heritability. Using
Non-objective methods with modification in its charge to be negative for LP, DO and AFC to get higher desired genetic gain for traits under selection depends on the trait phenotypic dispersion.
General, reduced, sub as own-performance selection indices and multi-source of information are shown in
Table 3. The general index is considered as the main index due to its properties, whereas this index contained all traits under selection program without any reduction. Furthermore, the general index is used as a standard efficient index to determine the relative efficiencies of the other types of selection indices.
Eighteen selection indices were constructed divided according to two strategies; first, strategy one include fifteen indices, and second, strategy two include three multi-source indices (Table 3).
The comparisons of the various selection indices indicated that the general index (I1) which incorporated
305-dMY, LP, DO and AFC is the most efficient (RIH=0.518; RE=100%) and it is recommended for
improving milk Production and reproductive traits in Holstein cattle in Egypt in case of applying own-performance strategy. Similar results were obtained by Atil (2006) working on Friesian cow in Turkey, Using one standard deviation as a relative economic weight found that the general index incorporated 305-dMY, LP and AFC (I=.677*305-dMY+.06*LP-135.59*AFC) (RIH=0.77) was the best and increase the expected
genetic gain of 305-dMY by 346 kg/generation, LP increased by 3.37 day/ generation and AFC decreased by -1.62 mo/ generation.
However, the decline in fertility performance and profit was the opposite as observed in the index which had DO with 305-dMY (I=0.193*305-dMY - 1.7*DO) to get lower genetic gains for milk production (423 kg/generation). Similar results were reported by Gonzalez-Recio et al. (2006).
Missanjo et al. (2013) developed selection index which includes milk production and functional traits (I = 0.0004 milk yield + 0.0109 fat yield + 0.0313 protein yield + 1.0004 fat percent + 2.4491 protein percent − 0.1905 somatic cell count) and revealed that animals can be ranked according to this index and selection based on these rankings. The positive signs for production traits and negative sign for functionality trait mean that the index developed will allow breeders to select sires and dams, which will increas the production traits and decrease the functionality trait.
Ghiasi et al. (2015) reported that the fertility sub index which includes DO (I= 1.69*DO) had the highest correlated genetic gain for number of inseminations to
conception (−0.25 time/ generation), and days from
calving to first service (−8.6 day/generation).
Therefore, this index had the highest profit per US dollar (3.5 US dollar /generation), among the other selection indices. Therefore, in conditions where fertility records are not available, DO can be used efficiently to improve fertility performance. These results suggest that two cows may have the same DO but different fertility performance either in the re-cycling activity post-calving or the ability to get pregnant. Further, censoring must be taken into account in genetic evaluations to improve predictive ability (González-Recio et al. 2006).
The least accuracy; first, in strategy one, [RIH
=0.17936 (I9), 0.1793 (I13), and 0.15827 (I14) ] would
result especially from indices that contain LP and DO in present study; second, in multi-source indices, [RIH =
0.60475 (I18)] revealed the lower RIH value in case of
using maternal half-sibs as a second source of information. It is clear that the index not including AFC showed a reduction in its accuracy. Similar results were obtained by Khattab & Sultan (1991), Atil & Gevrekci (2005) and Atil (2006).
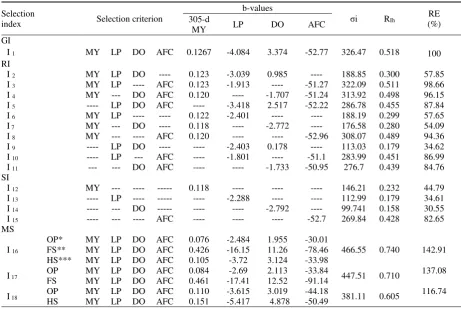
Table 3. Weighing factors (b-values), standard deviation (σi), efficiencies of selection in absolutes (RIh) and relative values (RE)
in indices used to improve body weight at weaning in Holstein cattle
Selection
index Selection criterion
b-values
σi RIh RE
(%) 305-d
MY LP DO AFC
GI
I 1 MY LP DO AFC 0.1267 -4.084 3.374 -52.77 326.47 0.518 100 RI
I 2 MY LP DO ---- 0.123 -3.039 0.985 ---- 188.85 0.300 57.85
I 3 MY LP ---- AFC 0.123 -1.913 ---- -51.27 322.09 0.511 98.66
I 4 MY --- DO AFC 0.120 ---- -1.707 -51.24 313.92 0.498 96.15
I 5 ---- LP DO AFC ---- -3.418 2.517 -52.22 286.78 0.455 87.84
I 6 MY LP ---- ---- 0.122 -2.401 ---- ---- 188.19 0.299 57.65
I 7 MY --- DO ---- 0.118 ---- -2.772 ---- 176.58 0.280 54.09
I 8 MY --- ---- AFC 0.120 ---- ---- -52.96 308.07 0.489 94.36
I 9 ---- LP DO ---- ---- -2.403 0.178 ---- 113.03 0.179 34.62
I 10 ---- LP --- AFC ---- -1.801 ---- -51.1 283.99 0.451 86.99
I 11 --- --- DO AFC ---- ---- -1.733 -50.95 276.7 0.439 84.76
SI
I 12 MY --- ---- --- 0.118 ---- ---- ---- 146.21 0.232 44.79
I 13 ---- LP ---- --- ---- -2.288 ---- ---- 112.99 0.179 34.61
I 14 ---- --- DO --- ---- ---- -2.792 ---- 99.741 0.158 30.55
I 15 ---- --- ---- AFC ---- ---- ---- -52.7 269.84 0.428 82.65
MS
I 16
OP* MY LP DO AFC 0.076 -2.484 1.955 -30.01
466.55 0.740 142.91 FS** MY LP DO AFC 0.426 -16.15 11.26 -78.46
HS*** MY LP DO AFC 0.105 -3.72 3.124 -33.98
I 17 OP MY LP DO AFC 0.084 -2.69 2.113 -33.84 447.51 0.710 137.08
FS MY LP DO AFC 0.461 -17.41 12.52 -91.14
I 18 OP MY LP DO AFC 0.110 -3.615 3.019 -44.18 381.11 0.605 116.74
HS MY LP DO AFC 0.151 -5.417 4.878 -50.49
Table4. Expected genetic changes (eg) per generation and value of each trait in the index (vt) when using indices to improve body weight at weaning (*i = 1.0) in Holstein cows
Selection
index Selection criterion
Expected genetic changes (EG) Value of each trait in the index %( Vt
A positive relationship was found between 305-dMY and AFC (Table 2). It is necessary to select against the increase of LP more than 305 day, DO more than 60 days after calving and AFC more than 28 month
of age as breeder’s targets.
Strategy two includes four indices; the best restricted indices were I18, I17. It is suggested using I18,
I17 to improve milk Production and reproductive traits in
Holstein cattle under restriction strategy. In case of populations that have already reached optimal 305-dMY, we suggest using completely restriction index (I19) to get zero genetic gain in 305-dMY.
The original selection index (I1) which included
305-dMY, LP, DO and AFC was suggested to be used for improving milk Production and reproductive traits in case of own-performance strategy.
The expected genetic change per generation (EG) in each trait assuming the selection intensity of 1.00 is given in table (4). The expected genetic change per generation (EG); first, in strategy one, ranged between -71.7 to 136.7 kg for 305-dMY, -0.2733 to -6.717 day
for LP, 0.4109 to 5.197 day for DO and 0.2087 to -1.519 month for AFC; second, in multi-source indices, ranged between 161.1 to 209 kg for 305-dMY, -5.331 to 6.37 day for LP, 3.827 to 4.244 day for DO and -1.608 to -1.843 month for AFC.
The expected genetic gain after one generation through the general index (I1) will be (1) increase in
production and reproductive traits in Holstein cattle in case of applying multi-source strategy.
Value of each trait in the index (Vt) as a percentage were illustrated in table (4) The Value of each trait in the index; first, in strategy one, ranged between 11.83 to 43.52 % for 305-dMY, 3.51 to 22.31 % for LP, 0.03 to
and reproductive traits in Holstein cattle under own-performance strategy and using (I16 (RE=142.91)) under
multi-source strategy to get high accuracy and higher expected genetic changes per generation compare to general index.
REFERENCES
Abdel-Gader AZ, Khair M, Ahmed A, Lutfi MA, Peters KJ. 2007. Milk yield and reproductive performance of Friesian cows under Sudan tropical conditions. Arch Tierz Dummerstorf. 50:155-164.
Abou-Bakr S, Alhammad HOA, Sadek RR, Nigm AA. 2006. Productive and reproductive characteristics of Holstein cows raised under intensive farming system in Egypt. Egypt J Anim Prod. 43:91-98.
Abou-Bakr S, El-Saied UM, Ibrahimm MAM. 2000. Genetic and phenotypic parameters for milk yield, days open and number of services per conception of Holstein cows of a commercial herd in Egypt. Egypt J Anim Prod. 37:9-17.
Ashmawy AA, Khalil MH. 1990. Single and multi-trait selection for lactation in Holstein-Friesian cows Egypt. J Anim Prod. 272:171-184.
Atil H. 2006. A comparison of different selection indices for genetic improvement for milk traits in Holstein Friesian cattle in turkey by using one standard deviation as a relative economic weight. Pak J Biological Sci. 9:285-288.
Atil H, Gevrekci Y. 2005. A comparison of different selection indices for genetic improvement of some dairy milk traits in Holstein Friesian cow in Turkey. J Appl Anim Res. 27:117-120.
Ayied AY, Jadoa AJ, Abdulrada AJ. 2011. Heritabilities and breeding values of production and reproduction traits of Holstein cattle in Iraq. J Basrah Res Sci. 37:66-70.
Banga CB. 2009. The Development of Breeding Objectives for Holstein and Jersey Cattle in South Africa. The Free State University, Faculty of Natural and Agriculture Science, Department of Animal Wildlife and Grassland Science. p. 29.
Boldman KG, Kriese LA, Van Vleck LD, Kachman SD. 1995. A manual for use of MTDFREML. A set of programs to obtain estimates of variances and covariances (DRAFT). Washington DC (USA): ARS, USDA. Landbrukshofhandelen, universities for Laget, Vollebek, Oslo.
Dadpasand M, Zamiri MJ, Atashi H. 2013. Genetic correlation of average somatic cell score at different stages of lactation with milk yield and composition in Holstein cows. Iranian J Vet Res. 14:190-196.
El-Arian MN, El-Awady HG, Khattab AS. 2003. Genetic analysis for some productive traits of Holstein Friesian cows in Egypt through MTDFREML program. Egypt J Anim Prod. 40:99-109.
El-Shalmani AF. 2011. Evaluation of production performance in relation to genetic structure of some Thailand. Kasetsaart J Nat Sci. 47:228-237.
Faid-Allah E, Ghoneim E. 2012. Comparing different methods for estimating economic values in selection index for pre-weaning body weights of Friesian heifers in Egypt. Egyptian J Anim Prod. 49:73-80.
Ghiasi H, Nejati-Javaremi A, Pakdel A, Gonzalez-Recio O. 2013. Selection strategies for fertility traits of Holstein cows in Iran. Livest Sci. 152:11-15.
Ghiasi H, Pakdel A, Nejati-Javaremi A, Gonzalez-Recio O. 2015. Fertility subindex for improving fertility performance in Iranian Holstein cows. Trop Anim Health Prod. 47:67-71.
González-Recio O, Chang Y, Gianola D, Weigel K. 2006. Comparison of models using different censoring scenarios for days open in Spanish Holstein cows. J yield records. J Anim Plant Sci. 23:345-349.
Khattab AS, Sultan ZA. 1991. A comparison of different selection indices for genetic improvement of some dairy milk traits in Friesian cow in Egypt. J Anim Breed Genet. 108:349-354.
König, Swalve. 2009. Application of selection index calculations to determine selection strategies in genomic breeding programs. J Dairy Sci. 92:5292-5303.
Lakshmi BS, Gupta BR, Sudhakar K, Prakash MG, Sharma S. 2009. Genetic analysis of production performance of 642 Holstein Friesian×Sahiwal cows. Tamilnadu J Vet Anim Sci. 5:143-148.
Liljedahl L, Kolstad N, Sørensen P, Majala K. 1979. Scandinavian selection and crossbreeding experiment with laying hens.1- Back ground and general outline. Acta Agric Scandi. 29:273-286.
Matlab. 2002. The Language of technical computing. Release 13 by The MathWorks, Inc.
Meyer K. 1985. Genetic parameters for dairy production of Australian Black and White cows. Livest Prod Sci. 12:205-219.
Miglior F, Muir BL, Van Doormaal BJ. 2005. Selection indices in Holstein cattle of various countries. J Dairy Sci. 88:1255-1263.
Missanjo E, Imbayarwo-Chikosi V, Halimani T. 2013. A Proposed selection index for Jersey cattle in Zimbabwe. ISRN Vet Sci. 1-3.
Norman HD, Wright JR, Miller RH. 2010. Response to alternative genetic-economic indices for Holsteins across 2 generations. J Dairy Sci. 93:2695-2702.
Osman MM, El-Bayomi KM, Moawed SA. 2013a. Genetic and non-genetic factors affecting some productive and reproductive traits in Holstein-Friesian dairy cows raised in Egypt for the first two lactations. Suez Canal Vet Med J. XVIII:99-113.
Osman MM, El-Bayomi KM, Moawed SA. 2013b. Estimation of heritabilities, genetic correlations, phenotypic correlations and genetic trends for production and reproduction traits of Holstein-Friesian dairy cattle using sire model. Suez Canal Vet Med J. XVIII:115-128.
Salem MA, Esmoil HM, Sadek RR, Nigm AA. 2006. Phenotypic and genetic parameters of milk production and reproductive performance of Holstein cattle under the intensive production system in Egypt. Egypt J Anim Prod. 43:1-10.
Shalaby NA, El-Barbary ASA, Oudah EZM, Helmy M. 2012. Genetic parameters and breeding values of some productive and reproductive traits Friesian cattle in Egypt. Proceeding the 15th AAAP Animal Science. Congress 26-30, Thummassat Univ., Rangift, Thailand.
Suhail SM, Ahmed I, Hafez A, Ahmed S, Jan D, Khan S, Rahman A. 2010. Genetic study of some reproductive traits of Jersey cattle under subtropical conditions. J Agric. 26:87-91.
Tekerli M, Kocak S. 2009. Relationships between production and fertility traits in first lactation and lifetime performances of Holstein cows under subtrobical condition. Arch Tier. 52:364-370.
Usman T, Guo G, Suhail SM, Ahmed S, Qiaoxiang L, Qureshi MS, Wang Y. 2012. Performance traits study of Holstein Friesian cattle under subtropical conditions. J Anim Plant Sci. 22:92-95.
Wagenaar D, Arendonk J, Van Kramer M. 1995. Selection Index Program (SIP), User manual. Department of Animal Breeding, Wageningen Agriculture, Universitas Netherlands.
Wahinya PK, Okeno TO, Kosgey IS, Kahi AK. 2015. Economic and biological values for pasture-based dairy cattle production systems and their application in genetic improvement in the tropics. J Anim Prod Adv. 5:664-675
Heritability Estimation and Non-Genetic Factors Affecting Production
Traits of Indonesian Ongole Cross
Hartati¹, Muladno², Jakaria², Priyanto R², Gunawan A², Aryogi¹, Talib C³
¹Beef Cattle Research Station, Jl. Pahlawan No. 2 Grati Pasuruan
²Department of Animal Production and Technology, Faculty of Animal Science, Bogor Agricultural University ³Indonesian Center for Animal Research and Development. Jln Raya Pajajaran Kav. E59 Bogor
E-mail: [email protected]
(received 30-07-2015; revised 26-08-2015; accepted 14-09-2015)
ABSTRAK
Hartati, Muladno, Jakaria, Priyanto R, Gunawan A, Aryogi, Talib C. 2015. Estimasi nilai heritabilitas dan faktor non-genetik yang mempengaruhi sifat-sifat produksi sapi PO. JITV 20(3): 168-174. DOI: http://dx.doi.org/10.14334/jitv.v20i3.1183
Data produktivitas dari 560 ekor sapi PO telah dikoleksi selama 9 tahun pengamatan dari 2004 sampai 2013 untuk mengkaji estimasi nilai heritabilitas dan pengaruh non-genetik terhadap sifat produksi sapi PO dari lahir sampai umur satu tahun. Estimasi nilai heritabilitas dilakukan dengan analisis variansi menggunakan data saudara tiri sebapak (Paternal Halfsib Correlation). Pemisahan komponen ragam untuk menduga nilai heritabilitas dilakukan dengan analisis sidik ragam Rancangan Acak Lengkap pola searah. Sedangkan pengaruh non-genetik (jenis kelamin, tahun, paritas, musim, generasi dan tipe lahir) dianalisis menggunakan Generalized Linier Model (GLM). Hasil penelitian menunjukkan bahwa jenis kelamin dan tahun berpengaruh nyata (P<0,05) pada sifat-sifat produksi yang meliputi bobot lahir, bobot sapih dan bobot setahun, sedangkan tipe lahir hanya berpengaruh nyata pada bobot lahir saja. Paritas, musim dan generasi menunjukkan pengaruh yang tidak nyata terhadap ketiga variabel produksi tersebut. Estimasi nilai heritabilitas bobot lahir, bobot sapih dan bobot setahun berturut-turut 0,28+0,12; 0,47+0,15 dan 0,63+0,17. Nilai heritabilitas tertinggi diperoleh pada bobot setahun, hal ini berarti bahwa bobot setahun efektif untuk digunakan sebagai kriteria seleksi dalam meningkatkan perbaikan genetik sapi PO.
Kata Kunci: Genetik, Non-Genetik, Produksi, Sapi PO
ABSTRACT
Hartati, Muladno, Jakaria, Priyanto R, Gunawan A, Aryogi, Talib C. 2015. Heritability estimation and non-genetic factors affecting production traits of Indonesian Ongole cross. JITV 20(3): 168-174. DOI: http://dx.doi.org/10.14334/jitv.v20i3.1183
Productivity data from 560 head of PO cattle have been collected for 9 years from 2004 until 2013 for evaluating heritability estimation and non-genetic factors affecting production traits of Indonesian Ongole cross from birth to yearling old. Heritability estimation were analyzed using varians analysis with data of paternal halfsib correlation. Varians component for to estimate of heritability value were analyzed using completely randomized design one - way classification. While a general linear model was used to analyze non-genetic factors (sex, year, parity, season, generation and type of births). The results showed that sex of calves and year of births had significant differences (P<0.05) for all production traits such as weight at birth, weaning and yearling, while the type of birth only presented a significant difference on birth weight. Parity, season and generation exhibited nonsignificantly effect on those production traits. Estimation of heritability on birth weight, weaning weight and yearling weight were 0.28+0.12, 0.47+0.15 and 0.63+0.17 respectively. The highest heritability values obtained in yearling weight, this means that yearling weight will be effective as selection criteria to improve the genetic of PO cattle.
Key Words: Genetic, Non-Genetic, Production, PO Cattle
INTRODUCTION
PO cattle is one of the local cattle which is formed from the cross between Ongole sires on the island of Sumba (SO) with dam in Java that occurred decades ago (KepMenTan 2012). PO cattle is known to have a high diversity (Hartati et al. 2010), also have high adaptability and able to survive in conditions of tropical regions (Astuti 2004). These facts indicate performance of good productivity as good as other local cattle.
However, nowadays the existence of PO cattle has been widely reported to be degraded and decreased in genetic quality. Since the introduction of technology Artificial Insemination (AI) in the era of the 70s, almost 95% PO cows in farmer have been crossed with Bos taurus breeds. This crossing was initially thought to improve the productivity of local cattle, began to lose direction and purpose. Mostly the result of crosses actually used as broodstock and backcross to Bos taurus
as contamination of the genetic quality of PO cattle. Currently, it is difficult to find PO cattle that have a good performance, even decline in productivity not only in weight and dimension of body size but also visible to reproduction aspects.
Various efforts have been done to improve the productivity of PO cow, one of which is through the selection program to produce quality cattle. Selection in principle is choosing animals that are genetically good quality to be used as a parent in the next generation, but in the implementation of this program is not provide optimal results. Selection conventionally takes a long time and a large population so that the selection program could only be applied to breeding livestock of government such as the Beef Cattle Research Station that does have the duties and functions to produce quality cattle, whereas in farmer which has the most population of PO cattle, selection programme can not be applied optimally because it is not supported by the data of production so the genetic potential are difficult to evaluate.
Beef Cattle Research Station as one of the technical management unit of Indonesian Agency for agricultural Research and Development Ministry of Agriculture has conducted breeding of PO cattle since 2004 until now, but the evaluation of genetic potential has not been done. Several result of studies have been reported, according to Adinata (2013) breeding value estimation for birth weight of PO cattle in Management Unit of Seed Source, heritability and repeatability were 0.686±0.525 and 0.805±0.041, whereas Prihandini et al. (2012) reported sire selection based on breeding values for weight 205 days and 365 days.
Evaluation of the genetic potential of livestock can be measured based on production and reproduction ability. The quantitative data of biological potency like production and reproduction phenotipic was inseparable from environmental influences where livestock were kept (Astuti 2004). Therefore, in addition to study about the effect of genetic such as heritability and breeding value estimation, the study of non-genetic influence was also done to eliminate biases caused by them such as the effect of sex, year, season, parity, generation and the
type of birth. This study aimed to evaluate heritability estimation and non-genetic factors affecting production traits of PO cattle. birth, season and year of birth, weight at birth, weaning and yearling. Birth weight as the weight of animal in 24 hour after birth, weaning weight and yearling weight were obtained by calculating weight of animals from recorded data with the weight closest to the age of 205 days and 365 days respectively. Formulas used for
AYW = Actual yearling weight AA = Actual age
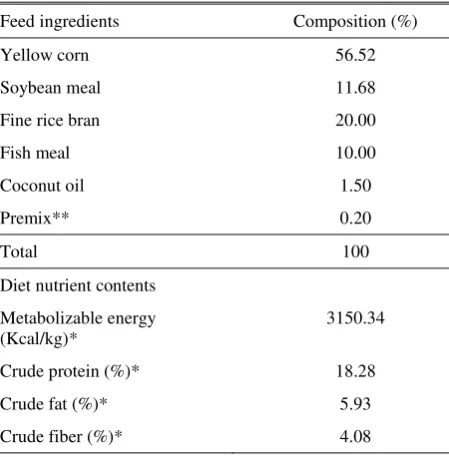
Feed ingredients used refers to the concept of Low External Input Sustainable Agriculture (LEISA) that utilize agricultural wastes were available throughout the season such as rice straw dry had ad libitum (+ 600 kg/7 days/20 head), concentrate feed 8 kg/head/day which were mix of tumpi, oil palm, rind coffee, bran quality 2, limestone and salt. Nutrien content of feed is presented in Table 1.
Table 1. The nutritional content of feed PO cattle appropriate physiological status
Physiological status Sire candidate (>18 month) and sire
Data analyses
Heritability value
Heritability estimation was calculated by analysis of variance using paternal halfsib correlations, where each bull mated with some cow and each cow has one progeny. Separation of variance components to estimate the heritability performed by analysis of variance Completely Randomized Design One-Way Classification with a mathematical model as follows (Becker 1992; Hardjosubroto 1994):
Yik = μ + αi + eik where:
μ = Common mean
αi = Effect of the iʱ sire
eik = Uncontrolled environmental deviations associated with each record
Heritability value is estimated from sire variance components, according to Becker (1992) as follows:
h² = 4 δ²s / (δ²s + δ²w)
δ²w= Within progeny variance component k = Number of progeny per sire
s =
Number of sires t = δ²s / (δ²s + δ²w) Non-genetic influencesData were analyzed to evaluate the effect of sex, year, season, parity, generation, and the type of birth on body weight at those certain ages. Seasons of birth in the year were divided into two seasons, namely dry (April-September) and rainy season (October to March). To determine the influence of non-genetic factors, data were analyzed using General Linear Model (GLM) (Steel & Torrie 1980) with the mathematical model as follow:
Yijklmn= μ + ri + sj + pk + ql + nm + mn + eijklmn
where:
Yijklmn = Weight at birth, weaning, yearling and 2 years
μ = Overall mean
Statistical analysis of environmental influences on body weight of PO cattle and heritability estimation of birth weight, weaning weight and yearling weight are presented in Table 2 and 3.
Birth weight
Statistical analysis showed that sex, year and birth type significantly affected (P<0.05) birth weight in PO cattle, whereas parity, season and generation showed no significant effect. Birth weight of male calves was Bojonegoro amounted to 11.07 + 3.92kg.
Effect of year on birth weight in this study was greatly fluctuate from year to year with the trend in 2010> 2013> 2004 (Table 2). The highest birth weight was obtained in 2013 with the average weight of 25.8 + 3.3 kg, whereas the lowest birth weight obtained in 2004 with an average of 22.3 + 3.0 kg, but in general the birth weight of 2004 to 2013 showed an increasing trend.
Table 2. Mean along with their standard deviation (SD) for birth, weaning and yearling weight (kg)
Performans of calves Production traits
Birth weight (n) Weaning weight (n) Yearling weight (n)
Sex
Male 25.3+3.4 (267)ª*) 108.5+28.6 (264)ª 157.1+40.6 (255)ª
Female 23.9+3.2 (293)b 100.9+24.7 (291)b 147.3+38.1 (284)b
Years
2004 22.3+3.0 (29)ª 92.9+15.9 (29)ª 119.7+25.0 (29)ª
2005 22.8+3.4 (32)ª 96.4+21.5 (32)ª 135.6+25.4 (32)ª
2006 24.6+4.3 (23)ª 77.6+21.6 (23)ª 111.9+34.8 (23)ª
2008 25.6+3.4 (44)ªb 106.6+27.1 (43)ªb 147.7+38.8 (42)ªb
2009 25.4+3.1 (71)ª b 97.5+19.4 (71)ªb 152.4+32.0 (71)ªb
2010 24.0+3.2 (100)ª 108.4+26.6 (100)ªb 158.8+37.4 (99)b
2011 24.3+3.7 (65)ª 94.3+20.7 (64)b 140.8+29.7 (63)ªb
2012 24.3+2.8 (98)ª 100.6+25.8 (98)ªb 150.6+33.7 (98)ªb
2013 25.8+3.3 (98)b 127.9+25.5 (96)b 183.8+45.8 (83)c
Parity
1 23.9+3.4 (226)ª 99.7+23.8 (226)ª 146.0+34.9 (220)ª
2 24.9+3.1 (142)ª 105.2+29.7 (140)ª 153.3+43.1 (135)ª
3 25.1+3.6 (90)ª 106.5+28.1 (89)ª 150.6+43.4 (87)ª
4 25.1+3.3 (57)ª 115.2+27.3 (56)ª 169.7+42.4 (54)ª
5 24.7+3.7 (29)ª 111.8+24.1 (29)ª 166.3+32.0 (29)ª
6 26.1+2.7 (16)ª 104.6+27.1 (15)ª 142.3+26.6 (14)ª
Seasons
Rainy 24.5+3.0 (195)ª 105.4+27.1 (192)ª 152.3+39.4 (179)ª
Dry 24.6+3.6 (365)ª 104.0+26.8 (363)ª 151.8+39.7 (360)ª
Generation
1 24.7+3.5 (393)ª 103.5+26.3 (389)ª 149.7+39.1 (380)ª
2 24.4+3.1 (167)ª 106.8+28.2 (166)ª 157.2+40.2 (159)ª
Birth type
1 24.7+3.3 (552)ª 104.7+26.8 (547)ª 152.2+39.4 (531)ª
2 17.7+4.1 (8)b 88.6+31.1 (8)ª 135.3+47.8 (8)ª
Total average 24.6+3.4 (560) 104.5+26.9 (555) 151.9+39.6 (539)
*) Different of letters in the same section within column shows significantly different (P<0.05)
Table 3. Heritability estimation of body weight of PO cattle
Traits n h² + SE Vs Ve Vp
Birth weight 560 0.28+0.12 3.148 10.6 11.387
Weaning weight 555 0.47+0.15 338 640 724.50
Yearling weight 539 0.63+0.17 997.47 1325 1574.367
twinning occurred in first and second parity (Berry et al. PO cattle was 0.28 + 0.12 (Table 3). The heritability in this study was lower than heritability of other local cattle. Gunawan et al. (2011) reported heritability of birth weight for Bali cattle amounted 0.33 + 0.99. Whereas Adinata (2013) reported heritability of birth weight for PO cattle in UPBS groups was higher namely 0.686±0.525. Heritability of birth weight in this study was similar to heritability of birth weight for Zebu breed reported by Albuquerque & Meyer (2001) 0.28. Boligon et al. (2009) reported that heritability for birth weight of Nellore cattle (Bos indicus) was 0.25. birth weight in this study was quite moderate and within the range of published values by Hardjosubroto (1994) 0.2-0.58, these result show that the correlation of phenotypic variances and genetic variances is quite moderate so the selection based on the phenotypic of the individual birth weight to be quite effective. Lasley (1978) stated that selection on birth weight can be done to improve genetic quality weaning weight trait, yearling and weaning daily gain due to the high correlation of genetic variances in these traits.
Weaning weight
The overall average of weaning weight of PO cattle was 104.5+26.9 kg. Weaning weight in this research was lower than that reported by Aryogi et al. (2006) that weaning weight of PO cattle at the farmer in East Java was 109 kg. Statistical analysis of the environmental influence showed that sex and year were significant (P<0.05) on weaning weight of PO cattle (Table 2). Maylinda (2010) stated that weaning weight was influenced by many environmental factors, especially the management and maintenance of the genetic component of the parental (maternal genetic effects) such as the production of milk and breast feeding behavior that ultimately affected the performance of individuals. It is very relevant to this nutrients than the female. Thus weaning weight can also be used as a criterion in selecting the dam that has good mothering abilities.
Effect of year on weaning weight in this study was greatly fluctuate from year to year with the trend in 2010> 2013> 2006 (Table 2). The highest weaning weight was obtained in 2013 with average of 127.9+25.5 kg, whereas the lowest weaning weight was obtained in 2006 an average of 77.6+21.6 kg.
Heritability estimation for weaning weight of PO cattle was 0.47+0.15 (Table 3). Heritability value in this study was higher than heritability commonly found in offspring of Ongole breed in some other countries. Silva et al. (2013) reported heritability of Ongole breed developed in Brazil or known as Nellore cattle was 0.13. While Araujo et al. (2014) found heritability was 0.36. Heritability can varies higher or lower from one study to other studies, it is likely influenced by the ability of the environment that will reduce the influence of pure genetic elements in cattle. But, generally heritability in this study was high category due more than 0.4 (Noor 2010). The high value of heritability of weaning weight showed that the selection on the basis of performance of the individual will be more effective to increase daily gain in weaning weight that indicates these traits can increase the response selection.
Yearling weight
The overall average of yearling weight of PO cattle was 151.9 + 39.6 (Table 2), lower than yearling weight the result reported by Aryogi et al. (2006) 166.4 kg. Statistical analysis of the environmental influences showed that sex and year were significant (P<0.05) on yearling weight of PO cattle (Table 2). Result showed that the average of yearling weight of male PO cattle was higher than female: 157.1 + 40.6 dan 147.3 + 38.1, respectively. The difference of this weight might be attributed to different physiological processes in both sexes. Dadi et al. (2008) stated that sex had a highly weaning weight of age to 9,8 kg at yearling weight.
Heritability values have been calculated for direct genetic effect of yearling weight was 0.63 + 0.17 (Table 3). These results were higher than some of the Ongole breed heritability values previously reported in the literature. Silva et al. (2013) reported a heritability values of 0.51 for yearling weight in which these values are lower than result of this study. The heritability value differences might be caused differences in the number of data structures, management and genetic data analysis methods. Clement et al. (2001) suggest that genetic variance was influenced by differences in the data number (structure) analyzed, the method of genetic analysis, the relationship among cattle herds and research time. The results of this study was an indication of good genetic progress for the growth traits of zebu cattle, especially in the tropical regions. Direct heritability estimation for body weight at evaluation of different age have medium and high value, it was indicating that additive genetic diversity sufficient to give response to selection. This result showed an indication that yearling weight can be used as an effective criterion for selection to improve growth rate in PO cattle.
CONCLUSION
Environment has significant influence (for sex and year) on: birth, weaning and yearling weight. Male calves have higher body weight than female calves, whereas performance of body weight of PO cattle was greatly fluctuate from year to year. Heritability estimation on birth, weaning and yearling weight were 0.28 + 0.12; 0.47 + 0.15 and 0.63 + 0.17 respectively. Heritability estimation on body weight of PO cattle was considered medium and high category. The highest heritability values obtained in yearling weight, this means that yearling weight will be effective as selection criteria to improve the genetic of PO cattle
.
ACKNOWLEDGEMENT
The authors would like to extend gratitude to the Indonesian Agency for Agricultural Research and Development, Ministry of Agriculture through KKP3N activity in 2014 that has facilitated and funded this research activity. And our gratitude is also for Beef Cattle Research Station for full data and support, especially to friends who helped in the stable.
REFERENCES
Adinata Y. 2013. Estimasi nilai pemuliaan bobot lahir sapi Peranakan Ongole pada unit Pengelolaan Bibit Sumber di Loka Penelitian Sapi Potong. Purwantari ND, Saepulloh M, Iskandar S, Anggraeni A, Ginting SP, Priyanti A, Wiedosari E, Yulistiani D, Inounu I, Bahri S, Puastuti W, penyunting. Prosiding Seminar Nasional Teknologi Peternakan dan Veteriner. Medan (Indones): Pusat Penelitian dan Pengembangan Peternakan. hlm. 66-73. Laureano MMM, Bittencourt TCBDSCD, Araújo SI. 2014. Estimates of genetic parameters of growth traits of Nellore cattle in the Midwest Region of Brazil. Rev Bras Saúde Prod Anim Salvador. 15:846-853.
Aryogi, Prihandini PW, Wijono DB. 2006. Pola pembibitan sapi potong lokal Peranakan Ongole pada kondisi peternakan rakyat. Mathius IW, Sendow I, Purwantari, ND, Murdiati TB, Thalib A, Beriajaya, Suparyanto A, Prasetyo LH, Darmono, Wina E, penyunting. Prosiding Seminar Nasional Teknologi Peternakan dan Veteriner. Bogor (Indones): Pusat Penelitian dan Pengembangan Peternakan. hlm. 192-199.
Astuti. 2004. Potensi dan keragaman sumberdaya genetik sapi Peranakan Ongole (PO). Wartazoa. 14:98-106.
Becker WA. 1992. Manual of quantitative genetics. 5th ed. (USA): Academic Enterprises.
Berry SL, Ahmadi A, Thurmond MC. 1994. Periparturient disease on large, dry lot dairies: interrelationships of lactation, dystocia, calf number, calf mortality, and calf sex. J Dairy Sci. 77:379.
Boligon AA, Albuquerque LG, Mercadante MEZ, Lobo RB. 2009. Herdabilidades e correlações entre pesos do nascimento à idade adulta em rebanhos da raça Nelore.
Braz J Anim Sci. 38:2320-2326.
Cady RA, Van Vleck LD. 1978. Factors affecting twinning and effects of twinning in Holstein dairy cattle. J Anim Sci. 46:950-956.
Clement V, Bibe B, Verrier E, Elsen JM, Manfredi E, Bouix J, Hanocq E. 2001. Simulation analysis to test the influence of model adequacy and data structure on the estimation of genetic parameters for traits with direct and maternal effects. Genet Sel Evol. 33:369-395.
Dadi H, Duguma G, Shelima B, Fayera T, Tadesse M, Woldu T, Tucho TA. 2008. Non-genetic factors influencing post-weaning growth and reproductive performances of Arsi-Bale goats. Livest Res Rural Develop. Article #114. http://www.lrrd.org/lrrd20/7/dadi20114.htm.
Hardjosubroto W. 2004. Alternatif kebijakan pengelolaan berkelanjutan sumberdaya genetik sapi potong lokal dalam sistem perbibitan ternak nasional. Wartazoa. 14:93-97.
Hartati, Sumadi, Subandriyo, Hartatik T. 2010. Keragaman morfologi dan diferensiasi genetik sapi Peranakan Ongole di peternakan rakyat. JITV. 15:72-80.
[KepMenTan] Keputusan Menteri Pertanian. 2012. Penetapan Rumpun Sapi Peranakan Ongole. http://bibit.ditjennak. pertanian.go.id
Kinsel ML, Marsh WE, Ruegg PL, Etherington WG. 1998. Risk factors for twinning in dairy cows. J Dairy Sci. 81:989-993.
Komisarek J, Dorynek Z. 2002. Genetic aspects of twinning in cattle. J Appl Genet. 43:55-68.
Lasley JF. 1987. Genetics of livestock improvement. New Jersey (USA): Prentice Hall, Inc. Englewood Cliffs.
Maylinda S. 2010. Pengantar pemuliaan ternak. Malang (Indones): Universitas Brawijaya Press.
Nielen M, Schukken NYH, Scholl DT, Wilbrink HJ, Brand A. 1989. Twinning in dairy cattle: a study of risk factors and effects. Theriogenology. 32:845-862.
Noor RR. 2010. Genetika Ternak. 6th ed. Jakarta (Indones): PT Penebar Swadaya.
Prihandini PW, Hakim L, Nurgiartiningsih VMA. 2012. Seleksi Pejantan Berdasarkan Nilai Pemuliaan pada Sapi PO di Loka Penelitian Sapi Potong. Jurnal Ternak Tropika. 13:9-18.
Ryan DP, Boland MP. 1991. Frequency of twin births among Holstein-Friesian cows in a warm dry climate. Theriogenology. 36:1-10.
Steel RGD, Torrie JH. 1980. Principles and Procedures of Statistics. 2nd ed. New York (USA): McGraw-Hill.
Santos GCJ, Lopes FB, Marques EG, Silva MC, Cavalcante TV, Ferreira JL. 2012. Tendência genética para pesos padronizados aos 205, 365 e 550 dias de idade de bovinos Nelore na região norte do Brasil. Acta Scientiarum Animal Sciences. 34:97-101.
Silva RMD, Souza JCD, Silva LOCD, Silveira MVD, Freitas JAD, Marçal MF. 2013. Parâmetros e tendências genéticas para pesos de várias idades em bovinos
Nelore. Rev Bras Saúde Prod Anim Salvador. 14:21-28.
Antimicrobial and Antioxidative Activities of Peptides from Goat Milk
Hydrolyzed with Various Protease
Kusumaningtyas E1,2, Widiastuti R1, Kusumaningrum HD2, Suhartono MT2
1Indonesian Research Center for Veterinary Science, RE Martadinata 30 St. Bogor
2Department of Food Science and Technology, Faculty of Agricultural Engineering and Technology,
Bogor Agricultural University, Darmaga St. PO BOX 220 Bogor, 16002 E-mail: [email protected]; [email protected]
(received 16-06-2016; revised 13-07-2015; accepted 28-08-2015)
ABSTRAK
Kusumaningtyas E, Widiastuti R, Kusumaningrum HD, Suhartono MT. 2015. Aktivitas antimikroba dan antioksidan peptida hasil hidrolisis susu kambing dengan berbagai protease. JITV 20(3): 175-183. DOI: http://dx.doi.org/10.14334/jitv.v20i3.1184
Susu mempunyai nilai nutrisi tinggi dan mengandung protein sebagai sumber peptida bioaktif yang berguna bagi kesehatan. Penelitian ini bertujuan untuk mengeksplorasi potensi peptida bioaktif dari susu kambing sebagai antimikroba dan antioksidan. Susu dihidrolisis menggunakan enzim tripsin, kimotripsin, pepsin atau protease Bacillus sp. E.13. Peptida yang diperoleh dipilah untuk aktivitas antimikroba dengan mencampurkan peptida dan bakteri Staphylococcus aureus, Listeria monocytogenes, Salmonella thyphimurium dan Escherichia coli sebanyak 106 CFU/mL dan diinkubasi pada suhu 37°C selama 2 jam dan
ditumbuhkan pada Mueller Hinton agar. Aktivitas antimikroba ditentukan dengan membandingkan jumlah koloni bakteri yang tumbuh pada cawan dengan dengan jumlah koloni bakteri kontrol tanpa penambahan peptida. Aktivitas antioksidan ditentukan melalui uji 2, 2’-azino-bis (3-ethylbenzthiazoline-6-sulphonic acid (ABTS) dan 2,2-diphenyl-1-picrylhydrazyl (DPPH). Aktivitas antimikroba terlihat pada peptida hasil hidrolisis susu kambing oleh pepsin pada suhu 37°C, pH 2 selama 90 menit dan protease Bacillus sp. E.13 pada suhu 55°C, pH 11 selama 30 and 60 menit tetapi aktivitas tersebut tidak terdeteksi pada peptida hasil hidrolisis protein dengan tripsin dan kimotripsin. Peptida dari hidrolisis protein oleh protease Bacillus sp. E.13 dapat menghambat Listeria monocytogenes, Salmonella thyphimurium dan Escherichia coli sampai 5 siklus log. Peptida antimikroba tersebut juga dapat meredam radikal ABTS sampai 86% dan radikal DPPH 9% pada konsentrasi 68 μg protein/mL. Hasil tersebut mengindikasikan bahwa protein susu kambing yang dihidrolisis dengan protease Bacillus sp. E.13 berpotensi sebagai antimikroba sekaligus sebagai antioksidan.
Kata Kunci: Susu Kambing, Peptida, Antimikroba, Antioksidan
ABSTRACT
Kusumaningtyas E, Widiastuti R, Kusumaningrum HD, Suhartono MT. 2015. Antimicrobial and antioxidative activities of peptides from goat milk hydrolyzed with various protease. JITV 20(3): 175-183. DOI: http://dx.doi.org/10.14334/jitv.v20i3.1184
Milk is highly nutritious food containing protein as a good source of bioactive peptide that beneficial for health. This research was aimed to explore potency of bioactive peptide derived from goat milk as an antimicrobial and antioxidant. Milk was hydrolyzed by trypsin, chymotrypsin, pepsin, or protease Bacillus sp. E.13. The peptides obtained were screened for antimicrobial activities through incubation with Staphylococcus aureus, Listeria monocytogenes, Salmonella thyphimurium and Escherichia coli at 106 CFU/mL at 37°C for two hours and plated on Mueller Hinton agar. Antimicrobial activities were
determined by comparing the total bacterial colonies to that of bacterial control without peptides addition. Oxidative activity was determined by 2.2’-azino-bis (3-ethylbenzthiazoline-6-sulphonic acid (ABTS) and 2.2-diphenyl-1-picrylhydrazyl (DPPH) assays. Antimicrobial activities were shown in peptides produced from hydrolysis of goat milk protein by pepsin at 37°C, pH 2 for 90 min and by Bacillus sp. E.13 protease at 55°C, pH 11 for 30 and 60 min but the activities were not detected in peptides from hydrolysis by trypsin and chymotrypsin. Peptide from protein hydrolysis by Bacillus sp. E.13 protease could inhibit Listeria monocytogenes, Salmonella thyphimurium and Escherichia coli up to 5 log cycles. The antimicrobial peptides could scavenge ABTS radical up to 86 % and DPPH radical up to 9 % at 68 μg protein/mL. Results indicated that goat milk protein hydrolyzed by Bacillus sp. E.13 protease is potential as antimicrobes and antioxidant.
Key Words: Goat Milk, Peptide, Antimicrobe, Antioxidant
INTRODUCTION
Milk is highly nutritious food characterized by its amino acid profile balance. Concentration and