APPENDICES 1
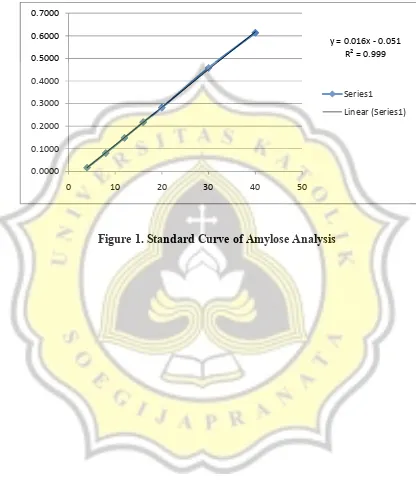
Figure 1. Standard Curve of Amylose Analysis
APPENDICES 3
1.Data analysis of amylose (dry basis)
Tests of Normality
jenis
Kolmogorov-Smirnova Shapiro-Wilk
Statistic Df Sig. Statistic df Sig.
kdr_amilosa tepung .167 24 .083 .910 24 .035
pati .160 24 .115 .911 24 .037
a. Lilliefors Significance Correction
Descriptive Statistics Dependent Variable:kdr_amilosa
jenis suhu_pengeringan Mean Std. Deviation N
tepung kontrol 15.80033 .180542 6
80 18.44700 1.361096 6
90 19.48350 1.119517 6
100 19.97417 1.018713 6
Total 18.42625 1.903538 24
pati kontrol 21.99467 .332128 6
80 26.25333 .613801 6
90 27.80617 .731609 6
100 29.47800 1.421584 6
Total 26.38304 2.952437 24
Total kontrol 18.89750 3.244910 12
80 22.35017 4.199169 12
90 23.64483 4.438910 12
100 24.72608 5.101354 12
Total 22.40465 4.712036 48
Tests of Between-Subjects Effects Dependent Variable:kdr_amilosa
Source
Type III Sum of
Squares df Mean Square F Sig.
Corrected Model 1007.457a 7 143.922 159.482 .000
Intercept 24094.471 1 24094.471 26699.383 .000
jenis 759.726 1 759.726 841.862 .000
suhu_pengeringan 230.762 3 76.921 85.237 .000
jenis * suhu_pengeringan 16.968 3 5.656 6.268 .001
Error 36.097 40 .902
Total 25138.026 48
Corrected Total 1043.554 47
a. R Squared = ,965 (Adjusted R Squared = ,959)
kdr_amilosa Duncana,,b
suhu_pe ngeringa
n N
Subset
1 2 3 4
kontrol 12 18.89750
80 12 22.35017
90 12 23.64483
100 12 24.72608
Sig. 1.000 1.000 1.000 1.000
Means for groups in homogeneous subsets are displayed. Based on observed means.
The error term is Mean Square(Error) = ,902. a. Uses Harmonic Mean Sample Size = 12,000. b. Alpha = 0,05.
2.Data analysis of Resistant Starch (dry basis) Tests of Normality
Suhu
Kolmogorov-Smirnova Shapiro-Wilk Statistic df Sig. Statistic df Sig.
pati_resisten kontrol .276 6 .169 .839 6 .128
80.00 .277 6 .165 .902 6 .388
90.00 .185 6 .200* .931 6 .591
100.00 .205 6 .200* .970 6 .889
a. Lilliefors Significance Correction
Tests of Normality
jenis
Kolmogorov-Smirnova Shapiro-Wilk Statistic df Sig. Statistic df Sig.
pati_resisten tepung .230 12 .080 .816 12 .014
pati .302 12 .003 .799 12 .009
a. Lilliefors Significance Correction
Descriptive Statistics
Dependent Variable:pati_resisten suhu Jenis Mean
Std.
Deviation N kontrol Tepung 1.138467 .2778792 3
Pati 1.329733 .1204354 3
Total 1.234100 .2183197 6
80.00 Tepung .485100 .1371436 3
Pati .550333 .1289286 3
Total .517717 .1242940 6
90.00 Tepung .454267 .0920637 3
Pati .544200 .1612368 3
Total .499233 .1273405 6
100.00 Tepung .580300 .1090164 3
Pati .562833 .0288765 3
Total .571567 .0719645 6
Total Tepung .664533 .3243343 12
Pati .746775 .3662860 12
Total .705654 .3409400 24
Tests of Between-Subjects Effects
Dependent Variable:pati_resisten Source
Type III Sum
of Squares Df Mean Square F Sig.
Corrected Model
Intercept 11.951 1 11.951 548.376 .000
Suhu 2.251 3 .750 34.430 .000
Jenis .041 1 .041 1.862 .191
suhu * jenis .033 3 .011 .509 .682
Error .349 16 .022
Total 14.624 24
Corrected Total 2.674 23
a. R Squared = ,870 (Adjusted R Squared = ,813)
pati_resisten
Duncana,,b
suhu N
Subset
1 2
90.00 6 .499233
80.00 6 .517717
100.00 6 .571567
kontrol 6 1.234100
Sig. .434 1.000
Means for groups in homogeneous subsets are displayed.
Based on observed means.
The error term is Mean Square(Error) = ,022.
a. Uses Harmonic Mean Sample Size = 6,000.
3.Data Analysis of Glucose Released
Tests of Normality
jenis
Kolmogorov-Smirnova Shapiro-Wilk Statistic Df Sig. Statistic df Sig.
mg_glucose tepung .115 36 .200* .968 36 .378
pati .077 36 .200* .974 36 .546
a. Lilliefors Significance Correction
*. This is a lower bound of the true significance.
Tests of Normality
waktu
Kolmogorov-Smirnova Shapiro-Wilk Statistic Df Sig. Statistic df Sig.
mg_glucose 30.00 .122 12 .200* .956 12 .720
60.00 .149 12 .200* .926 12 .336
90.00 .171 12 .200* .925 12 .332
120.00 .173 12 .200* .944 12 .557
150.00 .160 12 .200* .885 12 .101
180.00 .137 12 .200* .945 12 .569
a. Lilliefors Significance Correction
*. This is a lower bound of the true significance.
Descriptive Statistics
Dependent Variable:mg_glucose jenis waktu Mean
Std.
Deviation N
tepung 30.00 .031517 .0093619 6
60.00 .053133 .0151852 6
90.00 .067183 .0154001 6
120.00 .078850 .0077868 6
150.00 .068933 .0086296 6
180.00 .054383 .0148087 6
Total .059000 .0191037 36
Pati 30.00 .031367 .0073823 6
60.00 .061333 .0191961 6
120.00 .076350 .0110085 6
150.00 .068783 .0088319 6
180.00 .053350 .0092677 6
Total .058894 .0186037 36
Total 30.00 .031442 .0080385 12
60.00 .057233 .0170484 12
90.00 .064683 .0153365 12
120.00 .077600 .0091843 12 150.00 .068858 .0083254 12 180.00 .053867 .0117904 12
Total .058947 .0187222 72
Tests of Between-Subjects Effects
Dependent Variable:mg_glucose Source
Type III Sum
of Squares Df Mean Square F Sig.
Corrected Model
.015a 11 .001 8.962 .000
Intercept .250 1 .250 1594.235 .000
jenis 2.006E-7 1 2.006E-7 .001 .972
waktu .015 5 .003 19.336 .000
jenis * waktu .000 5 5.972E-5 .381 .860
Error .009 60 .000
Total .275 72
Corrected Total .025 71
a. R Squared = ,622 (Adjusted R Squared = ,552)
mg_glucose
Duncana,,b
waktu N
Subset
1 2 3 4 5
30.00 12 .031442
180.00 12 .053867
60.00 12 .057233 .057233
90.00 12 .064683 .064683
150.00 12 .068858 .068858
Sig. 1.000 .513 .150 .418 .093 Means for groups in homogeneous subsets are displayed.
Based on observed means.
The error term is Mean Square(Error) = ,000. a. Uses Harmonic Mean Sample Size = 12,000. b. Alpha = ,05.
4.Data Analysis of Starch Released
Tests of Normality
Jenis
Kolmogorov-Smirnova Shapiro-Wilk Statistic Df Sig. Statistic df Sig.
digest_starch Tepung .115 36 .200* .968 36 .376
Pati .077 36 .200* .974 36 .547
a. Lilliefors Significance Correction
*. This is a lower bound of the true significance.
Tests of Normality
Waktu
Kolmogorov-Smirnova Shapiro-Wilk Statistic Df Sig. Statistic df Sig.
digest_starch 30.00 .122 12 .200* .955 12 .715
60.00 .149 12 .200* .926 12 .337
90.00 .171 12 .200* .926 12 .335
120.00 .176 12 .200* .944 12 .546
150.00 .161 12 .200* .883 12 .097
180.00 .138 12 .200* .945 12 .565
a. Lilliefors Significance Correction
digest_starch
Duncana,,b
waktu N
Subset
1 2 3 4 5
30.00 12 .028283
180.00 12 .048483
60.00 12 .051525 .051525
90.00 12 .058208 .058208
150.00 12 .061975 .061975
120.00 12 .069850
Sig. 1.000 .511 .152 .416 .092
Means for groups in homogeneous subsets are displayed. Based on observed means.
The error term is Mean Square(Error) = ,000. a. Uses Harmonic Mean Sample Size = 12,000. b. Alpha = ,05.
Descriptive Statistics Dependent Variable:digest_starch
jenis Waktu Mean Std. Deviation N
tepung 30.00 .028367 .0084227 6
60.00 .047817 .0136618 6
90.00 .060450 .0138669 6
120.00 .070967 .0070142 6
150.00 .062033 .0077940 6
180.00 .048933 .0133167 6
Total .053094 .0171931 36
Pati 30.00 .028200 .0066045 6
60.00 .055233 .0172560 6
90.00 .055967 .0146480 6
150.00 .061917 .0079570 6
180.00 .048033 .0083270 6
Total .053014 .0167483 36
Total 30.00 .028283 .0072168 12
60.00 .051525 .0153359 12
90.00 .058208 .0137991 12
120.00 .069850 .0082702 12
150.00 .061975 .0075096 12
180.00 .048483 .0105993 12
Total .053054 .0168523 72
KORELASI AMILOSA VS PATI RESISTEN (BIVARIATE – PEARSON)
Correlations
pati_resisten amilosa pati_resi
amilosa Pearson Correlation
**. Correlation is significant at the 0.01 level (2-tailed).
KORELASI AMILOSA TEPUNG (100C) VS DAYA CERNATEPUNG amilosa Pearson
Correlation
1 .509
Sig. (2-tailed) .302
N 6 6
daya_cerna_tp Pearson Correlation
.509 1
Sig. (2-tailed) .302
N 6 36
.
KORELASI AMILOSA PATI (100C) VS DAYA CERNA PATI (100C)
Correlations
AMILOSA_P
ATI WAKTU
DAYACERN A_PATI AMILOSA_PATI Pearson
Correlation
1 .a -.771
Sig. (2-tailed) .000 .073
N 6 6 6
WAKTU Pearson
Correlation
.a 1 .390*
Sig. (2-tailed) .000 .019
N 6 36 36
Sig. (2-tailed) .073 .019
N 6 36 36
KORELASI PATI RESISTEN (PATI) VS DAYA CERNA PATI
Correlations
WAKTU
DAYACERNA_
PATI PATIRESISTEN
WAKTU Pearson
Correlation
1 .390* .a
Sig. (2-tailed) .019 .000
N 36 36 3
Sig. (2-tailed) .019 .590
N 36 36 3
PATIRESISTEN Pearson Correlation
.a -.600 1
Sig. (2-tailed) .000 .590
N 3 3 3
*. Correlation is significant at the 0.05 level (2-tailed).
a. Cannot be computed because at least one of the variables is constant.
KORELASI DAYA CERNA TEPUNG VS PATI RESISTEN TEPUNG
Correlations
WAKTU Pearson
Correlation
1 .449** .a
Sig. (2-tailed) .006 .000
N 36 36 3
Sig. (2-tailed) .006 .017
N 36 36 3
Sig. (2-tailed) .000 .017
N 3 3 3