*
Corresponding author: [email protected]
Heave induced reduction of friction capacity of pile embedded in
clays
Gogot Setyo Budi1*, Gondo Wibowo Tantri2
1
Civil Engineering Department, Petra Christian University, 60236 Surabaya, Indonesia
2
PT Teno Indonesia, 60116 Surabaya, Indonesia
Abstract. Installation of new piles may cause heave which influence friction capacity of existing piles. The heave can be observed from the difference in the elevation of existing pile heads recorded before and after the installation of new piles or through load-settlement diagram from Static Load Test data. This paper presents the study of bearing capacity of hollow cylindrical concrete piles with diameter of 800 mm from two projects. The piles at Project I and Project II were hydraulically jacked into depths of 46 m and 42 m, respectively. The bearing capacity of the piles was determined from the pressing force required to install the instrumented indicator-piles, and Static Load Test performed after the installation of the new piles. The indicator-piles, which were instrumented using Vibrating Wire Strain Gauges to observe the distribution of transferred load along the piles. The pressing force required to install the piles, generally defined as mobilized bearing capacity of piles, was smaller than the bearing capacity of instrumented indicator-piles. The result shows that, the driving of the new piles reduced the bearing capacity of the existing piles to as low as 34% and 39% in Project I and Project II, respectively.
1 Introduction
Increasing demand for housing and offices in urban area drives investors to build high rise buildings, which is generally supported by pile foundations. In the past ten years, the use of hydraulically jacked-in machine has been popular in Indonesia to install pile foundation, due to its several advantages such as the absence of noise and vibration. However, driving relatively close spacing of piles generates problems such as heaving of ground surface and previously-installed piles [1, 2, 3, 4, 5, 6], increasing pore water pressure [7, 8], and lateral deformation of surrounding soil that might affect the neighbouring structures [1, 8].
Installation of several piles in a group triggers upward movement of soil within the group and it decreases gradually in lateral direction up to the distance of the pile length. In other words, the installation of a pile affects an area of surrounding soil starting from the pile tip spreads upward to the ground surface with the angle of 45° [4]. However, according to Cooke and Price [9], the heave of ground surface due to piling installation of relatively shallow piles disappears at the distance about five times pile diameter.
In general, there are several factors influence the soil heave due to pile driving, which include volume of displaced soil, thickness and depth of clay layer, pile installation procedure, existing vertical stress, etc. [3]. Meanwhile, Hagerty and Peck [1] stated that heaving of piles depends on the ratio between volume of penetrated piles and the volume of soil enclosed by a group of piles.
The installation of piles in a group not only generates heaving of soil and previously installed piles but also increases pore water pressure. The maximum pore water pressure occurs in the area around pile shaft and decreases with the distance from the installed pile [2, 7]. Pore pressure build-up in the sensitive marine clay subjected to pile driving reached 1.5 to 2 times of that hydrostatic state and it dissipated in about seven to eight months [2]. Based on the analysis conducted by Broms and Hansbo [10], the increase of pore pressure at the pile tip embedded into the marine clay was about five to seven times of its undrained shear strength. In some cases, the increase of pore water pressure surpasses the over burden pressure. The effect of pore water pressure due to pile driving disappears at the distance about twenty times pile diameter [7].
Basu et al. [11] stated that the build-up of pore water pressure due to pile driving reduces the shear strength of clays. According to Broms [12], the disturbance of soil surrounding installed pile spread out up to one diameter from the periphery of the installed pile. It was also stated that the shear strength of soil immediately around the pile during driving is reduced to the shear strength of the remoulded soil, and it recovered in one to six months.
not increase in the period up to three months. While Orrje and Broms [13] described that the disturbed soil due to installation of concrete piles regained its undrained shear strength in nine months.
The objective of the research is to study the bearing capacity of heaved piles due to driving of piles. The research was carried out in two different projects, namely Project I and Project II. Three data of bearing capacity of piles were collected. The first data were collected from instrumented piles using Vibrating Wire Strain Gauge (VWSG) that were installed prior to the projects, second data were gathered from driving records during piling, and the third were collected from Static Load Tests that were conducted after the piling activities had completed.
The piles used in both projects were hollow cylinder prestressed-concrete spun pile with diameter of 800 mm. In order to minimize the lateral deformation of surrounding soil and structures, the open-end (bottom) piles were used. The piles were installed using hydraulically jacked-in machine with total capacity about 900 ton. The length of piles tested statically at Project I and Project II was 46 m and 42 m, respectively.
2
Soil data
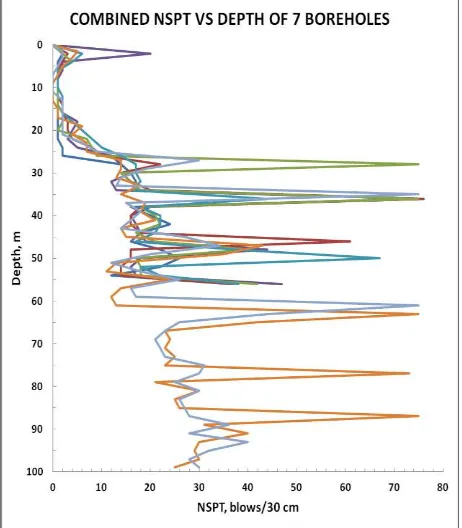
The soil stratigraphy in both projects is dominated by very soft to stiff clays. The soil layers at the two locations are quite similar, and there is no bearing layer up to the depth of 50 m. The soil profile at Project I and Project II is summarized in Table I and Table II, respectively. The value of Standard Penetration Test (NSPT) with depth is presented in Fig. 1 for Project I and
Fig. 2 for Project II.
Fig. 1. NSPT Vs depth of project I
Table 1. Soil profile at project I
Depth, m Soil Classification NSPT
0 – 3 Fill -
3 – 22 Very soft clay 0 – 2
22 – 27 Soft clay 2 – 9
27 – 29 Silt 30
29 – 33 Stiff clay 14 – 19
33 – 37 Sandy silt 14 – 75
37 - 45 Stiff clay 14 – 18
45 - 49 Sandy silt 14 – 34
49 - 53 Stiff clay 12 – 20
53 - 60 Silty clay 16 – 26
Table 2. Soil profile at project II
Depth, m Soil classification NSPT
0 - 2 Fill -
2 - 10 Very soft clay 1 - 2
10 - 15 Fine sand 17 - 18
15 - 23 Stiff clay 11 - 20
23 - 25 Fine sand 20
25 - 31 Stiff clay 18 - 24
31 - 35 Silty clay 21 - 23
35 - 37 Sandy clay 25
37 - 45 Silty clay 22 - 26
45 - 50 Stiff clay 22 - 25
3 Testing program
Bearing capacity of the tested piles was collected from the static load test on the indicator piles that were instrumented with Vibrating Wire Strain Gauges (VWSG), driving records, and Static Load Test on heaved piles. The instrumented piles were installed prior to the driving of main piles so that the soil was considered undisturbed. The piles were called as indicator piles. The driving records were gathered from the pressure gauges indicated in the hydraulic jack-in machine compartment during driving, so that the bearing capacity of the installed piles was in mobilized condition. The static load tests (Quick load) were conducted to the tested piles after the main piling activities had completed so that bearing capacity of the tested piles were very likely affected by disturbance of surrounding soil due to installation of main piles.
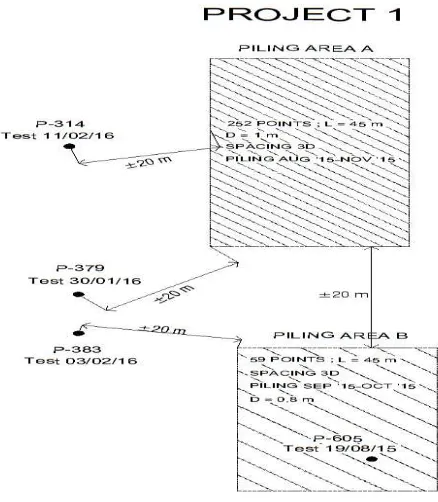
The statically load tested piles at Project I, which were conducted after the piling activity, were located about 20m from the area of piling areas, as presented in Fig. 3. Static Load Test on piles at Project I was carried out about three months after piling activity had concluded. While Static Load Test on piles at Project II was carried out about 20 days after the pile installation had finished. The location of Statically Load tested piles is presented in Fig. 4.
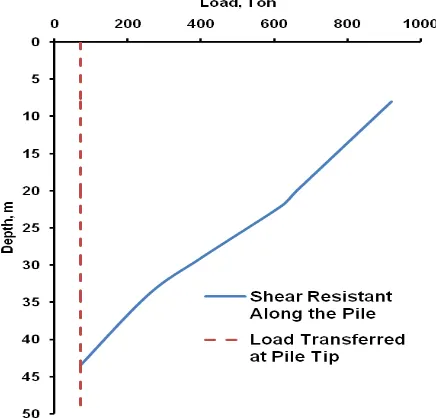
Fig. 5 and Fig. 6 present the load transferred distribution along the piles recorded from VWSG data at Project I and Project II, respectively. The data of tested piles instrumented by VWSG is summarized in Table III. The length of piles that were tested after the completion of piling of main piles was 42 m. Load settlement diagrams constructed from the records of the tested piles at Project I and Project II are presented in Fig. 7 and Fig. 8, respectively.
Fig. 3. Location of tested piles at project I
Fig. 4. Location of tested piles at project II
Table 3. Data of instrumented piles
Subject Project I
Project II
Pile diameter, mm 800 800
Length of pile, m 47.5 43.5
Applied load, ton 700 920
Load transferred at pile tip, ton 112 71 Load transferred at 46 m depth, ton 118 - Load transferred at 42 m depth, ton - 100 Friction resistant along 46 m, ton 582 - Friction resistant along 42 m, ton - 820
Fig. 6. Load transferred distribution at project II.
4 Analysis
Four piles at Project I and three piles at Project II were tested using Static Load. It shows that in general, the maximum loads can be applied to the piles were less than those recorded from the instrumented piles indicators. Fig. 7 shows that piles experienced heave about 20 mm to 25 mm. It can be seen that the bearing capacity of heaved piles, which is presumably contributed by friction capacity only, in the order between 200 ton and 400 ton compared to 582 ton of the friction capacity of instrumented pile (about 34% to 68%). The applied load increased to about 550 ton to 700 ton at the corresponding settlements of 45 mm to 50 mm.
Very significant reduction of bearing capacity of tested piles at Project II was observed, as shown in Fig. 8. The maximum load can be applied to the both tested piles was only about 320 ton. This load was determined just before the piles experienced excessive settlement. In other words, the maximum friction capacity of tested piles conducted 20 days after completion of piling activity was only 320 ton. Compared to the 820 ton friction capacity of the instrumented pile, the resistance of piles was about 39%.
The bearing capacity reduction of tested heaved piles at both projects very likely caused by the soil disturbance and pore-water pressure built-up during driving of neighbouring piles. The reduction of bearing capacity of piles at Project I, which were located about 20 m from the piling area, was smaller than that of piles in Project II, which were located in the pile group and determined in about 20 days after the piling activity had finished.
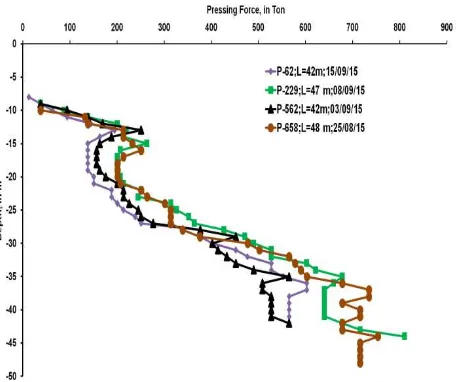
The load required to penetrate the tested piles up the depth of 42m at Project I was in the range between 300 ton and 400 ton, as depicted in Fig. 9. In addition, the force needed to re-drive the piles in the following day (about 12 hours later) was more than 700 ton. While in
Project II, the applied load to penetrate the tested piles up to the depth of 42 m were in the range between 500 ton and 700 ton, as presented in Fig. 10.
Fig. 7. Load-settlement diagrams of the tested piles at project I
Fig. 8. Load-settlement diagrams of the tested piles at project II
Fig. 10. Pressing force vs depth at project II
5 Conclusions
The study provides insight information regarding the effect of driving new piles to existing piles.
Soil heave resulted from driving the new piles induced a reduction on the friction capacity of the existing piles, thus the pressing force required to install the piles was smaller than that of the bearing capacity of indicator piles embedded in undisturbed soil, which were installed prior to the driving of the main piles.
The bearing capacity of existing piles at Project I and Project II decreased to as low as 34% and 39%, respectively due to the installation of the new piles.
The authors would like to express their gratitude and appreciation to PT. Teno Indonesia for giving permission to access all valuable data required in this research.
References
1. D. Hagerty, R. Peck. J. of The Soil Mech. and
Found. Eng. ASCE, Vol. 97, SMII 1513-1531 (1971).
2. M. Bozozuk, B.H. Fellenius, L. Samson. Can.
Geotech. J., Vol. 15, No. 3, 340-361 (1978).
3. J. P. Dugan, D. L. Freed. International Conference
On Case Histories in Geotechnical Engineering, Paper 28. (1984)
4. C. Olsson, G. Holm. Palgrundlaggning. AB Svenk
Byggtjanst Och Statens Geotekniska Institut. (Stockholm, Sweden, 1993)
5. C. Sagaseta, A. J. Whittle. J. of Geotech. and
Geoenv. Eng. ASCE. Vol. 127. Pp 55-66 (2001)
6. C. Wërsall, K. R. Massarsch, Geotechnical Special
Publication (GSP) 230 ASCE. Pp 481-499 (2013)
7. H. G. Poulos, Davis. Pile Foundation Analysis and
Design. John Wiley & Sons Inc., Canada (1980)
8. T. Hørlykke, B. Dedenroth. Proceeding of The 17th
Nordic Geotechnical Meeting: Challenges in Nordic Geotechnic. 25 – 28 May 2016, NGM, Reykjavik (2016)
9. R. W. Cooke, G. Price. Proceedings of the 8th
International Conference on Soil Mechanics and Foundation Engineering, Moscow, Vol. 2, No. 1, 53-60 (1973)
10. B. B. Broms, S. Hansbo. Foundation on Soft Clay.
Soft Clay Engineering: Developments in Geotechnical Engineering 20. Elsevier Scientific Publishing Company. Pp 417-424 (1981)
11. P. Basu, M. Prezzi, R. Salgado, T. Chakraborty. J.
of Geotech. and Geoenv. Eng., ASCE, Vol. 140, No. 3, 04013026 (2014)
12. B.B. Broms. Precast Piling Practice. Thomas
Telford Ltd., London (1981)
13. O. Orrje, B. B. Broms. J. of the Soil Mech. and