FINAL PROJECT – TI 141501
DEMAND SUPPLY ANALYSIS FOR ECO-SANITARY
PRODUCTS IN SURABAYA
INDAH PURNAMANINGTYAS NRP 2513 100 056
SUPERVISOR
Dr. Maria Anityasari, S.T., M.E. NIP. 197011201997032001
iii
APPROVAL SHEET
DEMAND SUPPLY ANALYSIS FOR ECO-SANITARY PRODUCT IN
SURABAYA
FINAL PROJECT
Submitted to Qualify the Requirement of Bachelor Degree Department of Industrial Engineering
Faculty of Industrial Technology Institut Teknologi Sepuluh Nopember
Author:
INDAH PURNAMANINGTYAS
NRP 2513 100 056
Acknowledged and Approved by,
Final Project Supervisor
Dr. Maria Anityasari, S.T., M.E.
NIP. 197011201997032001
iv
v
DEMAND SUPPLY ANALYSIS FOR ECO-SANITARY PRODUCT IN
SURABAYA
Name : Indah Purnamaningtyas Student ID : 2513100056
Supervisor : Dr. Maria Anityasari, S.T., M.E.
ABSTRACT
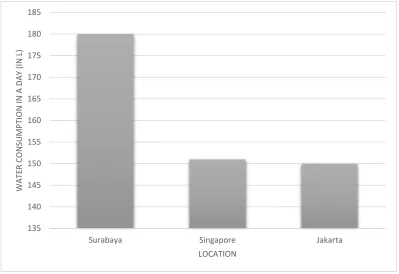
The water consumption in Surabaya is considered higher than Jakarta and Singapore. This situation could lead to water crisis in 2018. The use of eco-sanitary products (ESP) is one way to reduce water usage, thus delay the water crisis. However, up to now there is no any study addresses the implementation or the use of eco-sanitary products in the society. This study analyzes the demand and the supply side of ESP product in Surabaya city. Statistical model approach with logistic binary regression was used for analyzing of the influence factors in the demand side analysis by using sample of 440 households. Meanwhile, the willingness to change and to pay analysis in the demand side is using mathematical scoring and mode approach respectively. Data crosstabulation was used to process the data of the supply side analysis. The findings shows that there are only 14.3% from the total surveyed households which is categorized as eco-household. There are four factors identified that may influence the ESP usage, which are household income level, household spending, awareness to water crisis and ESP knowledge. In addition, only medium income level that do not influence the ESP usage. The willingness to change analysis results that there are three drivers for the people to change, which are sanitary product price, product impact on water savings and government subsidy. From the supply side survey, the market of faucets is ready to provide eco product to the customer because of the high availability of eco-faucets in the market. Most of the salesman has lack of knowledge about eco-sanitary product and the eco features on water saving is not the main concern for the selling strategy.
vi
vii
1.
ACKNOWLEDGEMENT
Praise the Lord for His abundance blessings which enables the author to successfully accomplish this final project with title “Demand Supply for Eco -Sanitary Product in Surabaya” just in time. This final project is requisite to achieve Bachelor Degree in Industrial Engineering Department of Institut Teknologi Sepuluh Nopember Surabaya. Along the processes, the author receives help, motivation, and support from many parties. Here, the author would like to express sincerest gratitude to:
1. Beloved parents, Gembong Baskoro and Endang Purwantini; the kindest sisters, Jayanti Aarnee Kuusumadewi and Europa Herfani Baskoro; and the
whole author’s family who always give support and prayers to the author.
2. Dr. Maria Anityasari, S.T., M.E., as author’s final project supervisor who has guided the author patiently and wisely.
3. Effi Latiffianti, S.T., M.Sc. amd Dyah Santhi Dewi, S.T., M.Eng.Sc, Ph.D as the research proposal examiners; Ir. Hari Supriyanto, MSIE and Dewanti Anggrahini, S.T., M.T. as final project examiners, whose positive
recommendations have improved the quality of the author’s research.
4. Ir. Hari Supriyanto, MSIE, as author’s guardian lecturer who has guided and helped the author patiently every semester.
5. All lecturers and academic staffs of Industrial Engineering Department of Institut Teknologi Sepuluh Nopember, who shared their knowledge and experiences to the author. Their helps are highly appreciated.
6. Mbak Mar’atus Sholikah, Mbak Lucky Caesar, Mbak Mutiara Lasahido, who have directed and helped the author in understanding and improving the research.
7. Industrial Engineering ITS Students year 2016, who has been the surveyor and helped the author in obtaining data.
8. Fellows in International Class 2013, who have gone together with the author through lectures, assignments, and exams.
viii
10. Everyone else who has not been mentioned.
11. The author recignizes that this bachelor thesis is far from prefection. Constructive suggestions and critics will be highly appreciated. May this research deliver usefulness for both academic and practical world.
Surabaya, July 2017
ix
1.3 Purposes of Research ... 4
1.4 Benefits of Research ... 4
1.5 Scope of Research ... 5
2.2.1 Sanitary Product Classification ... 11
2.2.2 Sanitary Product Supply Chain ... 14
2.3 Eco Standards for Sanitary Products ... 15
2.4 Survey Design ... 18
2.5 Data Display and Summary ... 19
2.5.1 Descriptive Statistics ... 19
2.5.2 Graphical Display Methods ... 19
2.5.3 Crosstabulations ... 20
2.6 Categorical Response Data ... 20
x
2.10 Summary of Previous Researches ... 25
CHAPTER 3 METHODOLOGY ... 28
3.1 Preliminary Literature Study ... 29
3.1.1 Literature Review ... 29
3.1.2 Direct Observation ... 29
3.2 Questionnaire and Survey Design ... 30
3.3 Data Collection ... 30
3.3.1 Data Collection from Supply Side ... 30
3.3.2 Data Collection from Demand Side... 30
3.4 Data Processing and Tabulation ... 31
3.4.1 Influencing Factor for ESP Usage ... 31
3.4.2 Willingness to Change and Willingness to Pay ... 31
3.5 Data Analysis ... 32
3.5.1 Supply-Demand Analysis ... 32
3.5.2 Gap Analysis ... 32
3.6 Conclusion and Suggestions ... 32
3.7 Research Methodology Flowchart ... 32
CHAPTER 4 DEMAND SIDE ANALYSIS ... 36
4.1 Household Survey ... 37
4.1.1 Questionnaire Design ... 37
4.1.2 Survey Design ... 39
4.2 Household Survey Result ... 42
4.2.1 Descriptive Household Survey Result ... 45
4.2.2 ESP Usage Household Survey Result ... 52
4.3 Understanding Influencing Factors with ESP Usage ... 55
4.3.1 Flowchart of the Influencing Factor with ESP Usage Analysis ... 56
xi
4.5 Market Potential Demand Analysis ... 75
4.6 Willingness to Pay ... 77
CHAPTER 5 SUPPLY SIDE ANALYSIS ... 79
5.1 Supplier and Retailer Survey ... 79
5.1.1 Questionnaire Design ... 79
5.1.2 Survey Design ... 81
5.2 Survey Result ... 82
5.2.1 Retailer Survey Result ... 82
5.2.2 Interview Survey Result ... 87
CHAPTER 6 CONCLUSION AND SUGGESTION ... 93
6.1 Conclusion ... 93
6.2 Suggestions ... 94
REFERENCES ... 95
xii
xiii
LIST OF FIGURES
Figure 1.1 Water Consumption ... 2
Figure 1.2 Number of PDAM’s Customer ... 3
Figure 2.1 The Global Situation of Fresh Water ... 9
Figure 2.2 The Big Picture of Water Cycle ... 10
Figure 2.3 Water Faucets ... 12
Figure 2.4 Shower ... 12
Figure 2.5 Toilet Spray ... 12
Figure 2.6 Urinals ... 13
Figure 2.7 Western Style Toilets ... 13
Figure 2.8 Indonesian Squat Toilets ... 13
Figure 2.9 Latrine Supply Chain Map for Foreign Products in East Java ... 14
Figure 2.10 Latrine Supply Chain Map for Local Products in East Java ... 15
Figure 3.1 Research Methodology Flowchart ... 34
Figure 3.2 Research Methodology Flowchart (cont.) ... 35
Figure 4.1 Relationship between Section in Questionnaire ... 39
Figure 4.2 Survey Execution ... 43
Figure 4.3 Gender and Religion of Surveyed Respondents ... 46
Figure 4.4 Education Level and Infant Availability of Surveyed Respondents.... 46
Figure 4.5 Occupation of Surveyed Respondents ... 47
Figure 4.6 Amount of Family Member of Surveyed Respondents ... 47
Figure 4.7 House Ownership of Surveyed Respondents ... 48
Figure 4.8 Monthly Clean Water Consumption ... 49
Figure 4.9 Monthly Water Bill ... 49
Figure 4.10 Awareness to Water Crisis ... 50
Figure 4.11 Eco-Sanitary Product Knowledge ... 51
Figure 4.12 Willingness to Change ... 52
Figure 4.13 Eco-Sanitary Classification Procedure ... 53
Figure 4.14 Current Market of Eco-Sanitary Product ... 55
xiv
Figure 4.16 Flowchart of Influencing Factor with ESP Usage... 58
Figure 4.17 Reference Category in LBR Univariate Test for Income Level ... 64
Figure 4.18 Reference Category in LBR Univariate Test for Spending ... 66
Figure 4.19 Reference Category in LBR Univariate Test for Awareness Level ... 68
Figure 4.20 Reference Category in LBR Univariate Test for ESP Knowledge .... 70
Figure 4.21 Recapitulation for Willingness to Change Drivers ... 73
Figure 4.22 Reasons for Not Willing to Change ... 75
Figure 4.23 Market Potential Analysis Illustration ... 76
Figure 5.1 Eco Classification for Sanitary Product ... 83
Figure 5.2 Aerator on Faucet and Double Flush on Toilet ... 83
Figure 5.3 Interview with TOTO Distributor ... 88
Figure 5.4 TOTO Sanitary Sales Volume ... 89
Figure 5.5 TOTO Main Customer ... 89
Figure 5.6 Contractor as Main Customer of TOTO Sanitary Products ... 90
Figure 5.7 TOTO Official Website Interface ... 90
xv
LIST OF TABLES
Table 2.1 Direct Sanitary Products Description ... 12
Table 2.2 Indirect Sanitary Product Description ... 13
Table 2.3 Eco Standards for Sanitary Products ... 16
Table 2.4 Eco Standards for User Interface Sanitary Products (cont.) ... 17
Table 2.5 Eco Standards for User Interface Sanitary Products (cont.) ... 17
Table 2.6 Summary of Previous Researches ... 26
Table 3.1 Eco Standards for Sanitary Product ... 31
Table 4.1 Questionnaire Factor Determination ... 38
Table 4.2 Sample Size Calculation for Survey Design for each District ... 40
Table 4.3 Number of Surveyed Respondents ... 42
Table 4.4 Number of Surveyed Respondents (cont.) ... 43
Table 4.5 Pearson Correlation Test Result ... 45
Table 4.6 Statistical Validation Test Result ... 45
Table 4.7 Eco Standards in Sanitary Products for Water Saving Purpose ... 52
Table 4.8 Amount of Eco-Sanitary User in Household ... 54
Table 4.9 Current Market of Eco-Sanitary Product in Household ... 54
Table 4.10 List of Factors ... 59
Table 4.11 Factors Tested in Independency Test ... 60
Table 4.12 Independency Test for X-Y Factors ... 62
Table 4.13 Pearson Chi-Square (Independency Test) Between X Factor... 63
Table 4.14 LBR Univariate Test Result for Income Level (X5) ... 64
Table 4.15 Recapitulation of LBR Test on Household Income Level (X5) ... 65
Table 4.16 LBR Univariate Test Result for Household Spending (X6) ... 66
Table 4.17 Recapitulation of LBR Test on Household Spending (X6) ... 67
Table 4.18 LBR Univariate Test Result for Awareness to Water Crisis (X13) .... 67
Table 4.19 Recapitulation of LBR Test on Awareness to Water Crisis (X13) ... 69
Table 4.20 LBR Univariate Test Result for ESP Knowledge (X14) ... 69
Table 4.21 Recapitulation of LBR Test on ESP Knowledge (X14) ... 71
xvi
Table 4.23 Scoring Calculation for Willingness to Change Drivers ... 73
Table 4.24 Normalized Score Calculation for Willingness to Change Drivers ... 74
Table 4.25 Willingness to Pay Calculation ... 78
Table 5.1 List of Retailer Surveyed in Supply Side Analysis ... 82
Table 5.2 Retailer Survey Result ... 84
Table 5.3 Existing Faucet Brand Availability in the Market ... 85
Table 5.4 Existing Urinal Brand Availability in the Market ... 85
Table 5.5 Existing Toilet Brand Availability in the Market ... 86
Table 5.6 Existing Shower Brand Availability in the Market ... 86
1
1.
CHAPTER I
INTRODUCTION
In this chapter, the basic reason and problem identification of the research will be explained thoroughly. This chapter explains in detail about research background, problem identification, research limitations, research purposes, research benefits, and writing methodology.
1.1 Background
Water is an unlimited source yet crucial to the living and it is used in everyday life. Water is commonly used for household needs such as for drinking, cooking, cleaning, bathing, and watering. In worldwide, industries use twice amount of water than households. In Indonesia, water is classified into four levels (BPPT, 2015). The level indicates the purity of the water quality. Level 1 is used for drinking while level 4 is used to irrigation and watering plants.
Surabaya, the biggest city in Indonesia, has reached more than 2,8 million of population in 2014. There are many programs developed by the city mayor in order to improve this big city. Recently, “Smart City” and “Green and Clean
Kampung” are the programs offered by the government in order to improve the city. Meanwhile, water problems never been exposed to the the public. Water is the main component of human living and it is our responsibility to maintain the sustainability of clean water.
2
consumption compared to Jakarta and Singapore which have average daily water consumption 150 liters and 151 liters respectively.
Figure 1.1 Water Consumption (SurabayaNews, 2014)
In Surabaya, clean water supply is maintained by clean water company or
Perusahaan Daerah Air Minum (PDAM). The water consumption in Surabaya is
then projected and leads to a water crisis in 2018 (SurabayaNews, 2014).
3
Figure 1.2 Number of PDAM’s Customer (PDAM, n.d.)
Since the largest customer of PDAM is household, it could be stated that household influences the most on water consumption (PDAM, n.d.). Therefore, higher efficiency of water usage, particularly in household, has to be strived. Sanitary product manufacturers have developed eco-sanitary products. The main feature of eco-sanitary products is to reduce the use of water. Eco-toilet, for an example, replaces conventional 4 gallons per flush (gpf) with 1.6 gpf. It will save approximately 12 gallons of water per day per person, which translates into over 4000 gallons each year (PennState, 2017).
In a nutshell, eco-sanitary products have been developed to lessen water footprint (water consumption) either direct or indirect. Water footprint is a measure
of human’s appropriation of fresh water in volumes of water consumption and/or discharge. The water footprint can also tell how much water is being consumed by a particular country (WaterFootprint.org, n.d.).
4
1.2 Problem Identification
The problem that will be investigated in this research is twofold. The first part is to investigate the level of eco-sanitary utilization in Surabaya. Included in this part is the question to what extent society aware and understand about the water condition in Surabaya, and to what extent they are willing to change the way they use and treat water. The second part is to assess the supply side of eco-sanitary products in Surabaya. Without adequate supply, it is not possible for society to purchase and utilize the eco-sanitary products.
1.3 Purposes of Research
The purpose of the research are:
1. To understand the demand side of the eco-sanitary products in Surabaya. The demand side will be measured by the level of awareness/level of concern towards water crisis in Surabaya and the level of utilization of the eco-sanitary products.
2. To understand the factors that influences the eco-sanitary usage. 3. To understand the willingness to change of the society toward
eco-sanitary products.
4. To assess the supply side of eco-sanitary products in Surabaya.
5. To recommend policies and action plans to increase the use of eco-sanitary products in Surabaya.
1.4 Benefits of Research
The benefits of the research are: a. For Government:
1. Knowing the the main cause or behavior for water crisis.
2. Mapping and identifying the main problem of eco-sanitary products supply chain in Surabaya.
b. For Customer:
5
2. Understand the function of eco-sanitary wares and how much the savings of using eco-sanitary wares.
c. For Distributor and Retailer:
1. Knowing the end-user perspective or voice of customer (VoC) of
The limitations in research are determined in order to narrow the scope and focusing the research on the key problem. The limitations in this research are:
a. Sanitary products to be discussed in this research are: Bathroom faucets;
Urinals and toilets; Showers;
Toilet spray;
b. 31 kecamatan in Surabaya will be the main focus for the project Supply Demand Analysis for Eco-Sanitary Products.
c. The demand in this research is limited only for household.
d. The supply in this research is limited only for sanitary retailer and distributor.
1.5.2 Assumptions
This subchapter explains about the assumptions used in the research. The assumptions are:
6
b. Faucet with aerator has maximum 8 liter/minute flowrate.
c. The household is classified as “eco” user when they install one or more than one ESP in their home.
d. Significant level used is 5%.
e. e value (irrational number for regression calculation) is 2.71.
f. Awareness to water crisis and ESP knowledge represents as one household.
1.6 Writing Methodology
This research consists of six chapters, which will be explained below.
CHAPTER I INTRODUCTION
In this chapter, the basic reason and problem identification of the research will be explained thoroughly. This chapter explains in detail about research background, problem identification, research limitations, research purposes, research benefits, and writing methodology.
CHAPTER II LITERATURE REVIEW
Literature review scrutinizes theories that will be used in this research. This chapter explains about water overview, sanitary products, eco standards for snaitary products, transition of people decision, survey design, data display and summary, and supply/demand assessment including the forecasting method.
CHAPTER III METHODOLOGY
Research methodology gives guidance of the steps or activities that are involved in the research in order to do the supply chain assessment for eco-sanitary products in Surabaya. The methodology will be explained through flowchart and description of conducted activities in the research.
CHAPTER IV DEMAND SIDE ANALYSIS
7
analysis includes the data of demographic profile, awareness to water crisis, sanitary facility ownership and willingness to change from the ordinary sanitary ware to eco-sanitary ware.
CHAPTER V SUPPLY SIDE ANALYSIS
Supply side analysis explains about the condition of the eco-sanitary product in stores, especially in Surabaya. The data of supply side are collected using survey and interviews to the retailers and distributors. The supply side analysis includes the data of eco-sanitary market overview, monthly sales, product selling price, retailer locations, and sanitary ware manufacturer and/or importer.
CHAPTER VI CONCLUSION AND SUGGESTION
8
9
2
CHAPTER 2
LITERATURE REVIEW
Literature review scrutinizes theories that will be used in this research. This chapter explains about water, sanitary products, transition of people decision, and supply/demand assessment including the forecasting method.
2.1 Water Overview
Water is an unlimited source that is provided by the earth but it is not distributed evenly to the globe. This subchapter explained about the global water situation, water usage, water classifications, and water distribution.
2.1.1 Global Water Situation
Less than 3% of the world’s water source is fresh water, while the rest of it, is seawater and it is undrinkable (UNWater, 2006). As explained in the Figure 2.1 below, 3% over 2.5% is frozen water and it is not available for human living. The 0.5% of fresh water is stored underground and has been exploited by human to support drinking water (50%), industrial water usage (40%) and water irrigation needs (20%).
10
2.1.2 Water Cycle Process
The fresh water were created through a cycle called water cycle. The water cycle is the continuous process of water evaporating, becoming cool and condensing, and then returning to the earth in the form of precipitation (SciLearningHub, n.d.). Warm energy from the sun heats our planet that makes the water molecules at the surface of the bodies of water absorb heat and may escape into the air as water vapor. This transformation of a liquid to gas is called evaporation. The water moves up and away from the evaporation surface. The vapor molecules go up in the air and get contact with areas of low pressure. This situation makes the air expands and become cooler. The air may cooled by heat loss and form minute droplets. This transition of a gas into a liquid is called condensation. The droplets collect and form larger particles and they fall to earth. This falling droplets is calling precipitation. These droplets that fall to the earth may run off the surface or soak into the ground. Water molecules may thus be involved in evaporation, condensation, precipitation and run-off in a continuous cycle.
11
2.2 Sanitary Products
Sanitary refers to facilities and services for the safe disposal of human excreta, maintenance of hygienic conditions, through services such as garbage collection and wastewater disposal (UNESCO-IHE, n.d.). The two main purposes of the sanitation system are:
- Protect and promote health
Sanitation system carry the disease included in the waste away from people, toilets and homes. Using a good sanitation system means it can break the spread of the disease and prevent the spreading of water borne diseases. By reducing the spread of the disease, the health and the quality of life are improved.
- Protect the environment against pollution
The sanitation system is part of waste management. It maintains the disposal process of the waste and it could prevent the environmental pollution (air, soil, emission). Since sanitation is related to water, it could prevent contamination to the surface and ground water.
2.2.1 Sanitary Product Classification
The sanitary wares include hardware (facilities) and software (rules, regulation and hygiene). The sanitary hardware refers to infrastructure to support human disposal, conveyance, and solid waste. The sanitation wares are divided into three main groups, which are:
a. Direct Sanitary Products
12 Table 2.1 Direct Sanitary Products Description
Product Figure and Name Description
Figure 2.3 Water Faucets
Water Faucet
The water faucet is commonly placed at the bathroom or kitchen sink. It is used to deliver water from the pipes to be used directly by the user. Some faucet has aerator that is placed in the faucet head, it creates no-splashing stream and often delivers a mixture of water and air.
Figure 2.4 Shower
Shower
Shower is a tool to spray water that is used to bath. The water sprayed is either warm or cold water. There are many types of shower available in the stores. The showers are facilitated with several types of sprays so that the user can feel different sprays in one unit of shower.
Figure 2.5 Toilet Spray
Toilet Spray
Toilet spray are mostly used for wet toilets. This product is also easily found in outdoors and garden. It could spray water with high pressure according to the pressure capacity of each spray.
b. Indirect Sanitary Product
13 Table 2.2 Indirect Sanitary Product Description
Product Figure and Name Description
Figure 2.6 Urinals
Urinal
The urinal is used primarily used by males. It can take the form of a container or simply a wall, with automatic or manual flushing. This urinals is intended to be utilized from a standing position.
Figure 2.7 Western Style Toilets
Figure 2.8 Indonesian Squat Toilets
Toilets
The toilets are commonly used in every building and construction. It is used for the storing or disposal of human urine and feces.
14
2.2.2 Sanitary Product Supply Chain
In East Java, the market of sanitary products creates its own supply chain diagram. The supply chain diagram of sanitary products in East Jawa will be explained through Figure 2.14 for imported latrine products and Figure 2.15 for local latrine products. This section summarizes the flow of sanitary product from manufacturers to end-customer.
Figure 2.9 Latrine Supply Chain Map for Foreign Products in East Java (Nielsen, 2009)
15
The local brands that located in East Java has supply chain as shown in the Figure 2.15. The manufacturers located in East Java usually do not have specific distributors but the sales person who will approach directly the stores or retailers and build working relationship. These stores and retailers will also function as sub-distributors according to their scope and consumer base.
Figure 2.10 Latrine Supply Chain Map for Local Products in East Java (Nielsen, 2009)
The end-customer of the latrine supply chain diagram is differentiated into two types, which are individual buyer and collective buyer.
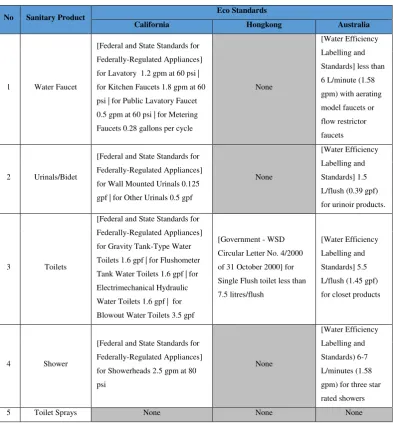
2.3 Eco Standards for Sanitary Products
16 Table 2.3 Eco Standards for Sanitary Products
No Sanitary Product
Eco Standards
Standard Nasional Indonesia USA EPAct USA WaterSense
17
Table 2.4 Eco Standards for User Interface Sanitary Products (cont.)
No Sanitary rate <= 1.6 gpm (no pressure specified)
None
Table 2.5 Eco Standards for User Interface Sanitary Products (cont.) No Sanitary Product Eco Standards
California Hongkong Australia
1 Water Faucet
[Federal and State Standards for Federally-Regulated Appliances] for Lavatory 1.2 gpm at 60 psi | for Kitchen Faucets 1.8 gpm at 60 psi | for Public Lavatory Faucet 0.5 gpm at 60 psi | for Metering Toilets 1.6 gpf | for Flushometer Tank Water Toilets 1.6 gpf | for Electrimechanical Hydraulic Water Toilets 1.6 gpf | for Blowout Water Toilets 3.5 gpf
18
2.4 Survey Design
Data can generally be classified into two categories: populations and samples (Evans & Olson, 2003). A population consists of all item of interest for a particular decision or investigation. A sample is a subset of a population. Since a wide variety of data cshould be obtained, survey data have numerous uses. Surveys are the most flexible means of obtaining data from respondents. Surveys are
primary means of obtaining information about respondents’ motives, attitudes, and
preferences (Malhotra, et al., 2002). The survey is done to all District and Kelurahan in order to be able to represent the existing condition of Surabaya. The survey is done by interviewing every respondent that meets the requirement. The survey is conducted to obtain data from both supply and demand side. Surveys are also useful for determining product image, measurement and positioning.
Before conducting the survey, the sample size is calculated in order to determine how many surveys should be done. The data gathered using stratified sampling. Stratified sampling refers to the sampling designs where the finite population is partitioned into several subpopulations, called strata, and sample draws are made independently across each strata (Kim, n.d.). A stratified sample would choose a sample of individuals in each ward proportionate to its size (Malhotra, et al., 2002). The benefit if stratified random sampling is its ability to facilitate meaningful comparisons between strata. Strata can be defined as the different levels of supply and demand, different facility types, or different ownership of the facilities (USAID, 2009).
Sampling plan is a description of the approach that will be used to obtain samples from population prior to any data collection activity (Evans & Olson, 2003). The method that is used to determine the sample size of the survey is using the formula as explained below.
Formula for calculating a sample for proportions:
Where:
19
Statistical measures provide an effective and efficient way of obtaining meaningful information. In order to inform the survey result, the data should be displayed using the right tables or charts and summarized appropriately using the correct method. The descriptions below explains the theory used to display and summarize the data gathered in this research.
2.5.1 Descriptive Statistics
Statistics are summary measures of population characteristics from samples. Descriptive statistics refers to a collection of quantitative measures and ways of describing data (Evans & Olson, 2003). This includes frequency distributions and histograms, measures of central tendency (mean, median, mode), and measures of dispersion (range, variance, standard deviation).
2.5.2 Graphical Display Methods
To illustrate the use of descriptive statistics, the graphical diplay methods is provided in this research.
a. Bar Chart
Bar charts are commonly used and it is a clear way of presenting categorical data or any ungrouped discrete frequency observations. It also provides a simple method of quickly spotting simple patterns of popularity within a discrete data set.
b. Histograms
20
a graphical depiction of a frequency distribution in the form of a column chart. Producing a histogram is much like producing a bar chart and in many respects can be considered to be the next stage after producing a grouped frequency table.
c. Pie Chart
Pie chart is a simple diagram for displaying categorical or grouped data. It is shows the proportions of a whole. A pie chart consists of a circle divided into segments, one segment for each category. The size of each segment is determined by the frequency of the category and measured by the angle of the segment.
d. Time Series Plot
Time series plot is data collected over time and connected by lines. This plot clearly show two things. First, there is an upwards trend to the data. Second, There is some regular variation around this trend
2.5.3 Crosstabulations
Crosstabulation, also known as contingency table analysis, is one of the most useful analytical tools and is a main-stay of the market research industry. Crosstabulation is analysis of data in tables and is also called contingency table analysis. It deals with analysis of tabular data, which implies analysis of categorical variables (Garson, 2012). Crosstabulation procedure is designed to summarize two columns of attribute data. It constructs a two-way table showing the frequency of occurence of all unique pairs of values in the two columns.
The Chi-square statistic is the primary statistic used for testing the statistical significant of the crosstabulation table. Chi-square tests whether or not the two variables are independent. If the variables are independent, or have no relationship, then the result of the statistical test will be “non-significant”. It means that there is no relationship between the variables.
2.6 Categorical Response Data
21
by research studies in the social and biomedical sciences. Categorical scales are soaked in the social sciences for measuring attitudes and opinions. Categorical scales are also frequently occur in the behavioral sciences, epidemiology and public health, genetics, zoology, education, and marketing (Agresti, 1990). Categorical variables are many types. The types are explained below.
a. Response-Explanatory Variable Distinction
Most sstatistical analyses distinguish between response (or dependent) variables and explanatory (or independent) variables. For instance, regression models describe how the mean of a response variable, such as selling price of a house, changes according to the values of explanatory variables, such as footage and location.
b. Nominal-Ordinal Scale Distinction
Categorical variables have two primary types of scales.variables having categories without a natural ordering are called nominal. Meanwhile, many categorical variables do have ordered categories. Such variables are called ordinal.
c. Continous-Discrete Variable Distinction
Variables are classified as continous or discrete, according to the number of values they can take. Actual measurement of all variables occurs in a discrete manner, due to precision limitations in measuring instruments.
d. Quantitative-Qualitative Variable Distinction
Nominal variables are qualitative in which distinct categories differ in in quality, not in quantity. Interval variables are quantitative in which distinct levels have differing amounts of characteristic of interest.
2.7 Independency Test (Pearson Chi-Square)
22
general, and can be used with variables measured on any type of scale, nominal, ordinal, interval, or ratio. The only limitation to use this test is that the sample sizes must be sufficiently large to ensure that the expected number of cases in each category is five or more. This rule can be modified, butas with all approximations, larger sample sizes are preferable to smaller sample sizes. The chi square statistic can be used to test any contingency or cross classification table for independence of the two variables.
The test for independence of X and Y begins by assuming that there is no relationship between the two variables. The hypotheses are:
Ho: No association between X and Y
Ha: There are some association between X and Y
The chi square statistic computed from the observed and expected values is calculated, and if this statistics is in the region of rejection of the null hypothesis, then the assumption of no relationship between X and Y is rejected. If the chi square statistic is not in the critical region, then the null hypothesis of no relationship is not rejected.
2.8 Logistic Binary Regression
The logistic binary regression is appropriate when the response takes one of only two possible values representing success and failure, or more generally the presence or absence of an attribute of interest. The response of this type of regression (Y) is binary, assuming only two values that for convenienve coded as one or zero (Agresti, 1990). Generally, logistic regression is well suited for describing and testing hypotheses aboutrelationships between categorical outcome variable and one or more categorical or continous predictos variables (Peng, et al., n.d.). The logistic regression model is:
23
Rather than focusing only on values of the parameter estimates, focus for a logistic regression is often on odds and odds ratio. An odds ratio greater than 1is an indication that the odds for A are larger than the odds for B. Since odds and odds ratios are constructed from probabilities, it can never be negative.
Goodness-of-fit statistics assess the fit of a logistic model against actual outcomes. The inferrential goodness-of-fit test is Hosmer-Lemeshow test suggesting that the model was fit to the data well. In other word, the null hypothesis of a good model of fit to data was tenable (Peng, et al., n.d.).
2.9 Demand/Supply Assessment
Supply/demand assessment is used for understanding of markets. It is critical to maximize the potential and minimize risk. The supply/demand assessment includes two tools, which are the supply/demand analysis and gap analysis process.
In this research, the supply/demand assessment is to understand the demand side by investigating the level of eco-sanitary utilization in Surabaya and also the supply side of eco-sanitary products in Surabaya. This research also includes the forecasting method in order to predict the future condition of eco-santary product supply and demand. The forecasting is based on the data collection from questionnaire.
2.9.1 Demand Analysis
The forecasting method is done in this analysis in order to capture the future demand condition of sanitary product. The stakeholders of the demand analysis are the end-consumer. The end-consumer are divided into two, which are individual buyer and collective buyer. Individual buyers are household owners who buy sanitary products in small numbers for personal use. Meanwhile, collective buyers are contractors who buy sanitary products in a larger number for a specific construction project such as public facilities, residences, office buildings, etc.
24
The demographic profile is a socioeconomic characteristic of a population expressed statistically. The information that contained in demographic profile are gender, age, religion, education, occupation, income, spending, building ownership and the environment type. b. Awareness to Water Crisis
Water crisis is the next milestone that Surabaya will face in the nearly future. Therefore, the citizen should be more aware to this issue and expected be more conserve to the clean water in Surabaya.
c. Sanitary Facility Ownership
Sanitary facility ownership shows what is the most compulsory ware that is being used for every user and also put more attention on what type of prefereble brand for sanitary ware.
d. Willingness to Change
Willingness to change or the ability to change is the measure of the cognitive buy-in to the change. In this research, the willingness to change refers to the measure of sanitary user for willing to change to use eco-sanitary wares.
2.9.2 Supply Analysis
In supply analysis, the supply source is determined at the early stage. The supply curve is constructed after the database of all current capacity is constructed. The forecasting method is necessary to be done in this analysis in order to explain the future condition of the supply of the sanitary product.
In this research, the supply side stakeholders are retailer, manufacturer and/or distributor. Retailers are defined as stores that sell sanitary products components to end-customer and/or smaller retailers. Manufacturers are defined as the company that is responsible to produce the product and be able to sell them to the direct customer or the retailer through distributors.
The data collected in the supply side are: a. Sanitary Market Overview
25
exchange of commodity and service. The market overview of sanitary wares take place in Surabaya. The data is collected through survey and interview.
b. Sales and Pricing of Sanitary Products
The sales and pricing of sanitary products informs the differences between sanitary ware and eco-sanitary wares in terms of pricing and sales in each period.
c. Retailer Classification and Locations
The retailer is then classified into three types, which are low-level, middle-level, and upper-level of retailer. The spread of those three levels will be captured in Surabaya locations in order to map the location of the sanitary product retailer and the residence (customer).
d. Sanitary Ware Manufacturer and Importer
The sanitary ware manufacturer and importer is interviewed to give producer perspective about sanitary market.
2.9.3 Gap Analysis
The gap analysis synthesizes the data gathered in the demand analysis and supply analysis. The result to the gap analysis will identify how much the gaps and surpluses in the nearly future.
A gap indicates a future shortage of the product required. By identifying the gap well in advance, the strategies can be appropriately planned to prevent the projected gap from becoming a problem. Meanwhile, the surplus indicates the excess product required. Again, an advance planning will allow strategies to be implemented in order to minimize the adverse impact in the nearly future.
2.10 Summary of Previous Researches
26 Table 2.6 Summary of Previous Researches
Parameter Previous Research
Year 2008 2009 2011 2013
Type Field Note Research Report Master Thesis Research Report
Author Water Sanitation
Program Nielsen Indonesia Dian Titi Indrasari World Bank Group
Title
27
28
29
3
CHAPTER 3
METHODOLOGY
The research methodology provides guidance of steps or activities that involved in the research in order to do the supply chain assessment for eco-sanitary products in Surabaya.
3.1 Preliminary Literature Study
The purpose of preliminary study is to identify and formulate the problem of Supply-Demand Analysis of Eco-Sanitary Products in Surabaya. This phase consists of two main activities which are literature review and direct observation.
3.1.1 Literature Review
Literature review is done to collect any relevant information and gain knowledge or deeper insight regarding the existing problem in the research. The information in literature review relates to the main topic in the research such as the sanitary products, eco standards for sanitary products, survey design, data display and summary, transition of people behavior, and supply-demand assessment.
3.1.2 Direct Observation
The direct observation captures the real or current situation of the object observed by interviewing all observed objects. The situation is observed from two sights which are the demand side and the supply side.
- Demand Side
30 - Supply Side
The supply side observation aimed to obtain the supplier point of view about selling the eco-sanitary product. The supply side observation objects are retailer or wholesaler, manufacturer and distributor of eco-sanitary products.
3.2 Questionnaire and Survey Design
The survey design was made in the early stage of the research and it was part of planning process before conducting survey to household nor supply side. The survey design starts with the questionnaire design. Since the survey method is one-by-one interview, the questionnaire was made to be the outline of the interview process in the survey. There are three surveys done in this research which are household survey, retailer survey, and distributor survey. Each of the survey has different questionnaire design. After the questionnaire was made, the sample size is determined at the design phase in order to determine how many samples should be surveyed.
3.3 Data Collection
Data collection aimed to show the process of data collecting that will be used in the research. The data collection will be divided into two types, which are primary data and secondary data. The data gathered is from questionnaire that is spreaded to demand side and supply side. The survey was done by interview.
3.3.1 Data Collection from Supply Side
In order to obtain sufficient data from the supply side, the information should be collected completely in this process. The data needed for the supply side is the product brand, product type, product selling price, the retailer locations, manufacturer and importer of eco-sanitary products.
3.3.2 Data Collection from Demand Side
31
awareness to water crisis, sanitary facility ownership, willingness to change from ordinary sanitary wares to eco-sanitary wares and willingness to pay.
3.4 Data Processing and Tabulation
Data processing and tabulation includes all process that are used to arrange the collected data into a useful information. The data processing has several process which are identifying factors that can affect the ESP usage using logistic binary regression so it can be used as forecasting for future state of the supply-demand for eco-sanitary products. In order to classify the sanitary product into eco or not, the standards that were used are described in Table 3.1.
Table 3.1 Eco Standards for Sanitary Product
No Sanitary Products Standard Used Specification
1 Faucets Indonesia – Peraturan Menteri
Green Building Standards 8 L/minute
2 Urinals Indonesia – Peraturan Menteri
Green Building Standards 4 L/flush
3 Toilets Indonesia – Peraturan Menteri
Green Building Standards 6 L/flush
4 Showers Indonesia – Peraturan Menteri
Green Building Standards 9 L/minute
5 Toilet Sprays USA – EPAct 6 L/minute
3.4.1 Influencing Factor for ESP Usage
ESP usage is affected from several factors. The factors that are suspected to affect the ESP usage is tested. Before testing the influencing factors, the factors are determined based on the questions that represent household.
3.4.2 Willingness to Change and Willingness to Pay
32
change from using ordinary sanitary to eco sanitary. The willingness to pay shows how much the increased price to afford eco-sanitary product to the customer/user.
3.5 Data Analysis
The data analysis and the interpretation consist of the discussion of the previous process, data processing and tabulation. In this discussion, it will explain supply-demand balance and the gap analysis.
3.5.1 Supply-Demand Analysis
The demand analysis discuss which factors that were the main driver for people using eco-sanitary product. The discussion also focuses on the supply side analysis. The supply analysis captures the retailer and distributors of the sanitary product. The supply-demand balance will analyze the balance between supply and demand in the current state and the future state, considering the forecasting method that is done using logistic binary regression.
3.5.2 Gap Analysis
The gap analysis discuss about the effect of the gap between supply and demand to the supply-demand actors. This discussion also analyze the possible reason of the unwanted gap between supply and demand and how to overcome the problem by applying new scenarios.
3.6 Conclusion and Suggestions
The last step of the research is the formulation of research conclusion. The conclusion of the research is formulated from the problem identification deployed at the early stage of the research. Beside the conclusion, the suggestion should be formulated as well. The suggestion not only addressing the current condition but also for the future condition in regrads to eco-sanitary products in Surabaya.
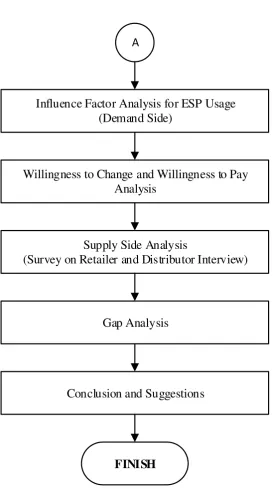
3.7 Research Methodology Flowchart
33
procedure for this research is explained. The first activity is problem identification and followed by preliminary literature study. The problem identification process is the very first activity in order to capture the main problem and determining the scope of the research. Meanwhile, the preliminary literature study is divided into two, which are literature review and direct observation. The literature review is conducted parallel with the direct observation in order to support each activities and be the baseline for the next activities.
35 Influence Factor Analysis for ESP Usage
(Demand Side)
Willingness to Change and Willingness to Pay Analysis
Supply Side Analysis
(Survey on Retailer and Distributor Interview)
Gap Analysis
Conclusion and Suggestions
FINISH
A
36
37
4
CHAPTER 4
DEMAND SIDE ANALYSIS
The user of eco-sanitary is dominated by household user. Therefore, survey was done from with household. Household consists of people in a family or other group that are living together in one house.
Demand side analysis captures the existing demand condition which means that the demand analysis captures the condition in household. The data are collected using survey and interviews to all districts in Surabaya. In subchapter 4.1 there will be explanation of the survey design and the determination of the sample size of household survey. The survey was done to gather information from the demand side. The demand side analysis includes the data of demographic profile, water usage, monthly water bill, awareness to water crisis, sanitary facility ownership, willingness to change and the main driver to change from the ordinary sanitary ware to eco-sanitary ware.
4.1 Household Survey
Since this research is included as exploratory research, there is no sufficient primary data provided in journals or other official reports. The data collection method for this research should be done using surveys to get the primary and secondary data. The survey purpose is to get the information related to the topic in the research. In order to conduct qualified survey, the the questionnaire should be designed before doing the survey. In this subchapter, there will be further explanation about the questionnaire design and the survey design.
4.1.1 Questionnaire Design
38
The other sections which belong to another research has close relation with water crisis problem.
The questionnaire is used to gather information needed in this research. The questionnaire consists of three pages. The whole questionnaire that is used for three researches. The questionnaire is provided in Appendix I.
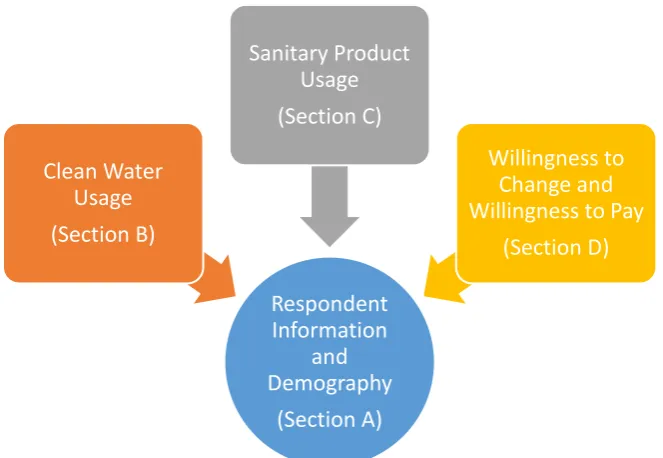
Questionnaire was used to obtain the primary data of this Supply and Demand Analysis research. The questionnaire was designed before conducting survey and consist five sections, which are:
Section A: Respondent Information and Demography Section B: Drinking Water and Clean Water Usage Section C: Sanitary Product Usage
Section D1: Willingness to Change Section D2: Willingness to Pay
The factors determination for the questionnaire is using references from the previous researches/journals/articles. The references used is recapitulated in Table 4.1.
Table 4.1 Questionnaire Factor Determination
No Journal/Report/Article Title Factors used in Questionnaire for WTC
1
The availability and accessibility of comprehensive overview of eco sanitary product in the market
Indonesian buildings permit requires the installation of eco-sanitary products
39
Only questions related to eco-sanitary product usage that will be used in the data calculation and data analysis.
Figure 4.1 Relationship between Section in Questionnaire
4.1.2 Survey Design
The survey design was done before the survey. The survey design includes determining number of sample size and the time needed to conduct the survey. The determination of the sample size is done to determine how many of the respondents should be put in the survey. The sample size is calculated using formula of sample size with proportion. The formula explanation is provided in subchapter 2.5. The survey was held to all household in Surabaya, which includes 31 district. The district included in this research are Tegalsari, Genteng, Bubutan, Simokerto, Pabean Cantian, Semampir, Krembangan, Kenjeran, Bulak, Tambaksari, Gubeng, Rungkut, Tenggilis Mejoyo, Gunung Anyar, Sukolilo, Mulyorejo, Sawahan, Wonokromo, Karang Pilang, Dukuh Pakis, Wiyung, Wonocolo, Gayungan, Jambangan, Tandes, Sukomanunggal, Asemrowo, Benowo, Pakal, Lakarsantri, and Sambikerep.
4 The sample size is calculated in order to determine the number of respondents should be listed in the survey. The total population of each district is
40
obtained from Dinas Kependudukan dan Pencatatan Sipil (Dispendukcapil) Surabaya. The population of each district is explained in the Table 4.1. The number of population are obtained from Dispendukcapil data report in year 2014. The total population includes Surabaya people from all ages.
5 In order to determine the total number of household, it is assumed that each household has five people.
𝑁𝑢𝑚𝑏𝑒𝑟 𝑜𝑓 𝐻𝑜𝑢𝑠𝑒ℎ𝑜𝑙𝑑 𝑖𝑛 𝑇𝑒𝑔𝑎𝑙𝑠𝑎𝑟𝑖 = 𝑇𝑜𝑡𝑎𝑙 𝑝𝑜𝑝𝑢𝑙𝑎𝑡𝑖𝑜𝑛 𝑖𝑛 𝑇𝑒𝑔𝑎𝑙𝑠𝑎𝑟𝑖5
𝑁𝑢𝑚𝑏𝑒𝑟 𝑜𝑓 𝐻𝑜𝑢𝑠𝑒ℎ𝑜𝑙𝑑 𝑖𝑛 𝑇𝑒𝑔𝑎𝑙𝑠𝑎𝑟𝑖 = 101,7165 = 20,343.2 ℎ𝑜𝑢𝑠𝑒ℎ𝑜𝑙𝑑𝑠
The calculation for the number of household is done for all district (district) in Surabaya. So, the total number of household in Surabaya is 570,732 households.
𝑛0 = 𝑍
2 𝑝 (1 − 𝑝)
𝑒2
Which:
Confidential Level = 95% (which means Z value is 1.96) e = 5%
Table 4.2 Sample Size Calculation for Survey Design for each District
41
Table 4.3 Sample Size Calculation for Survey Design for each District (cont.)
No. District Total
From the sample size calculation, the total number of respondents should be 384 to represent the Surabaya household. The total number of respondents is then multiplied by the household percentage in order to obtain the sample size for each district in Surabaya.
𝑆𝑎𝑚𝑝𝑙𝑒 𝑠𝑖𝑧𝑒 𝑓𝑜𝑟 𝑇𝑒𝑔𝑎𝑙𝑠𝑎𝑟𝑖 = 𝑡𝑜𝑡𝑎𝑙 𝑛𝑢𝑚𝑏𝑒𝑟 𝑜𝑓 𝑟𝑒𝑠𝑝𝑜𝑛𝑑𝑒𝑛𝑡𝑠 ∗ ℎ𝑜𝑢𝑠𝑒ℎ𝑜𝑙𝑑 𝑝𝑒𝑟𝑐𝑒𝑛𝑡𝑎𝑔𝑒 𝑆𝑎𝑚𝑝𝑙𝑒 𝑠𝑖𝑧𝑒 𝑓𝑜𝑟 𝑇𝑒𝑔𝑎𝑙𝑠𝑎𝑟𝑖 = 384 ∗ 3.56%
𝑆𝑎𝑚𝑝𝑙𝑒 𝑠𝑖𝑧𝑒 𝑓𝑜𝑟 𝑇𝑒𝑔𝑎𝑙𝑠𝑎𝑟𝑖 = 13.7 ℎ𝑜𝑢𝑠𝑒ℎ𝑜𝑙𝑑𝑠
42
4.2 Household Survey Result
In total, there are 440 respondents in the household survey. Overall, the number of surveyed respondents is bigger than designed sample size. The household survey result explains the current condition of the sanitary product usage, the characteristics of the user who install ESP, and the main driver to ESP usage. The questions used as the research primary data are included in Section A, B, C, D1 and D2. The questions and the result of the survey will be explained further in this subchapter. The data of the survey result is provided in Appendix III.
The survey method is using personal (one-by-one) interview to the repsondents. The survey was done in January 2017. It took one month to collect 440 respondents. The number of surveyed respondents is recapitulated in Table 4.2.
Table 4.4 Number of Surveyed Respondents
No. District Designed Sample Size Surveyed Respondents
43
Table 4.5 Number of Surveyed Respondents (cont.)
No. District Designed Sample Size Surveyed Respondents
17 Pakal 7 7
In this subchapter, the result of the household survey will be explained using descriptive interpretation through graph and charts. Before analyzing the data collected should be validated using validation test. The test was done in order to know the validation of the surveyed data. This validation test is compulsory to be done before the data tabulation process. The data validation test will be divided into two steps, which are the direct validation test and statistical validation test.
a. Direct Validation Test
44 b. Statistical Validation Test
Statistical validation test purpose is to determine the level of validity of instrument. The instrument is valid when it is able to measure the desired question or information (Agresti, 1990). The statistical validation test is using SPSS Software by using Pearson correlation test and looking at the r-value. The statistical validation test is to ensure that the data tabulated is reliable by checking the level of understanding of respondents to the question given in the questionnaire. The statistical validation test was done only on perception type of questions to ensure that the questions are well understood by the respondents.
The validation test was done using SPSS Software with bivariate correlation
between “Total Score” and question X13, X14 and WTC. Question in X13, X14 and WTC are the perception type of question. Those three questions were used in
the validation test. The “Total Score” is the total score of the questions (X13, X14
and WTC) from each respondents.
Ho: Respondents has different meaning in variable attribute (not valid)
Ha: Respondents has no different meaning in variable attribute (valid)
The r-table used in this validation test is 0,123 with df = 439. If the r-table
45 Table 4.6 Pearson Correlation Test Result
Correlations
ScoreTotal
Awareness to Water Crisis Pearson
Correlation .658**
Willingness to Change (WTC) Pearson
Correlation .699**
Sig. (2-tailed) .000
N 440
Table 4.4 shows the result from SPSS Software Pearson Correlation Test that were used to validate the data from questionnaire. The r-xy value is signed with yellow shading. The result to the Pearson Correlation Test is recapitulated in Table 4.5.
Table 4.7 Statistical Validation Test Result
No Tested Factor r-xy Conclusion
1 Awareness to water crisis (X13) 0.658 Valid
2 Eco-sanitary product knowledge (X14) 0.587 Valid
3 Willingness to change (WTC) 0.699 Valid
The value of r-xy factor-1 (Awareness to Water Crisis) is 0.658, which mean that reject Ho. The conclusion is that factor-1 (Awareness to Water Crisis) is valid. The overall result of the statistical validation shows that all the data gathered in the survey are valid. So, the respondents understood the type of question answered.
4.2.1 Descriptive Household Survey Result
46
5
Figure 4.3 Gender (A-1) and Religion (A-3) of Surveyed Respondents 6
7 The religion was obtained from question A-3. From the survey, there are 398 Moslem, 37 Christian, 8 Catholic, 4 Buddha and 4 Hindu. The data shows that there most of the respondents are dominated by Moslem religion.
8
Figure 4.4 Education Level (A-4) and Infant Availability (A-8) of Surveyed Respondents
9
The education and infant information is explained in Figure 4.5. There are 201 respondents that has SMA (Senior High School) as their last education, 73 respondents last educated in SMP (Junior High School), 72 respondents last educated in SD (Elementary School), 71 respondents graduated from college, and
47
24 respondents graduated from diploma school. There are also about 106 respondents that have infant (babies under 5 years) at home.
10
Figure 4.5 Occupation of Surveyed Respondents 11
The occupation of the respondents are mostly dominated by housewifes,
which is listed in “Other occupation..”. The housewife had the highest availability
to be surveyed because they stayed at home during the survey and the housewifes completely understand the installation nor the monthly spendings in their house. There are 129 respondents with occupation as Wiraswasta and 70 respondents as PNS/Karyawan Swasta/ABRI/Polisi. The number of students and professional surveyed are 33 and 2 respectively.
12
13
Figure 4.6 Amount of Family Member of Surveyed Respondents
48 14
15 The surveyed household were mostly consist of 3-4 family member. There are 90 respondents that has 3 family member and 115 respondents that has 4 people in one household. The average family member is 4.56 which is equal to 5 member in each family. This result is confirming the assumption made in this research to have 5 family member in each household. There is approximately 40% from the total surveyed household that has more than 5 family member.
16
17
Figure 4.7 House Ownership of Surveyed Respondents 18
19 About 88% of the respondents own their house. There are only small amount of respondents who life in rent house, family kost nor rumah dinas. The surveyed respondents mostly life in kampung neighborhood. There are 356 respondents that lifes in kampung neighborhood. There are about 16% of the surveyed household that lifes in real estate neighborhood.
49 21
Figure 4.8 Monthly Clean Water Consumption 22
The clean water consumption explained in Figure 4.9. The pie chart shows that most of the surveyed respondents uses 10-30 m3 a month. There are 44% household that consume 10-30 m3/month, 24% household that consume 30-50
m3/month, 20% househols that consume less than 10 m3/month and 12% household that consume more than 50 m3/month.
50
Figure 4.10 shows the monthly water bills of the total surveyed households. It could be concluded that the common payment amount is in range Rp 30.000 – Rp 50.000. Meanwhile, there are also people who do not uses PDAM as their main water source for clean water. The people who do not use PDAM is shown by the household that pays Rp 0, which is only 3% of the total surveyed household.
Many surveyed people do not understand the reason to have immediate act conserve clean water. In other hand, some of people already started to conserve water with purpose to reduce their water bill. This research emphasizes the level of awareness of the people to conserve clean water with the purpose to delay water crisis that might happen in the nearly future. The pie chart shown in Figure 4.10 shows that there are more than 50% of the people that already know the issue of water crisis that might happen in Surabaya 2018. To be exact, there are 64% of the people who already familiar and understand the issue. The other 36%, the people who are not familiar with the issue, were being informed by the surveyor when the survey occur.
Figure 4.10 Awareness to Water Crisis
The awareness of Surabaya people to water crisis could be increased by socialization through social media or seminar given by the government. The other way to face water crisis in Surabaya is by installation of water saving product. In this research, the tem of water saving product is eco-sanitary product (ESP).
64%
36% Yes, I am familiar with
the issue
51
Logically, the people who do not understand about ESP (benefit, cost, water saving or water consumption), do not install ESP in their home.
Figure 4.11 Eco-Sanitary Product Knowledge
Figure 4.12 shows the amount of household that understand the ESP and also the benefits and/or consequences of ESP installation. There are only 15% of the surveyed household that already understand about ESP.
The Willingness to Change (WTC) exist in the questionnaire section D1 question number 2. This subchapter is to explain how many of the household that already know the issue of water crisis and understand the ESP knowledge has willingness to change their current sanitary product into eco-sanitary product.
15%
85%
Yes, I know about ESP
52 Figure 4.12 Willingness to Change
From Figure 4.13, there are 50% of the surveyed household who has willingness to change to use ESP. Meanwhile, the rest 50% of the surveyed household do not have willingness to change to ESP.
4.2.2 ESP Usage Household Survey Result
In this research, the scope of sanitary product were focused on five product which are faucet, urinal, toilet, shower and toilet spray. The main consideration for the sanitary product determination is the information about water consumption and the water saving feature on each product. The eco standards for each sanitary product are described in the Table 4.6.
Table 4.8 Eco Standards in Sanitary Products for Water Saving Purpose
No Sanitary Products Standard Used Specification
1 Faucets Indonesia - Peraturan Menteri Green Building Standards 8 L/minute
2 Urinals Indonesia - Peraturan Menteri
Green Building Standards 4 L/flush
3 Toilets Indonesia - Peraturan Menteri
Green Building Standards 6 L/flush
4 Showers Indonesia - Peraturan Menteri Green Building Standards 9 L/minute
5 Toilet Sprays USA - EPAct 6 L/minute
50% 50%
53
The standards used are mostly from Peraturan Menteri about Standar Gedung Hijau (Green Building Standards). Since toilet spray eco standards do not stated in Peraturan Menteri, the eco standard was determined from USA with EPAct standard. This standards will be used as the determination of the current sanitary product used in households. When the installed sanitary product water consumption below the eco standards, the sanitary product owned by the household is considered as eco product.
Figure 4.13 Eco-Sanitary Classification Procedure
Since the questionnaire also record the eco feature claimed by the sanitary user, this information is also useful to classify the current sanitary product to eco product or not eco. The eco-sanitary classfication procedure is explained in flowchart in Figure 4.14.
54
only based on the water consumption but also on the user claim. The user claim
also become the determinator of “eco”.
Table 4.9 Amount of Eco-Sanitary User in Household
Faucet Urinal Toilet Shower Toilet Spray
Eco User 46 0 22 10 0
Total Sample Size 440 440 440 440 440
Eco User (%) 10.5% 0.0% 5.0% 2.3% 0.0%
From Table 4.7, there are no household that install eco-urinal and eco-toilet spray. Meanwhile, there are 10.5% of the total household that installed eco-faucet, 5% installed eco-toilet and 2.3% already installed eco-shower. It means that there are 10.5% from the total surveyed household that install faucet with flowrate below 8 liter/minute, there are 5% of the total respondents that install toilet with water consumption less than 6 liter/flush.
In Figure 4.15, the current market of eco-sanitary product explained through pie chart. The main objective of the current market is to give overview about the existing usage of eco-sanitary products. In Table 4.8, it is shown that there are only one household that install all eco product in their home.
Table 4.10 Current Market of Eco-Sanitary Product in Household
Amount
Eco
All Sanitary 1
Partial with WTC + 35
Partial with WTC - 24
Not Eco with WTC + 185
with WTC - 195