Malaysian
STATISTICS ON MEDICINE
2005
Edited by:
Sameerah S.A.R Sarojini S.
With contributions from
Goh A, Faridah A, Rosminah MD, Radzi H, Azuana R, Letchuman R,
Muruga V, Zanariah H, Oiyammal C, Sim KH, Fong AYY, Tamil Selvan M, Basariah N, Hooi LS, Zaki Morad, Fadilah O, Lim V.K.E., Tan KK, Biswal BM, Lim YS, Lim GCC, Mohammad Anwar H.A,
Ahmad Sabri O, Mary SC, Marzida M, Benjamin Chan TM, Suarn Singh, Zoriah A, Noor Ratna N , Abdul Razak M, Norzila Z, Shamsinah H
A publication of the
Malaysian
Statistics On Medicine
2005
2005
Edited by:
Sameerah S.A.R Sarojini S.
With contributions from
Goh A, Faridah A, Rosminah MD, Radzi H, Azuana R, Letchuman R,
Muruga V, Zanariah H, Oiyammal C, Sim KH, Fong AYY, Tamil Selvan M, Basariah N, Hooi LS, Zaki Morad, Fadilah O, Lim V.K.E., Tan KK, Biswal BM, Lim YS, Lim GCC, Mohammad Anwar H.A,
Ahmad Sabri O, Mary SC, Marzida M, Benjamin Chan TM, Suarn Singh, Zoriah A, Noor Ratna N , Abdul Razak M, Norzila Z, Shamsinah H
A publication of the
Malaysian Statistics On Medicine 2005
April 2007
© Ministry of Health Malaysia
Published by:
The National Medicines Use Survey Pharmaceutical Services Division Lot 36, Jalan Universiti
46350 Petaling Jaya Selangor, Malaysia
Tel. : (603) 4043 9300 Fax : (603) 4043 9400 e-mail : [email protected]
Web site : http://www.crc.gov.my/nmus
This report is copyrighted. However it may be freely reproduced without the permission of the National Medicines Use Survey. Acknowledgement would be appreciated. Suggested citation is Sameerah S.A.R, Sarojini S. (Eds). Malaysian Statistics on Medicine 2005. Kuala Lumpur 2007
This report is also published electronically on the website of The National Medicines Use Survey at:
http://www.crc.gov.my/nmus
Funding:
i
PREFACE
Ensuring access to quality and affordable medicines is one important objective of Malaysia’s National Medicines
Policy. The National Medicines Use Survey (NMUS) was conducted with the intent to continuously and
systematically collect data on medicines in the hope to further improve its use as well as providing a tool for
better decision making in the allocation of healthcare resources for the Malaysian population.
NMUS is into its third year and we are glad to announce the successful publication of its second report, the
Malaysian Statistics on Medicine (MSOM) 2005. It is worthwhile to note that the fi rst report MSOM2004
presented results largely from pilot surveys and using test methods basically to demonstrate that such a project
was feasible in a healthcare system such as Malaysia that has many players. In 2005, we have not only scaled
up the survey with larger sample size and wider distribution, but also refi ned data processing and statistical
methods. The statistical estimates in MSOM2005 are derived using highly elaborate data processing and complex
statistical methods as explained in the Methods section of this publication. Hence results in MSOM2005, in our
opinion are more reliable, more representative and more robust.
Three additional chapters namely Use of Drugs for Acid Related Disorders, Use of Systemic Corticosteroids and
Immunosuppressive Agents and Use of Opioid Analgesics were included in MSOM2005. We are optimistic that
more chapters will be reported in future publications of MSOM.
We hope that this MSOM2005 report will be useful to relevant healthcare professionals serving as a source of
reference and baseline for embark in future research or clinical audits towards improving rational prescribing.
We would like to thank all staff who had worked very hard in ensuring the success of the survey, all agencies and
institutions that had helped in providing data, all expert panel members for their enthusiasm and contributions in
completing the chapter reports and each and everyone who have in one way or another contributed to the success
of NMUS and this publication.
Pharmaceutical Services Division
Clinical Research Centre
iii
ACKNOWLEDGEMENTS
The National Medicines Use Survey would like to thank the following:
• All the medical doctors, pharmacists and pharmacy assistants who participated in NMUS surveys
• The Association of Private Hospitals Malaysia, Malaysian Organisation of Pharmaceutical Industries and Pharmaceutical Association of Malaysia for encouraging their members to contribute data to the NMUS
• Participating private hospitals for allowing access to their medicines procurement data
• Pharmaniaga Sdn Bhd for assistance in downloading MOH procurement data
• The National Pharmaceutical Control Bureau, Family Health Development Division, Procurement Division, all of the MOH, for their valuable assistance
• The Malaysian Royal Custom Service for permission to download pharmaceutical import data
• The Malaysian Medical Council, Malaysian Medical Association, The Academy of Family Physicians, Primary Care Doctors Association Malaysia, Malaysian Dental Association, Malaysian Private Dental Practitioner’s Association, Malaysian Pharmaceutical Society, University Malaya Medical Centre, Hospital University Kebangsaan and Hospital Universiti Sains Malaysia and Lumut Armed Forces Hospital for supporting this project AND
• All who have in one way or another supported and/or contributed to the success of the NMUS and this report
Mr. Lai Lim Swee Chairman
Dr Lim Teck Onn Co-Chairman
iv
ABOUT THE NATIONAL MEDICINES USE SURVEY
The National Medicines Survey (NMUS) is a service initiated and supported by the Ministry of Health (MOH) to collect information on the supply, procurement, prescription, dispensing and use of drugs in Malaysia. The NMUS is designed to support the implementation of our proposed National Medicines Policy (NMP).
The objectives of NMP are to ensure only safe, effi cacious and good quality medicines are available for use in Malaysia, as well as to promote equitable access to, rational and cost-effective use of these medicines, ultimately leading to improved health for all Malaysians. In supporting this, the NMUS provides the functional capacity for the collection, analysis, reporting and dissemination of data on drug utilisation in Malaysia
Sponsors and Governance of the NMUS
The NMUS is jointly sponsored by Pharmaceutical Services Division and the Clinical Research Centre, Ministry of Health Malaysia.
A Governance Board is established to oversee the operations of the NMUS. Governance via a Board is necessary to ensure that the NMUS meets the needs and expectations of all interested parties, and thereby to assure the continuing relevance and justifi cation of the NMUS. All major groups involved in pharmaceutical issues in Malaysia such as the MOH, Universities, professional bodies, private healthcare providers and the pharmaceutical industry are represented on this board. The board also works as a consultative forum and provide advice on issues pertaining to the NMUS and other aspects of the quality use of medicines.
Purpose of the NMUS
The availability of high quality, reliable and timely information on medicines use is crucial for any discussion on improving the use of medicines in Malaysia.
The objective of the NMUS is therefore to quantify the present state and time trends of medicines utilisation at various level of our health care system, whether national, regional, local or institutional.
Routinely compiled statistics on medicines utilisation have many uses, such as to:
1. Estimate the number of medicine users overall, by age, sex and geography and over time
2. Estimate on the basis of known disease epidemiology to what extent medicines are under or over-used. 3. Describe pattern of medicines use through assessing which alternative drugs are being used for particular
conditions and to what extent.
4. Relate the number of adverse drug reactions reported to our pharmacovigilance system to the number of people exposed to the drug in order to assess the magnitude of the problem, or to estimate the degree of under-reporting of adverse events
5. Provide a crude estimate of disease prevalence based on its prescription rate.
6. Estimate expenditure on pharmaceuticals, which constitutes a signifi cant proportion of our healthcare expenditure.
v
NMUS GOVERNANCE BOARD
CHAIRMAN: Mr Lai Lim Swee
CO- CHAIRMAN: Dr Lim Teck Onn
MEMBERS
Medical Services, MOH Dato’ Dr. Zaki Morad b. Mohd. Zaher
Pharmaceutical Services, MOH Mr Lai Lim Swee
National Pharmaceutical Control Bureau Ms Eishah bt Abd Rahman
Clinical Research Centre Dr Lim Teck Onn
Family Health and Development Division Ms Sahidah Said
Procurement Division Mr Abdullah Abdul Rahman
Malaysian Medical Council Prof Dr Raymond Ali
Malaysian Pharmaceutical Society Ms Usha Rajasingam
The Academy of Family Physicians of Malaysia Dr Mohd Husni B Jamal
Primary Care Doctors Organisation Malaysia Dr Molly Cheah
Malaysian Medical Association Dr M. Ponnusamy A/L Muthaya
Malaysian Dental Association Dr Shubon Sinha Roy
Malaysian Private Dental Practitioner’s Association Dr Haja Badrudeen
Association of Private Hospitals Malaysia Dr T. Mahadevan
Malaysian Organisation of Pharmaceutical Industries Mr Jimmy Piong
Pharmaceutical Association of Malaysia Mr Tom Hart
University Malaya Medical Centre Prof Liam Chong Kin
Hospital University Kebangsaan Malaysia Prof Dr Mohammad Abdul Razak
Hospital Universiti Sains Malaysia Dr Hj. Ramli Saad
vi
MEMBERS OF NMUS EXPERT PANELS
Expert Panel
1. Anti- Hypertensives, Steroid & Immunosuppressive, Renal Therapeutics
Members Institution
Dr Zaki Morad Mohd. Zaher (Chairperson) International Medical University
Dr Hooi Lai Seong Department of Nephrology, Sultanah Aminah Hospital,
Johor Bahru
Dr Lim Teck Onn CRC, Kuala Lumpur Hospital Datin Fadilah Othman Pharmacy, Selayang Hospital Ms Norkasihan Ibrahim Pharmacy, Selayang Hospital Ms Sahida bt Said Primary Health Care Division MOH Ms Siti Shahida Md. Shariffudin Pharmacy, Kuala Lumpur Hospital
2. Anti- Diabetics, Endocrine and Metabolic Therapeutics
Members Institution
Dr G. R. Letchuman Ramanathan (Chairperson) Medical Department, Taiping Hospital Dr Muruga Vadivale Sanofi Aventis
Dr Zanariah Hussein Medical Department, Putrajaya Hospital Dr Ariza Zakaria CRC, Kuala Lumpur Hospital
Dr Yap Piang Kian Subang Jaya Medical Centre Ms Oiyammal Chelliah Pharmacy, Penang Hospital
Ms Loh Kiaw Moi Xepa-Soul Pattinson
Prof Dr.S.P.Chan Faculty of Medicine, University Malaya Mr Mohd. Nazri Md Dazali Pharmacy KK Tampin
Mr Mohd. Dziehan Mustapa Pharmacy KK Teluk Panglima Garang Dr Badrulnizam Medical Department, Putrajaya Hospital
3. Anti-Lipidaemia and Cardiovascular Therapeutics
Members Institution
Prof Dr Sim Kui Hian (Chairperson) Dept of Cardiology, Sarawak General Hospital Dr Tamil Selvan Muthusamy Damansara Specialist Hospital
Dr. Alan Fong Yean Yip Dept of Cardiology, Sarawak General Hospital Dr David Quek Kwang Leng Dr Quek Specialist Heart Clinic
Ms Faridah Md. Yusof Pharmacy, Hospital UKM Ms Basariah Naina Pharmacy, Seremban Hospital Ms Rohaizan Mohd. Hanafi ah Pharmacy, Pulau Pinang Hospital Ms Nirmala Jagan Pharmacy, Kuala Lumpur Hospital Ms Yap Yih Jun Pharmacy, Kuala Lumpur Hospital
4. Antineoplastic, Oncology
Members Institution
Ms Lim Yeok Siew (Chairperson) Pharmacy, Kuala Lumpur Hospital
Dr Biswas Mohan Biswal Nuclear Medicine Radiotherapy & Oncology,
Hospital Universiti Sains Malaysia
Dr. Gerard Lim Chin Chye Dept of Radiotherapy & Oncology,
vii
MEMBERS OF NMUS EXPERT PANELS
Expert Panel
4. Antineoplastic, Oncology
Members Institution
Dr. D. Jayendran Dept of Oncology, Likas Hospital
Assoc. Prof Azizi Ayob International Islamic University, Kuantan
Dr. Chang Kian Meng Dept of Hematology, Ampang Hospital
Ms Yuzlina Muhamad Yunus Pharmacy, Kuala Lumpur Hospital
Ms Tajunisah bt. M. Eusoff Pharmacy, Penang Hospital
Ms Nik Nuradlina Nik Adnan Pharmacy, Kuala Lumpur Hospital
Mr Rizal Husaini Pharmacy, Kuala Lumpur Hospital
5. Antiinfectives
Members Institution
Prof Victor Lim (Chairperson) International Medical University
Dr Tan Kah Kee Dept of Paediatrics, Seremban Hospital
Dr. Hj. Rosemi Salleh Medical Dept, Raja Perempuan Zainab II Hospital,
Kota Bharu
Ms Sameerah S A Rahman Pharmaceutical Services Division MOH
Ms Rahela Ambaras Khan Pharmaceutical Services Division MOH
Ms Jacqueline Lai Pharmacy, Kuala Lumpur Hospital
Ms Thong Kah Shuen Pharmacy, Ipoh Hospital
Ms Haarathi a/p Chandriah Pharmacy, TAR Klang Hospital
Ms Masrahayu Moydin Pharmacy, Selayang Hospital
6. Musculo-skeletal Therapeutics
Members Institution
Dr Ahmad Sabri Omar (Chairperson) Orthopaedics Dept, Raja Perempuan Zainab II
Hospital, Kota Bharu
Dr Mohamad Anwar How Tai Ping Orthopaedics Dept, Raja Perempuan Zainab II
Hospital, Kota Bharu
Dr Ahmad Tajuddin b. Abdullah Orthopaedics Dept, Sultanah Nur Zahirah Hospital,
Kuala Terengganu.
Dr Fateh Mohd Klinik Fateh Mohd & Rakan-rakan
Ms Suhadah Ahad Pharmacy, Melaka Hospital
viii
MEMBERS OF NMUS EXPERT PANELS
Expert Panel
7. Analgesic and Anaesthetics
Members Institution
Dr Mary S.Cardosa (Chairperson) Dept of Anaesthesiology, Selayang Hospital
Assc. Prof. Dr. Mazidah Mansor University Malaya
8. Psychiatric Therapeutics
Members Institution
Dr Benjamin Chan Teck Ming (Chairperson) Permai Hospital, Johor Bahru
Dr Suarn Singh A/L Jasmit Singh Bahagia Hospital, Tanjong Rambutan
Dr Zoriah bt. Aziz Dept. of Pharmacy, University Malaya
Ms Noor Ratna bt. Naharuddin Pharmacy, Permai Hospital Johor Bahru
Ms Mariam Bintarty Rushdi Pharmacy, Kuala Lumpur Hospital
Mr Syed Fadzli bin Syed Sailuddin Pharmaceutical Services Division MOH
Ms Tengku Malini Tg.Mohd.Noor Izam Pharmacy, Kuala Lumpur Hospital
9. Respiratory Therapeutics
Members Institution
Dato’ Dr Abdul Razak Mutalib (Chairperson) Penang Hospital
Prof Dr Shamsinah Hussain Dept. of Pharmacy, University Malaya
Dr Norzila Zainuddin Paediatric Dept, Kuala Lumpur Hospital
Datin Dr Aziah Ahmad Mahayiddin Institute of Respiratory Medicine
Mr Abdol Malek Abd. Aziz Pharmacy, Melaka Hospital
Ms Joanne Liew Pharmacy, Institute of Respiratory Medicine
10. Gastrointestinal Therapeutics
Members Institution
Dr Muhammad Radzi b. Abu Hassan (Chairperson) Medical Dept. Alor Setar Hospital
Dr Ganesananthan Shanmuganathan Medical Dept., Kuala Lumpur Hospital
Ms Azuana Ramli Pharmacy, Serdang Hospital
Ms Zainon Abudin Pharmacy, Selayang Hospital
11. Pharmacoeconomics
Members Institution
Dr Faridah Aryani Md. Yusof (Chairperson) CRC, Kuala Lumpur Hospital
Mr Adrian Goh CRC, Kuala Lumpur Hospital
Ms Rosminah bt. Mohd. Din Pharmaceutical Services Division MOH
Dr Nour Hanah bt. Othman Pharmaceutical Services Division MOH
ix
NMUS STAFF
Project Leader Dr Sarojini Sivanandam
Clinical Research Manager Dr Lim Chiao Mei
Pharmacist Coordinator Ms Jami bt Ali
Clinical Research Coordinator Ms Lee Kim Tin
Pharmaco-Epidemiologist Ms Yuen Shalyn
Ms Sameerah binti Shaikh Abdul Rahman Ms Jami bt Ali
Dr Nour Hanah binti Othman Ms Rosminah binti Mohd. Din
Pharmaco-Economist Dr. Faridah Aryani Md. Yusof
Economist Mr Adrian Goh
Statistician Ms Jasmine Chew
Ms Raja’ah binti Meor Yahyauddin
IT Manager Ms Celine Tsai Pao Chien
Database Developer/ Administrator Ms Tang Roh Yu
Mr Patrick Lum See Kai Ms Lim Jie Ying
Mr Sebastian Thoo
Network Administrator Mr Kevin Ng Hong Heng Mr Adlan Ab Rahman
Desktop Publisher Ms Azizah Alimat
Webmaster Mr Patrick Lum See Kai
NMUS Project Staff
x
CONTENTS
PREFACE
...i
ACKNOWLEDGEMENTS
...iii
ABOUT THE NATIONAL MEDICINES USE SURVEY
...iv
NMUS GOVERNANCE BOARD
...v
MEMBERS OF NMUS EXPERT PANELS
...vi
NMUS STAFF
...ix
CONTENTS
...x
METHODS
...xi
ABBREVIATIONS
...xx
Chapter 1: Use of Medicines in Malaysia ... 1
Chapter 2: Expenditure on Medicines in Malaysia ... 5
Chapter 3: Use of Drugs for Acid Related Disorders ... 8
Chapter 4: Use of Antiobesity Medicines [Reserve] ... 11
Chapter 5: Use of Antidiabetics ... 12
Chapter 6: Use of Antianaemic Drugs [Reserve] ... .. 15
Chapter 7: Use of Antihaemorrhagic Drugs [Reserve] ... 15
Chapter 8: Use of Drugs for Cardiovascular Disorders ... 16
Chapter 9: Use of Antihypertensives ... 24
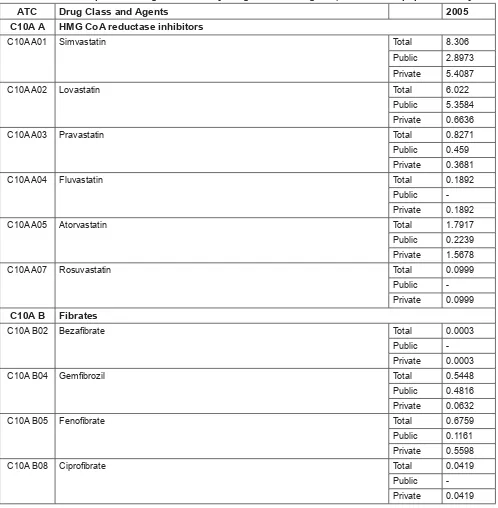
Chapter 10: Use of Lipid Lowering Medicines ... 31
Chapter 11: Use of Dermatologicals [Reserve] ... 34
Chapter 12: Use of Gynaecologicals, Sex Hormones and Hormonal Contraceptives [Reserve] ... 34
Chapter 13: Use of Urologicals [Reserve] ... 34
Chapter 14: Use of Drugs for Endocrine Disorders [Reserve] ... 34
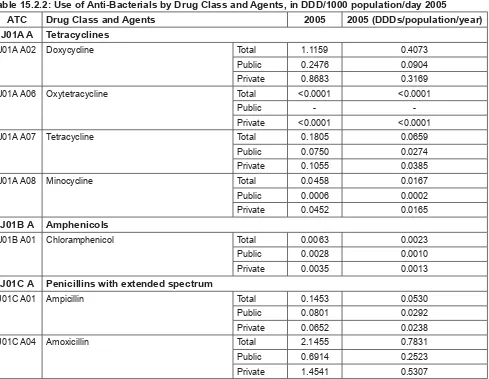
Chapter 15: Use of Antiinfectives ... 35
Chapter 16: Use of Antineoplastic Agents ... 47
Chapter 17: Use of Systemic Corticosteroids and Immunosuppressive Agents ... 54
Chapter 18: Use of Drugs for Rheumatological and Bone Disorders ... 59
Chapter 19: Use of Opioids Analgesics ... 64
Chapter 20: Use of Drugs for Neurological Disorders [Reserve] ... 66
Chapter 21: Use of Drugs for Psychiatric Disorders ... 67
Chapter 22: Use of Drugs for Obstructive Airway Diseases ... 74
Chapter 23: Use of Antihistamines & Nasal Decongesants [Reserve] ... 79
Chapter 24: Use of Ophthalmologicals [Reserve] ... 79
Chapter 25: Use of Otologicals [Reserve] ... 79
xi
METHODS
Authors:
Jasmine C, Tan WH, S. Chen, Tang RY, Lim JY, Lim CM, Faridah A, Lim TO
Introduction
The NMUS is designed, broadly speaking, to estimate the quantity and pattern of use of medicines in Malaysia, as well as to estimate our expenditure on pharmaceutical. This is an ambitious project, which requires multiple surveys at the various levels of the medicines supply and distribution chain in the country (Figure 1) in order to capture all the required data to meet its purpose. We had therefore realistically targeted data sources that are absolutely critical and accessible.
Hence, the statistics on medicines use and expenditure in this report are estimated based on data from only a limited number of surveys (though they were the critical ones) that could be successfully completed nation-wide. The scope was also deliberately limited to mostly prescription only medicines (obviously the pharmaceuticals of greatest interest), a few Over-the-Counter (OTC) medicines of interest were included, but it excluded traditional or herbal products and food supplements.
Figure 1: Medicines supply & distribution system and Sources of medicines data
Manufacturer/ Importer Distributor
Purchaser
Hospital Primary care/ GP Pharmacy
xii NMUS Surveys
The NMUS conducts several surveys in order to capture data at the various levels of the medicines supply and distribution system in the country. The sources of data, surveys to collect the data, data availability, and their use in this report are summarized in the table below.
# Data sources and Surveys Year data available Uses in present report
1. Medicines import or production data
1.1 Medicines import data from Royal Malaysian Custom 2004, 2005 Reference only 1.2 Local pharmaceutical manufacture Data not collected Not used 2. Domestic sales data
2.1 Domestic sales data from local pharmaceutical companies
Limited availability Reference only
3. Medicines procurement data
3.1 Public hospitals’ medicines procurement data from several sources:
a. MOH procurement through central tender 2001 to 2005 Used in estimates b. MOH individual hospitals’ local purchases 2001 to 2005 Used in estimates c. University and Armed forces hospitals’
procurement
2004, 2005 Used in estimates
3.2 Private hospitals procurement 2000 to 2005 Used in estimates 3.3 Private GPs procurement Limited availability Not used
3.4 Private specialist practice procurement Limited availability Reference only 3.5 Private pharmacies’ procurement Limited availability Reference only 4. Medicines prescription data
4.1 Public (MOH) primary care practice prescription Data not collected Not used
4.2 Private GP prescription 2005 Used in estimates
4.3 Private specialist practice prescription of highly specialized medicines
Limited availability Reference only
4.4 Hospital practice prescription Data not collected Not used 5. Medicines dispensing data
5.1 Public hospital pharmacy dispensing Data not collected Not used
5.2 Private free-standing retail pharmacy dispensing 2005 Used in estimates 6. Household medicines consumption data
6.1 Household survey on medicines consumption Data not collected Not used
Thus, the statistics presented in this report are derived from only a limited number of data sources. As shown above:
• Of the 6 theoretical data sources, NMUS primarily targeted data sources on medicines procurement and prescription.
• Collection of prescription data is limited to clinic practices, while hospital prescription is assumed to be included in hospital procurement data
• Many private medical specialists however may self-procure and dispense, rather than use hospital pharmacy dispensing service. Hence, separate procurement and prescription survey on highly specialized medicines are required, and are being piloted. Thus in so far that prescription of highly specialized medicines for a particular condition is concentrated in private ambulatory specialist practices (unlikely as most are probably prescribed in hospital setting), they will be under-estimated in this report
• Similarly, hospital dispensing data are assumed to be included in hospital procurement data, except of course for private freestanding pharmacies. Dispensing survey is therefore limited to this only.
• It is well known that consumers do access medicines through both formal as well as informal channels. Household survey will be required to obtain information on such use of medicine in the community.
xiii Survey population, sampling and response or coverage rate
The surveys conducted by NMUS, its survey population, its sampling unit and sample size, and the survey response or coverage rates are summarized in the table below.
# Surveys Survey population and sampling unit
Sample size Response Rate
1. MOH Pharmaceutical procurement
132 MOH hospitals APPL
LP
132 100
100% for APPL 75% for non-APPL 2. Private hospitals’ pharmaceutical
procurement
114 Private Hospitals 33 hospitals 29%
3. University and Armed Forces’ hospital pharmaceutical procurement
3 University hospitals 3 Armed Forces hospitals
2 University 1 Armed Forces hospital
67% for University 33% for Armed Forces
4. Private GP prescription 4459 in Malaysia 411 9%
5. Private pharmacy dispensing 466 55 12%
Data collection
The surveys conducted by NMUS collected the data either by: 1. Download from existing databases
2. Primary data collection
These are described below:
# Surveys Data download from existing databases
1. MOH Pharmaceutical procurement Pharmaniaga pharmaceutical procurement databases, central database as well as local individual hospitals’ databases. 2. Private hospitals’ pharmaceutical
procurement
Individual hospitals’ pharmaceutical procurement databases
3. University and Armed Forces’ hospital pharmaceutical procurement
Individual hospitals’ pharmaceutical procurement databases
# Surveys Primary data collection
4. Private GP prescription A sample of GPs collected prescription data in a randomly selected week. The sample being distributed over two half yearly cycle
5. Specialist practice prescription All dialysis facilities collected data on prescription of certain highly specialized medicines for all patients in their facility at the end of each year
xiv Data management
The collected data, whether in databases or in paper or electronic data collection form must be compiled into a single database, appropriately processed and coded prior to statistical analysis.
The NMUS database was created in Ms SQL Server 2000. The application has 3 modules: Contact Management, Data Entry and Data Processing.
• Contact Management module is used to collect the establishment survey details, log and track all the correspondence documents with SDP, and forecast, plan and schedule the conduct of the survey.
• Data Entry module is used to collect the data submitted by the SDP in paper form. It has been designed to collect data from GP prescription survey and pharmacy dispensing survey using paper CRF.
• Data Processing module is used to clean, manage and process the medical data prior to statistical analysis. The automated data processing functionalities include ATC coding, DDD Assignment, Total Dosage Calculation and Unit Conversion.
The database server is running on Windows 2000 Server. The server environment is Intel Xeon 2.4 Mhz, with a total of 2GB RAM memory and 67.8GP Raid5 Hard disk
The data processing steps are as follows:
# Data processing for downloaded database
1. Data were downloaded from the existing database of the following data sources • MOH APPL Procurement
• MOH Non-APPL Procurement • Private Hospital Procurement • University Hospital Procurement • Armed Forces Hospital Procurement • Chain Pharmacy Procurement • GP Prescription
The data downloaded are in fl at fi le format, e.g. TXT/ XLS and etc, or database fi les such as Access/ Oracle/ SQL and etc.
2. The structure of each of the downloaded database/ data fi le would be studied and analyzed to identify the required data fi elds/ variables.
The required variables are registration number, drug description, packaging description, supplier name, value procured, quantity procured, year procured and etc.
3. Next, the required fi elds/ variables would be extracted using SQL queries. The extracted data would then be normalized by separating into multiple, related tables in a single compiled database.
4. The data would then be linked to the respective SDP in the main contact table.
# Data processing for primary survey data 1. Data entry
Data is entered into the Data Entry module of the database.
Prior to data entry, data entry personnel are briefed on how to use the application and enter the data. Necessary precautions were given verbally for example to check each clinic by offi ce id and name, as they are clinics with many branches of the same name.
A demonstration was done on data entry during the briefi ng.
Personnel were supervised while doing the fi rst few entries to make sure they know how to do it correctly.
xv # Data processing for primary survey data 2. Edit checks
Survey forms are crosschecked against the database.
Selection of survey form is by data entry personnel, randomly by survey date. If number of drug entries of selected date is not suffi cient, more survey dates are included.
Items to check:
a. Number of patients are same in survey form and database
b. Number of drug entry/ drug prescribed is same in survey form and database. c. Age, sex of patient is entered correctly.
d. Drug particulars are entered correctly. 3. Calculations and Derived variables
• Dose per day is obtained by Dosage*frequency
• Dose per visit is obtained by Dosage*frequency* duration
4. Visual review and manual assessment of entries if they are misspellings.
# Common data processing steps 1. BPFK Registered Product List
An estimated 7000 poison products registered with NPCB were manually coded to ATC INN (Level 5). The coded NPCB drug list would serve as an internal drug dictionary for medicines data coding later. 2. Data Parsing by programming
The variables ‘Drug description’ and ‘Packaging Description’ in medicines (procurement/ prescription/ dispensing) data are parsed into smaller parts using specially written computer program. Parsing help facilitating auto coding process and dosage calculation later.
The variable ‘Drug description’ will be parsed into ‘Brand’, ‘INN’, ‘Dosage’, ‘Unit’ and ‘Route’ e.g. Zocor Tab 80 mg
Brand – Zocor Inn – none Dosage – 80 Unit- mg Route – Tab
The variable ‘Packaging Description’ will be parsed into ‘Big Unit’, ‘Small Unit’ and ‘Factor’ e.g. Pack of 10 tabs
Big Unit – Pack Small Unit – tabs Factor – 10 3. ATC Coding
• The parsed ‘Brand’ would then be linked to the coded BPFK drug list to obtain the ATC INN and DDD. However, if a certain brand has more than 1 DDD, the administration route has to be considered when assigning the DDD.
• On the other hand, the parsed ‘INN’ would be linked to the ATC Level 5 to obtain the INN and DDD. Similarly, if a certain INN has more than 1 DDD, the administration route has to be considered when assigning the DDD.
• Visual review and manual coding of residual medicines data to ATC; most of these residual data are due to incomplete or inconsistent data.
4. Drug Description Dosage and Unit
The Drug Description Dosage and Unit would be the parsed ‘Dosage’ and ‘Unit’ unless more than 1 dosage exists, e.g. 2MG/ML 100ML. This kind of data would require further processing.
xvi # Common data processing steps
5. Packaging Description Dosage
The packaging description dosage would be taking the parsed ‘Factor’ and calculated with reference to the ‘SKU’ or ‘UOM’.
The result of this step is the ‘Total Packaging Description Dosage’ Remaining residual has been handled manually
6. Total Dosage Calculation
Total Dosage = Total Drug Description Dosage * Total Packaging Description Dosage * Quantity procured
Total Dosage Unit = Total Drug Description Unit
Statistical report
This statistics on use of medicines in this report are presented using the Anatomical Therapeutic Chemical (ATC) classifi cation system, and the unit of measurement is expressed in defi ned daily dose (DDD). This is recommended by the WHO to be used for drug utilisation research and for purpose of comparisons of drug consumption statistics between countries, between regions or population groups within country and to evaluate trends in drug use over time.
Structure of the ATC Classifi cation system
In this system, medicines are divided into different groups according to the organ or system on which they act, and on their chemical, pharmacological and therapeutic properties.
Medicines are classifi ed in groups at 5 different levels as follows: Level Group and subgroups
1. Anatomical main group. There are 14 of these, eg C cardiovascular, M musculo-skeletal, R respiratory, etc
2. Therapeutic main group 3. Therapeutic subgroup
4. Chemical or Therapeutic subgroup 5. Drug chemical substance
An example should make this clear. Simvastatin is coded C10AA01. The structure of its code is as follows:
Level Code Group and subgroups
1. C Cardiovascular system
2. C10 Serum lipid reducing agents
3. C10A Cholesterol or triglyceride reducers
4. C10AA HMG CoA reductase inhibitors
5. C10AA01 Simvastatin
xvii Concept of the Defi ned Daily Dose (DDD)
The measurement unit for medicines use adopted in this report is the DDD.
The DDD is the assumed average maintenance dose per day for a drug used for its main indication in adults. The DDD is simply a technical measure of drug utilisation; it does not necessarily agree with the recommended or prescribed daily dose. Doses for individual patients and patient groups will often differ from the DDD. The DDD is often a compromise based on review of the available information about doses used in various countries. The DDD may even be a dose rarely prescribed because it is an average of two or more commonly used doses.
Medicines use statistics in this report are presented for most drugs as numbers of DDDs per 1000 inhabitants per day. Some interpretative notes as follows:
• The DDDs/1000 inhabitants/day provides a rough estimate of the proportion of population treated daily with certain drugs. For example, the fi gure 10 DDDs/1000 inhabitants/day indicates that 1% (10/1000) of the population on average might get a certain drug or group of drugs every day in the year.
• The DDDs/1000 inhabitants/day is most useful for drugs used in the treatment of chronic diseases and especially when there is a good agreement between the average prescribed daily dose and the DDD.
• For most drugs, their DDDs/1000 inhabitants/day are calculated for the total population including all age and sex groups. Where a drug use is limited to particular age or sex groups, then it will be more meaningful to express the fi gure for the relevant age-sex groups only. For example DDDs/1000 children age<12 /day, or DDDs/1000 women in reproductive age groups/day.
For anti-infectives (or other drugs normally used in short duration), the medicine use statistics are presented as DDD per inhabitant per year. This gives an estimate of the number of days for which each inhabitant is, on average, treated annually. For example, 5 DDDs/inhabitant/year indicates that the utilisation is equivalent to the treatment of every inhabitant with a 5-days course in the year.
In interpreting drug utilisation statistics expressed using DDD as in this report, readers are caution to bear in mind the following limitations:
• A medicine may have several indications while the DDD is based on the main indication in adults. • Medicines procured or prescribed or dispensed, as presented here, may not necessarily be consumed
• DDD may be diffi cult to assign or not assign at all for certain medicines, for examples medicines with multiple ingredients, topical products, anti-neoplastic drugs and anaesthetic agents.
• Medicines newly introduced into the market may yet have ATC and DDD assigned to it.
• The DDD assigned to a drug is primarily based on other countries’ experience and may not refl ect the commonly prescribed adult dose in Malaysia
Statistical methods
In this report, as explained above, the quantity of use of a medicine is expressed as, depending on the type of medicine, the number of DDDs per 1000 inhabitants per day or DDDs per inhabitants per year. These statistics are calculated as follows:
T*1000 DDDs/1000 inhabitants/day =
DDD* P*365
T DDDs/inhabitant/year =
DDD* P
Where
T is an estimate of the total quantity of the drug utilized in the year under consideration DDD is the DDD assigned for the drug according to the ATC/DDD system
xviii
In either case, an estimate of the total quantity of the drug being utilized in the year is required, and this must be expressed in the same unit as the DDD assigned for the drug.
The statistical estimation of the total utilisation varies depending on the survey method and the sampling design employed to collect the data, and if necessary with adjustment for incomplete data. These are described below.
# Surveys Estimation procedure 1. MOH Pharmaceutical
procurement
No sampling was employed in the survey.
The total is therefore simply estimated by the sum of all the quantities of the drug procured in all procurement records in the year.
Adjustment is made for the 92 hospitals with incomplete procurement records. 2. Private hospitals’
pharmaceutical procurement
Data were available for only a sample of hospitals. The total is estimated by T = Wi Ti
Where;
Ti is the value of the quantity of drug procured of the ith hospital in the year
Wi is the sampling weight of the ith hospital
Wi = (B/b) * (bi/ Ь)
Where B is total number of beds in the population, b is number of beds of the responding hospitals (sample), bi is number of beds in the ith hospital, and Ь the
mean number of beds in the population. 3. University and Armed
Forces’ hospital pharmaceutical procurement
Data were available for only a sample of hospitals. The total is estimated by T = Wi Ti
Where;
Wi is the sampling weight of the ith hospital adjusted for non-response and
incomplete procurement records
Ti is the value of the quantity of drug procured of the ith hospital in the year
4. Private GP prescription Data were collected only for a sample of GPs and for each respondent, data collected only for a sample of days in a year (working days only).
The total is estimated by T = Wi jTij Where;
Wij is the sampling weight for the ith day of the jth GP
Tij is the value of the quantity of drug prescribed by the jth GP on the ith day
5. Private specialist practice prescription (Nephrology and dialysis practices only)
No sampling was employed in the survey.
The total is therefore simply estimated by the sum of all the quantities of the drug prescribed for all patients dialyzing in the facility.
6. Private pharmacy dispensing
Data were collected only for a sample of pharmacies and for each respondent, data collected only for a sample of days in a year (working days only).
The total is estimated by T = Wi jTij Where;
Wij is the sampling weight for the ith day of the jth Pharmacy
Tij is the value of the quantity of drug dispensed by the jth Pharmacy on the ith
day
xix
The sampling weight for each sampling unit or unit of analysis has the following components: 1. Probability of selection.
The basic weight is obtained by multiplying the reciprocals of the probability of selection at each step of sampling design. Example, for GP prescription survey, this is GP practice and prescription day.
2. Adjustment for non-response.
The response rate was less than 100% for some surveys; an adjustment to the sampling weight is required. The non-response adjustment weight is a ratio with the number of units in the population as the numerator and the number of responding sampling units as the denominator. The adjustment reduces the bias in an estimate to the extent that non-responding units have same characteristics as responding units. Where this is unlikely, some adjustments took into account differences in some relevant characteristics between responding and non-responding units that may infl uence drug utilisation, such as bed strength, staff strength, scope of services for hospitals etc.
Finally, adjustments are also made to the statistical estimates to approximate known values from pharmaceutical import and sales data from companies, where these are available.
Expenditure estimation methodology Study Population
The MSOM encompasses private & public healthcare providers in Malaysia consisting of
1. The public health sector which consists of hospitals and primary care clinics of the Ministry of Health, University Hospitals under the Ministry of Higher Education and Military Hospitals under the Ministry of Defence.
2. The Private health sector consisting of private hospitals and general practitioners in Malaysia 3. Private sector retail pharmacies
Methodology
The expenditure on a particular drug in a given year is the quantity of drug used in that year multiplied by the price of the drug;
Total expenditure = Quantity of drug utilisation * Price of drug
Quantity of drug utilisation is determined from the drug utilisation data presented elsewhere in this report.
Similar to the treatment of drug utilisation elsewhere in this report, prices were determined for each drug chemical substance (5th level ATC classifi cation) and denominated in Daily Defi ned Doses (DDD) for the public and private
sectors taking into account the availability of price data and analytical considerations. Thus there are two prices (i.e. public sector and private sector price) for each drug chemical substance.
The prices generated for calculating were calculated by weighting prices against the quantities of DDDs. To normalise the effects of extreme values, only prices within the inter-quartile range were used in the weighting and price calculation process.
The process generating DDD weighted prices were conducted as follows. All procurement items for the ATC & sector were ordered by price per DDD and items beyond the IQR (i.e. lower than 25th percentile and higher than
75th percentile) were omitted from price calculation. Weights are then generated from the DDDs of the remaining
data where wi = DDDi / DDD. The weighted price then is pw = (pis * wis).
Expenditure for each procurement item is then calculated as Ei = pw * DDDi and the sum of all procurement items in the sector is the total expenditure on that drug chemical substance in the sector.
xx ABBREVIATIONS
ACEI Angiotensin Converting Enzyme Inhibitors AF Atrial Fibrillation
APPL Approved Product Price List
ARB Angiotensin II Antagonists/ Angiotensin Receptor Blocker ASR Age Standardized Rate
ATC Anatomical Therapeutic Chemical BCF Bias Correction Factor
BPFK Biro Pengawalan Farmaseutikal Kebangsaan CCB Calcium Channel Blockers
CCF Congestive Cardiac Failure
COAD Chronic Obstructive Airway Disease CPG Clinical Practice Guidelines
CTZ Chlorothiazide
DALYs Disability Life Years DDD Defi ned Daily Dose Dept Department
FDA Food And Drug Administration GERD Gastroesophageal Refl ux Disease GP General Practitioner
HCTZ Hydrochlorothiazide HDL High Density Lipoprotein
HMG CoA 3-hydroxy-3-methylglutaryl coenzyme A H2RA H2 Receptor Antagonist
ICU Intensive Care Unit
INN International Nonproprietary Name
ISAAC International Study of Asthma and Allergies in Childhood
KL Kuala Lumpur
LDL Low Density Lipoprotein LMWH Low Molecular Weight Heparin MOH Ministry of Health
NCC National Cancer Centre NCI National Cancer Institute NMP National Medicines Policy NMUS National Medicines Use Survey
NPCB National Pharmaceutical Control Bureau NSAIDs Non Steroidal Anti- Infl ammatory Drugs OTC Over-the-Counter
PCDOM Primary Care Doctors Organisation Malaysia PPI Proton Pump Inhibitors
RE Refl ux Esophagitis SDP Source Data Producer
SERM Selective Estrogen Receptor Modulator SKU Stock Keeping Unit
SSRI Serotonin Selective Reuptake Inhibitor UOM Unit of Measurement
CHAPTER 1
USE OF MEDICINES IN MALAYSIA Malaysian Statistics on Medicine 2005
1 Edited by:
T.O. Lim1, Sarojini S1, C.M. Lim1, Sameerah S.A.R2, L.S. Lai2,
1. Clinical Research Centre MOH, 2. Pharmaceutical Services Division MOH
In this chapter, we report the national estimates of the use of medicines. It describes the most commonly used medicines by therapeutic groups and by specifi c drugs. Certain medicines however were deliberately excluded in this chapter for various reasons as follows:
1. Most OTC medicines, health supplements and traditional complementary medicines are outside the scope of the NMUS
2. Medicines without DDD assignment such as anti-neoplastic drugs, anaesthetic agents
3. Predominantly topical medicines (Dermatologicals, Ophthalmologicals, Otologicals, Gynaecologicals, Nasal and Throat preparations, Stomologicals)
The most commonly used medicines in 2005 in Malaysia were anti-diabetic medications (3.6% of the population was on this), of which Glibenclamide (1.3% of population) and Metformin (1.2% of population) were the most commonly used drugs.
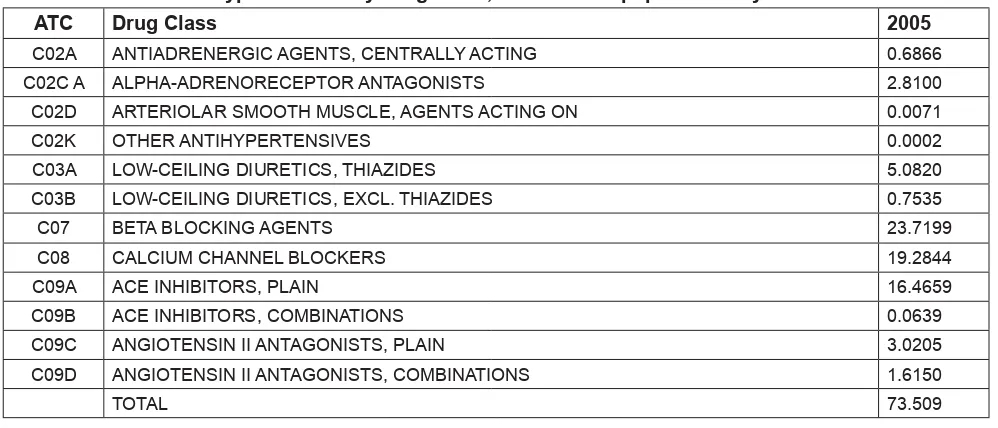
The various anti-hypertensive medications also fi gured very high on the top 30 list; beta-blockers were second (2.4% of population on this), followed by agents acting on the renin-angiotensin system (third on list, 2.1%), calcium channel blockers (fourth on list, 1.9%), and diuretics (seventh on list, 1.2%; though this include high ceiling diuretics not used for hypertension). Collectively, these anti-hypertensive medicines were more commonly used than anti-diabetics. Hypertension and Diabetes mellitus are the two most prevalent chronic disorders in the country (in 1996, prevalence of hypertension was 33% [1] and Diabetes mellitus 8% [2]); thus in the light of known disease epidemiology, such high medicines utilisation rates for these conditions are to be expected. Indeed one may question whether they were suffi ciently high to ensure all in need of therapy were on treatment and properly controlled. From general practice prescription data, we estimated a patient with hypertension was prescribed a median of only one (1) anti-hypertensive medication. That is, the vast majority of patients (81%) were on mono-therapy, which is hardly suffi cient to achieve treatment target [3]. Clearly then, given the prevalence of hypertension, many patients were not on drug treatment at all, and of those treated, their drug treatment are likely to be inadequate, consistent with survey showing only 6% of Malaysian patients with hypertension on drug treatment did achieve blood pressure control [1].
This utilisation pattern is in sharp contrast to Australia (the only country in the region with available medicine use statistics [4]), where lipid reducers (top) and anti-asthmatics (second on list) dominated its top-10 drug list in year 2000. The latter only ranked sixth on the Malaysian top-10 list, which is to be expected considering the difference in asthma prevalence between the 2 countries [5], while the relatively lower use of lipid reducers (only 1.9% of population compared with 7% or higher in Australia) defi nitely suggests under-utilisation of lipid reducers, even if past survey had shown lower prevalence of hypercholesterolaemias in Malaysia [6]. Another interesting contrast is simvastatin (sixth on our list) and lovastatin (tenth on our list) are commonly used here, while atorvastatin topped the Australian list (atorvastatin is twenty-ninth on the Malaysian list), clearly indicating preference for low-priced generics in Malaysian practice, in the absence of public reimbursement unlike in Australia.
A surprisingly highly used medicine is anti-histamines for systemic use (1.1% of population), mostly chlorpheniramine and loratadine, which deserve further investigation.
Anti-bacterial medicines not surprisingly were widely used; Amoxicillin was the most popular item in the group. Similarly, anti-rheumatic medicines were also commonly used (1.2% of population).
Malaysian Statistics on Medicine 2005
CHAPTER 1 USE OF MEDICINES IN MALAYSIA
2
Certain perhaps surprising levels of medicine utilisation observed (in terms of % of population on), whether expectedly or unexpectedly high or low, were:
• Drugs for acid related disorders such as peptic ulcers -0.5% • Systemic corticosteroids -0.5%
• Psycholeptics -0.5%
• Thyroid therapy 0.4% (mostly accounted by Carbimazole- 0.3%) • Anti-epileptics - 0.16%
• Anti-gout medicines - 0.18%
For the disorders for which these medicines are indicated, little is known about their epidemiology and treatment in this country to aid interpretation of these medicines use statistics. They deserve further investigation. Refer to individual chapters for further discussion on some of these specifi c therapeutic groups.
Table 1.1: Top 30 Therapeutic groups by Utilisation in DDD/1000 population/day 2005
# ATC Therapeutic group Public Private Total
CHAPTER 1
USE OF MEDICINES IN MALAYSIA Malaysian Statistics on Medicine 2005
3
Table 1.2: Top 40 Drugs by Utilisation in DDD/1000 population/day 2005
# ATC Drugs Public Private Total
1. A10B B01 Glibenclamide 10.9231 1.9997 12.9228 2. A10B A02 Metformin 9.1975 2.7895 11.9870 3. C07A B02 Metoprolol 10.6187 1.0397 11.6584 4. C08C A05 Nifedipine 9.5203 1.0908 10.6112 5. C07A B03 Atenolol 6.4350 3.9213 10.3563 6. C10A A01 Simvastatin 2.8973 5.4087 8.3060 7. C09A A04 Perindopril 6.0259 1.0429 7.0689 8. C08C A01 Amlodipine 3.9237 2.6909 6.6146 9. B01A C06 Acetylsalicylic acid 3.7934 2.4324 6.2258 10. C10A A02 Lovastatin 5.3584 0.6636 6.0220 11. A10B B09 Gliclazide 3.4366 1.8662 5.3028 12. C03C A01 Furosemide 3.3789 1.3548 4.7337 13. C09A A02 Enalapril 3.1080 1.1079 4.2159 14. C09A A01 Captopril 3.5133 0.3598 3.8731 15. C03A A04 Chlorothiazide 3.7072 0.0359 3.7431 16. M01A B05 Diclofenac 1.4783 2.2399 3.7183 17. R03A C02 Salbutamol 3.4157 0.2726 3.6883 18. R06A B04 Chlorphenamine 2.7969 0.3991 3.1960 19. H03B B01 Carbimazole 0.5594 2.5261 3.0855 20. M01A G01 Mefenamic acid 1.3606 1.7135 3.0741 21. R03B A02 Budesonide 1.1585 1.7650 2.9235 22. H02A B06 Prednisolone 1.0848 1.5624 2.6472 23. C02C A01 Prazosin 2.2932 0.1050 2.3982 24. A10A D01 Insulin (human), intermediate-acting combined
with fast acting
Malaysian Statistics on Medicine 2005
CHAPTER 1 USE OF MEDICINES IN MALAYSIA
4 References
1. Lim TO, Zaki M, Maimunah AH, Rozita H, Ding LM. Prevalence, awareness, treatment and control of Hypertension in Malaysian adult population. Singapore Medical Journal 2004; 45:20-27
2. Lim TO, Ding LM, Zaki M, Suleiman AB et al. Distribution of blood glucose in a national sample of Malaysian adults. Med J Malaysia 2000; 55:65-77
3. Hansson L, et al. Effects of intensive blood pressure; lowering and low dose aspirin in patients with hypertension: principal results of the Hypertension Optimal Treatment (HOT) randomized trial. Lancet 1998; 31:1755-62 4. Australian Statistics on Medicine 1999-2000.Commonwealth Department of health and ageing Australia
2003
5. International Study of Asthma and Allergies in Childhood (ISAAC) Steering Committee. Worldwide variations in the prevalence of asthma symptoms: the International Study of Asthma and Allergies in Childhood (ISAAC) Eur Respir J. 1998; 12:315-35
CHAPTER 2
EXPENDITURE ON MEDICINES IN MALAYSIA Malaysian Statistics on Medicine 2005
5 Edited by:
A. Goh 1, Rosminah MD2, Faridah A1, Noor Hanah O2, Noor Aini Z1
With contributions from: Nour Hanah Othman3, Chua KL5
1. Clinical Research Centre MOH, 2. Pharmaceutical Services Division MOH
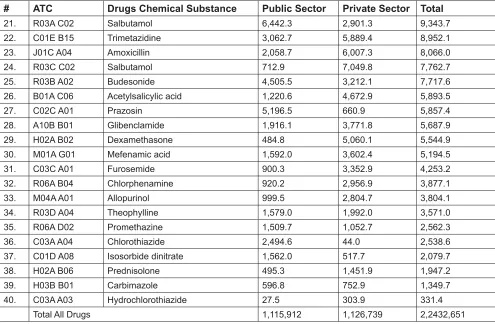
Total drug expenditure in Malaysia was estimated to be RM 2.24 billion in 2005 with expenditure equally divided between the public and private sectors at RM1.12 billion and RM1.13 billion respectively. Expenditure for the top 40 drugs used in Malaysia is estimated at RM652.1 million which accounted for 29.1% of total medicines expenditure.
Among the top 40 drugs utilised, the highest expenditure was for amlodipine (RM69.8 million) followed by simvastatin (RM67.2 million), diclofenac, omeprazole and insulin (Table 2.1). Analysis of the top 40 utilised medicines at the therapeutic group level showed that expenditure was concentrated towards hypertensive medicines (C07, C08, C09) which accounted for RM215.9 million, followed by lipid modifying agents (C10) at RM108.5 million and diabetic medicines (A10) at RM91.5 million. Together they accounted for 63.8% of the expenditure on top 40 utilised medicines and for 18.5% of all prescribed medicines expenditure for the year (Table 2.2).
When compared against the rankings of community prescribed medicines expenditure in Australia, lipid-modifying agents were the highest ranked expenditure items in both countries (Table 2.3). Interestingly for hypertensive medicines, Australian expenditures appear to have largely shifted from beta blocking agents (C07) and calcium channel blockers (C08) to agents acting on the renin-angiotensin system (C09) class of medicines while all three types appear to be still widely used in Malaysia.
Table 2.1: Estimated expenditure on the Top 40 Utilised Drugs, 2005 (RM ‘000)
# ATC Drugs Chemical Substance Public Sector Private Sector Total
Malaysian Statistics on Medicine 2005
CHAPTER 2 EXPENDITURE ON MEDICINES IN MALAYSIA
6
Table 2.1: Estimated expenditure on the Top 40 Utilised Drugs, 2005 (RM ‘000)
# ATC Drugs Chemical Substance Public Sector Private Sector Total
21. R03A C02 Salbutamol 6,442.3 2,901.3 9,343.7 22. C01E B15 Trimetazidine 3,062.7 5,889.4 8,952.1 23. J01C A04 Amoxicillin 2,058.7 6,007.3 8,066.0 24. R03C C02 Salbutamol 712.9 7,049.8 7,762.7 25. R03B A02 Budesonide 4,505.5 3,212.1 7,717.6 26. B01A C06 Acetylsalicylic acid 1,220.6 4,672.9 5,893.5 27. C02C A01 Prazosin 5,196.5 660.9 5,857.4 28. A10B B01 Glibenclamide 1,916.1 3,771.8 5,687.9 29. H02A B02 Dexamethasone 484.8 5,060.1 5,544.9 30. M01A G01 Mefenamic acid 1,592.0 3,602.4 5,194.5 31. C03C A01 Furosemide 900.3 3,352.9 4,253.2 32. R06A B04 Chlorphenamine 920.2 2,956.9 3,877.1 33. M04A A01 Allopurinol 999.5 2,804.7 3,804.1 34. R03D A04 Theophylline 1,579.0 1,992.0 3,571.0 35. R06A D02 Promethazine 1,509.7 1,052.7 2,562.3 36. C03A A04 Chlorothiazide 2,494.6 44.0 2,538.6 37. C01D A08 Isosorbide dinitrate 1,562.0 517.7 2,079.7 38. H02A B06 Prednisolone 495.3 1,451.9 1,947.2 39. H03B B01 Carbimazole 596.8 752.9 1,349.7 40. C03A A03 Hydrochlorothiazide 27.5 303.9 331.4
Total All Drugs 1,115,912 1,126,739 2,2432,651
Table 2.2: Distribution of Expenditure by Therapeutic Group, 2005
# ATC Therapeutic Group Public Sector Private Sector Total
CHAPTER 2
EXPENDITURE ON MEDICINES IN MALAYSIA Malaysian Statistics on Medicine 2005
7
Table 2.3: Ranking of Expenditure on Top 10 Therapeutic Groups
ATC Therapeutic Group Malaysia (2005) Australia (2004/5)
C10 Lipid modifying agents 1 1 A10 Drugs used in diabetes 2 7 C08 Calcium channel blockers 3 11 C09 Agents acting on the renin-angiotensin system 4 3 M01 Antiinfl ammatory and antirheumatic products 5 8 A02 Drugs for acid related disorders 6 2 C07 Beta blocking agents 7 >15 R06 Antihistamines for systemic use 8 >15 B01 Antithrombotic agents 9 10 R03 Drugs for obstructive airway diseases 10 5 Note: Australian ranking refers to costs for community prescribing
References:
1. Malaysia Pharmaceuticals & Healthcare Report Q4 2006, Business Monitor International Ltd
CHAPTER 3
USE OF DRUGS FOR ACID RELATED DISORDERS Malaysian Statistics on Medicine 2005
8 Edited by:
Radzi H1, Shanmuganathan G2, Zainon A3, Azuana R4
1. Alor Star Hospital, 2. Kuala Lumpur Hospital, 3. Selayang Hospital, 4. Serdang Hospital
The common acid related disorders include Gastroesophageal Refl ux Disease (GERD), Peptic Ulcer Disease and Non Ulcer Dyspepsia. Prevalence rate of Refl ux Esophagitis (RE) in Malaysia has been estimated at 13.4% [1]. In Western Countries such as the UK and the USA the prevalence of monthly heartburn had been estimated to be about 29–44% [2]. In Singapore and Hong Kong, the monthly prevalence rates of heart burn and/or acid regurgitation had been reported to be below 10% of their population [2]. GERD is currently the commonest among acid related disorders with increasing trends both locally and globally.
From our study, the drug utilisation for acid related disorders is at 5.16 DDD/1000 population/ day. This indicates that 0.5% of the population on average used this group of drugs every day in the year 2005. In comparison with other countries, the usage is comparatively small. For example in 2003, the consumption of drugs for acid related disorder in the Nordic countries ranged from 18.3DDD/1000inhabitants/day in Greenland to 56.5DDD/1000 inhabitants/day in Iceland [3], which evidently far exceeded our fi gures. Utilisation data of antacid and alginates were not available in this study, thus leading to the apparent lower quoted rate for this class of drugs.
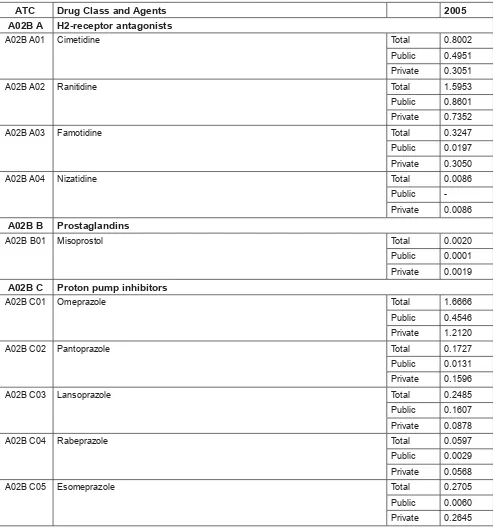
In proportion to other classes of drugs, utilisation of drugs for acid related disorders is relatively small. This could be explained by the fact that acid related disorders currently have a lower prevalence in our population and merely requires treatment of a short duration. Among the 4 different classes of drugs, H2 Receptor Antagonist (H2RA) tops the list with usage of 2.7 DDD/ 1000 population/day in 2005, followed very closely by Proton Pump Inhibitors (PPI) at (2.4). This pattern is somewhat dissimilar to other countries where PPIs are more commonly used as compared to H2RA. For example, in Denmark the usage of PPI is four times higher (23.4) compared to usage of H2RA (6). H2RA constituted 52.9% of all drugs used for acid related disorders, and ranitidine (58.5%) is the most popular, followed by cimetidine (29.3%), famotidine (11.9%) and nizatidine (0.3%). In private practice, famotidine (0.3) is used as frequently to cimetidine (0.30).
PPI constituted (46.8%) by drug class with the breakdown of omeprazole (68.9%), esomeprazole (11.2%), lansoprazole (10.3%), pantoprazole (7.1%) and rabeprazole (2.5%). The utilisation of H2RA is similar between the public (50.2%) compared to private sector (49.8%). However the consumption of PPI is higher in the private sector (73.6%) compared to the public sector (26.4%).
In 2005, omeprazole was the only PPI in generic formulation available in Malaysia. The utilisation of omeprazole exceeded that of ranitidine and this pattern of usage is driven by the private sector. Consumption of other drugs for acid related disorders namely misoprostol and carbenoxolone was almost negligible.
The current prescribing practice restrictions, availability and cost considerations may explain this pattern of usage reported in this study. In the public sector the usage of PPIs are limited to specialists whilst H2RA are readily available in most primary clinics and health care centers. In developed countries, there is an apparent consensus among physicians on using PPIs as fi rst line treatment for GERD as it is more potent, effective and possess good safety profi le [4]. We foresee that the usage of PPIs will soon supersede H2RA following the trend in the western population. Based on the changing trend of prevalence locally and globally, we anticipate that the overall utilisation trend of acid related disorders would further increase in the future.
The data for antacid and alginates, an important class of drugs for acid related disorders, which are widely used as fi rst line treatment and self-medication in Malaysia, was not included in this report. This may have skewed the
CHAPTER 3
Malaysian Statistics on Medicine 2005 USE OF DRUGS FOR ACID RELATED DISORDERS
9
Table 3.1: Use of Medicines for Acid Related Disorders by Drug Class, in DDD/1000 population/day 2005 ATC Drug Class 2005
A02B A H2-receptor antagonists 2.7288 A02B B Prostaglandins 0.0020 A02B C Proton pump inhibitors 2.4180 A02B X Other drugs for peptic ulcer and gastro-oesophageal refl ux disease (GORD) 0.0131
Table 3.2: Use of Medicines for Acid Related Disorders by Drug Class and Agents, in DDD/1000 population/ day 2005
ATC Drug Class and Agents 2005 A02B A H2-receptor antagonists
A02B A01 Cimetidine Total 0.8002 Public 0.4951 Private 0.3051 A02B A02 Ranitidine Total 1.5953 Public 0.8601 Private 0.7352 A02B A03 Famotidine Total 0.3247 Public 0.0197 Private 0.3050 A02B A04 Nizatidine Total 0.0086
Public -Private 0.0086
A02B B Prostaglandins
A02B B01 Misoprostol Total 0.0020 Public 0.0001 Private 0.0019
A02B C Proton pump inhibitors
CHAPTER 3
USE OF DRUG FOR ACID RELATED DISORDERS Malaysian Statistics on Medicine 2005
10
ATC Drug Class and Agents 2005 A02B X Other drugs for peptic ulcer and gastro-oesophageal refl ux disease (GORD)
A02B X01 Carbenoxolone Total 0.0131 Public -Private 0.0131
References:
1. KL Goh. Changing epidemiology of gastroesophageal refl ux disease in the Asian–Pacifi c region: An overview. Journal of Gastroenterology and Hepatology (2004) 19, S22–S25.
2. Khek Yu Ho, Ting Kin Cheung and Benjamin Cy Wong. Review on Gastroesophageal refl ux disease in Asian countries: Disorder of nature or nurture?
3. Medicines Consumption in the Nordic Countries 1999-2003. © Nordic Medico Statistical Committee 2004. 4. Irvin Modlin. GERD 2004: Issues from the past and a consensus for the future. Best Practice & Research
11
CHAPTER 5
USE OF ANTIDIABETICS Malaysian Statistics on Medicine 2005
12 Edited by:
G.R Letchumanan R1, Muruga V2, Zanariah H3, Oiyammal C4, P.K. Yap5, Ariza Z6
With contributions from:
S.P. Chan7, Nazri D8, Dziehan M9, K.M. Low10, Badrulnizam3
1. Taiping Hospital 2. Sanofi Aventis 3. Putrajaya Hospital 4. Penang Hospital 5. Subang Jaya Medical Centre 6. Clinical Research Centre, MOH 7. Faculty of Medicine, University Malaya 8. Tampin Health Clinic 9. Teluk Panglima Garang Health Clinic 10. Xepa-Soul Pattinson
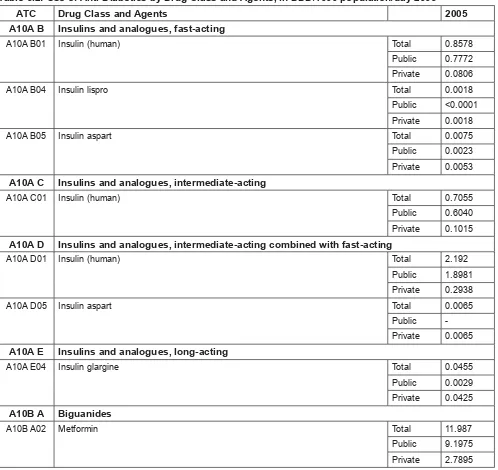
The total use of antidiabetic drugs in 2005 in Malaysia was 35.9DDD/1000 population/day. The most utilised class of drugs was the sulphonylurea group, followed by the biguanides and insulins that is the intermediate acting combined with fast acting insulin, fast acting, intermediate-acting and long acting respectively. Total antidiabetic drugs dispensed in Malaysia in 2005 (35.9DDD/1000 population/day) were slightly lower to that in Australia 2005 (37.6DDD/1000 population/day).
The amount of insulins dispensed in relation to the annual total antidiabetic drug utilisation in 2005 was low (10.64%). This was contrary to what was expected. The insulin consumption is expected to increase as more Type 2 diabetics are started on insulin and more Type 1 diabetics are diagnosed. In contrast, Australia in 2005 had an insulin utilisation of 35.68% [1]. This result portrayed a less aggressive approach in prescribing insulin among Malaysian physicians compared to our Australian counterparts. The pattern of prescribing insulin, however, was consistent to that in Australia with the most preferred type of insulin being the combined intermediate/fast acting insulin, followed by fast-acting, intermediate-acting and lastly long-acting insulin. Preference for the intermediate/fast acting insulin was much higher among the Malaysians (57.6%) compared to the Australians (42.27%). Public usage was far greater than that in private sector refl ective of the burden of patients seen and managed by the public sector. It is likely that the elderly, those who require insulin, tend to seek treatment from the public sector because of economic reasons. It cannot be denied that the private sector may be less aggressive in initiating insulin therapy because of patient perception and acceptance. The greater use of combination of intermediate/fast acting insulin was not in line with the current guidelines. There should be more emphasis on the use of long acting insulin in combination with oral anti-diabetics or basal-bolus insulin regimes.
For Oral Hypoglycaemic Agents (OHA), sulphonylureas (19.2DDD/1000 population/day) were the most common antidiabetic drugs dispensed in Malaysia in 2005, followed by metformin (11.99DDD/1000 population/day). The amount of metformin utilised in Malaysia (2005) was comparable to that in Australia (11.62DDD/1000 population/day) in 2005. This was in contrast to current guidelines, which clearly recommends metformin as
fi rst line therapy and refl ects a need to emphasise on the use of guidelines in clinical practice by prescribers. Chlorpropamide was still being used in Malaysia compared to Australia where its use was negligible. The use of chlorpropamide should be discouraged because of its tendency to cause severe and prolonged hypoglycaemia. Based on the MSOM data 2005, there appeared to be a preference to prescribe glibenclamide rather than the newer second-generation sulphonylureas and could indicate cost factor particularly in the public setting.
Malaysian Statistics on Medicine 2005
CHAPTER 5 USE OF ANTIDIABETICS
13
Table 5.1: Use of Anti-Diabetics by Drug Class, in DDD/1000 population/day 2005 ATC Drug Class 2005
A10A INSULINS AND ANALOGUES 3.8166 A10B A Biguanides 11.987 A10B B Sulfonamides, urea derivatives 19.218 A10B D Combinations of oral blood glucose lowering drugs 0.0407 A10B F Alpha glucosidase inhibitors 0.4977 A10B G Thiazolidinediones 0.2127 A10B X Other oral blood glucose lowering drugs 0.0829
Table 5.2: Use of Anti-Diabetics by Drug Class and Agents, in DDD/1000 population/day 2005 ATC Drug Class and Agents 2005 A10A B Insulins and analogues, fast-acting
A10A B01 Insulin (human) Total 0.8578 Public 0.7772 Private 0.0806 A10A B04 Insulin lispro Total 0.0018 Public <0.0001 Private 0.0018 A10A B05 Insulin aspart Total 0.0075 Public 0.0023 Private 0.0053
A10A C Insulins and analogues, intermediate-acting
A10A C01 Insulin (human) Total 0.7055 Public 0.6040 Private 0.1015
A10A D Insulins and analogues, intermediate-acting combined with fast-acting
A10A D01 Insulin (human) Total 2.192 Public 1.8981 Private 0.2938 A10A D05 Insulin aspart Total 0.0065
Public -Private 0.0065
A10A E Insulins and analogues, long-acting
A10A E04 Insulin glargine Total 0.0455 Public 0.0029 Private 0.0425
A10B A Biguanides
CHAPTER 5
USE OF ANTIDIABETICS Malaysian Statistics on Medicine 2005
14
ATC Drug Class and Agents 2005 A10B B Sulfonamides, urea derivatives
A10B B01 Glibenclamide Total 12.9228 Public 10.9231 Private 1.9997 A10B B02 Chlorpropamide Total 0.0517 Public 0.0137 Private 0.0379 A10B B07 Glipizide Total 0.1944 Public 0.0315 Private 0.1629 A10B B09 Gliclazide Total 5.3028 Public 3.4366 Private 1.8662 A10B B12 Glimepiride Total 0.7463 Public 0.022 Private 0.7244
A10B D Combinations of oral blood glucose lowering drugs
A10B D03 Metformin and rosiglitazone Total 0.0407 Public - Private 0.0407
A10B F Alpha glucosidase inhibitors
A10B F01 Acarbose Total 0.4977 Public 0.3547 Private 0.1431
A10B G Thiazolidinediones
A10B G02 Rosiglitazone Total 0.2127 Public 0.0164 Private 0.1962
A10B X Other oral blood glucose lowering drugs
A10B X02 Repaglinide Total 0.0693 Public 0.0183 Private 0.0510 A10B X03 Nateglinide Total 0.0136
Public -Private 0.0136
References:
1. Australian ATC-DDD data for year 2005 is as below: http://www.health.gov.au/internet/wcms/publishing.nsf/ Content/health-pbs-general-pubs-asm.htm
15
CHAPTER 6: USE OF ANTIANAEMIC DRUGS (RESERVE)