Understanding managerial preferences in selecting equipment
Gary Stading
a,∗, Benito Flores
b,1, David Olson
b,2aDepartment of Industrial Distribution, Texas A&M University, College Station, TX 77843-3367, USA bDepartment of Information and Operations Management, Texas A&M University, College Station, TX 77843-4217, USA
Received 13 September 1999; accepted 11 April 2000
Abstract
Industry continues to look for methods of gaining competitive advantage through manufacturing techniques. These tech-niques, however, can be matched by competitors if used without the guidance of a strategic framework. Similarly, structural capacity choices can be matched by competitors without the infrastructural benefits of a well defined operations strategy. In this study, multiattribute utility (MAU) theory analysis was used in an experiment to quantify the contribution of various struc-tural and infrastrucstruc-tural strategic factors toward sustaining competitive advantage within the context of a capital equipment selection decision. The experimental respondents were manufacturing managers and professionals from the plastics industry. This research provides groundwork for understanding the role of strategic infrastructural factors in sustaining competitive advantage within the structural capacity decision of selecting capital equipment in the plastics industry. © 2001 Elsevier Science B.V. All rights reserved.
Keywords:Capacity management; Empirical research; Measurement and methodology; Operations strategy; Multiattribute utility analysis
1. Introduction
An equipment purchasing decision impacts the ca-pacity levels of a business (Persson, 1991). Oversized equipment selections can be costly in multiple ways including the initial outlay of cash and the subsequent result of having too much capacity (generating exces-sive inventories, idle equipment, etc.). Alternatively, undersizing equipment can result in greater penal-ties if lack of capacity constrains meeting customer demands (Markland et al., 1998). Equipment selec-tion also has broader implicaselec-tions. For instance, the
∗Corresponding author. Tel.:
+1-979-845-4976.
E-mail addresses: [email protected] (G. Stading), [email protected] (B. Flores), [email protected] (D. Olson).
1Tel.:+1-409-845-4248. 2Tel.:+1-409-845-2254.
strategy adopted in selecting equipment can affect the flexibility of switching between products or ramping up products (Skinner, 1996).
Hayes (1985) argued that strategic infrastructural factors are the key to achieving competitive advan-tage. Skinner (1996) argued more specifically that strategic infrastructural factors in a capacity decision are an important source of competitive advantage. Capital investments have been viewed as strategic decisions (Lindberg et al., 1988; Persson, 1991). Capital equipment decisions based on engineering cost–benefit analysis considering productivity factors have deep roots in the industrial community (Sage, 1983; Newnan, 1991). However, if, as is hypothe-sized by Skinner (1996), the strategic considerations of these capacity decisions do represent sources of competitive advantage, then the acquisition of capital equipment provides an opportunity to gain sustainable competitive advantage.
This paper details an experiment which measures the effect of various structural and infrastructural fac-tors in a capital equipment selection decision. The capital equipment decision is made under experimen-tal hypothetical conditions. The objective for this sce-nario is to use the purchase of equipment to gain a sustainable competitive advantage. The subjects were asked to select and purchase production equipment, which would help them meet the competitive priori-ties facing their assigned business.
The experiment is designed to evaluate how man-agers value structural and infrastructural factors in selecting equipment configurations to meet their as-signed competitive priorities. The competitive priori-ties are unique to each treatment of this experiment, and the experiment limits the subjects’ choices in equipment selection to four alternatives. The equip-ment choices are all of equal capacity. The subjects have the choice of purchasing one large machine, two medium large machines, four medium small machines or eight small machines to meet the demands of the hypothetical task presented to them. The equipment options are equal on all other attributes and priorities not considered as tradeoffs in the study. The subjects are all practicing managers or professionals in the polymer processing industry. The experiment is de-signed to capture their expertise at competing in this marketplace.
2. Background
A manufacturing strategy is defined by the total pattern of management decisions made across the manufacturing system not just in relation to the cap-ital expenditures of ‘brick and mortar’, but it also includes systems and policies which define the in-frastructure of a business (Clark, 1996). Therefore, a manufacturing firm’s strategy will guide the de-cisions on each of the priorities in which the firm chooses to compete. In addition, some (Hayes and Wheelwright, 1984; Skinner, 1996) have argued that attaining sustainable competitive advantage cannot be achieved without including infrastructural con-siderations in such decisions as equipment selection choices.
Skinner has proposed the use of manufacturing strategy to gain sustainable competitive advantage
since 1969 (Skinner, 1969). Others continue to study this problem (e.g. Leong et al., 1990; Mills et al., 1995). The industrial community looks for methods of gaining competitive advantage through manufacturing techniques like just-in-time or quality improvement programs (De Meyer et al., 1989). Skinner (1996) has recently warned against the pitfalls of using these techniques (referred to collectively as advanced man-ufacturing techniques or AMTs) without using an operations and/or business strategy as a guiding vehi-cle. Skinner points out that using competitive priori-ties does not necessarily mean a strategic framework is used. Some researchers (Ferdows and De Meyer, 1990) have offered ideas about how to use AMTs in strategic initiatives. Without a strategic framework, any competitive advantage that may be obtained ulti-mately can be lost.
Skinner (1996) recommends a framework of strate-gic design considerations. He lists six areas of stratestrate-gic design: (1) vertical integration, (2) level of capacity, (3) equipment and process choice, (4) facility num-bers, location, and sizes, (5) infrastructure decisions, and (6) management techniques. These six areas overlap Hayes and Wheelwright’s (Hayes and Wheel-wright, 1984) eight decision areas of manufacturing strategy. Hayes and Wheelwright’s list is as follows: capacity, facility, technology, vertical integration, workforce, quality, production planning, and organi-zation. Skinner (1996) lists 35 AMTs, so as a matter of perspective, if a company chooses to compete on any one or two, like JIT, TQM, or re-engineering, then that company is limiting itself within Skinner’s strategic framework. Of the six strategic design cat-egories, Skinner (1996) states that capacity levels and equipment/process choices are probably two of the most understudied areas in this field. Tracey et al. (1999) argue that investing in advanced manu-facturing technology and facilitating manumanu-facturing managers in strategy formulation improve competitive capability.
compet-itive priorities are consistent with the dimensions that qualify a firm to be a supplier for a customer, or an ‘order qualifier’, and subsequently to be cho-sen as the supplier of choice by a customer, or an ‘order winner’ (Hill, 1989). These strategic compet-itive priorities are used to establish the basis of this experiment.
This study specifically examines infrastructural and structural factors to ascertain their contribution to-wards attaining sustained competitive advantage under various competitive scenarios. While many individual factors of both types influence an equipment selection decision, 10 are selected for investigation based on literature precedent and the results of a pilot study. Five factors are included under the general heading of structural factors and five are included under the general heading of infrastructural factors. The five engineering cost–benefit or structural factors are pro-ductivity, reduced processing time, initial investment, operating cost, and automation potential (Tarquin and Blank, 1976; Fine and Hax, 1985; Lefley, 1996). The five infrastructural factors include operator knowledge and learning, setups, professional/engineering skills, teamwork, and managerial skills (Fine and Hax, 1985; Hayes et al., 1988; Mata et al., 1995; Upton, 1995).
3. The decision
In as early as 1975, Wild (1975) proposed an equip-ment selection procedure which involved breaking the decision into quantifiable and non-quantifiable factors. Quantifiable costs included traditional equipment cost justification considerations like the price of the capital equipment purchase, setup costs, space requirements, and inventory requirements. Wild (1975) considered non-quantifiable cost factors to include such factors as human resource staffing, working conditions and au-tomation integration. Since then others (Sage, 1983; Ancel and Griffiths, 1996; Lefley, 1996) continue to support the position of including infrastructural fac-tors in the equipment purchase decision.
While engineering cost justification equipment analysis has evolved somewhat to include infrastruc-tural considerations, traditional cost engineering pri-orities remain technically oriented (Newnan, 1991). It is not that practitioners buy equipment in a random fashion without accounting for the strategies of their
companies. Instead, manufacturers in many cases subscribe to traditional thinking that equipment needs to be purchased through cost justification procedures (Noaker, 1994). Traditional cost justification methods include accounting rate of return methods (e.g. re-turn on investment), discounted cash flows, or simple payback methods. These methods are based on nar-rowly focused traditional cost justification methods which remain universally applied through improved productivity targets regardless of operating strategies (Noaker, 1994). Despite a calling for expanding crite-ria in justifying equipment to include strategic aspects of their companies, practicing managers continue to justify equipment through cost justification packages (Noaker, 1994).
Using equipment purchase alternatives as choices in managerial decision models is not without precedent. Kalotay (1973) used the choice of machine types as a model for capacity expansion under various demand patterns. Karmarkar and Kekre (1987) used machine size and number options to study product mix and capacity decisions. Van der Veen and Jordan (1989) used the machine purchase alternatives to examine trade-offs between machine investment and utiliza-tion decisions. In each of these cases, equipment alternatives were systematically used to examine effects of economically sensitive managerial operating decisions.
4. Experimental methodology
differences in the value of factors influenced by a manufacturing strategic decision can be explored.
MAU models have a specific advantage in this case because of the difficulty of using non-traditional or non-cost related measures of value for justifications in purchasing capital equipment. A field experiment of operations managers using hypothetical scenario ana-lysis can provide an opportunity to explore strategic considerations in the equipment decision because of their expertise and knowledge of this particular mar-ketplace (the polymer processing industry). Measuring the experts’ evaluation of the utility of these infras-tructural factors is an important advantage of MAU analysis (Keeney and Raiffa, 1976). In general, a field experiment defines factors which may not be included in a mathematical model, and it measures changes caused by effects which a survey does not usually di-rectly capture. Both, determining the important fac-tors and measuring the effect of the facfac-tors, contribute towards understanding the value of attaining compe-titive advantage at least specific to this decision.
Multiattribute utility theory and the model of this research follow Olson (1996) where the framework of the theory follows the linear weighting rule model of Keeney and Raiffa (1976).
v(xj)=
X
wi(xj)
wherewi is the relative weight of criterioniandxj is
the scaled value alternative jhas on criterioni. Both the weight and the scaled value alternative were pre-sented to the respondents on 0–10 scales to enhance respondent understanding. These numbers were scaled back to 0–1 scales by dividing responses by 10 facil-itating identification with MAU methodology (Olson, 1996). The scaled response scoring sheets are attached in Appendices A and B.
The method of research is a designed experiment using multiattribute utility analysis. A designed exper-iment typically involves subjecting samples to sepa-rate levels of treatments then measuring the intended effect. The effect, in this research, is achieving sus-tained competitive advantage. Sussus-tained competitive advantage can be thought of as sustaining greater than industry average profitability (Hitt et al., 1995). Fu-ture research can extend this investigation to beyond the subset of Skinner (1996) six areas being con-sidered in this research (capacity, equipment choice,
and infrastructure). The controlled experiment in this research focuses on perceived importance of these specific factors on equipment choice utilizing MAU analysis.
4.1. The pilot
Many possible experimental scenarios involving strategic competitive priorities, alternatives, and at-tributes are identified in the literature. Vickery (1991), for example, summarized the strategic competitive priorities to include cost, product/process innovation, quality, delivery performance, flexibility (mix and volume), and rapid new product development. Van der Veen and Jordan (1989) examined the effect of the investment decision on utilization when making machine sizing decisions. Lefley (1996) argued that a number of both traditional cost–benefit measures and infrastructural attributes should be considered important in this decision. Therefore, an experimental design in this area could be prohibitively large and potentially confounding.
A pilot study was used to identify a filtered list of alternatives, attributes, scenarios, and questions used in this study. The pilot study and the experiment are not intended to be conclusively final in identifying strategic priorities in the equipment decision, but rather these were intended to provide a starting point for the investigation. The pilot subjects were col-leagues, friends in the plastics industry, and mentors whose opinions were respected for various points of expertise and honest feedback. The testing forms and definitions were allowed to adjust, change, and evolve because the main concern of the pilot study was to achieve clarity, efficiency, and solidify working defi-nitions that were representative of both industry and academia. A sampling of the working definitions of market strategy, product development strategy, and customer services strategy are included in Appendix A. An example of the attribute definition anchors are included in Appendix B.
sce-narios. Instead, alternative combinations could lead to new discoveries on this experimental horizon.
4.2. The experiment
The experiment uses MAU theory to gain insight into subject expertise. The process is as follows. The subjects, who are managers from one selected industry (the plastic processing industry), were each assigned to one of the eight treatments. The treatments were built from aspects of manufacturing competitive priorities (Vickery, 1991), aspects of Porter’s cost leadership and product differentiation determinants (Porter, 1985) and aspects of Hill’s order winning criteria (Hill, 1989). The subjects were given four alternatives of machine choice from which to select.
Of the alternatives presented to the subjects, none by design offered a clear competitive advantage over the other on any of the given dimensions. For example as described in the appendices, the alternatives consisted of one large machine, two medium large machines, four medium small machines, or eight small machines all directly scaleable (e.g. one 400 t machine, two 200 t machines, four 100 t machines, or eight 50 t machines). The manager (subject) was left to achieve competi-tive advantage by strategically using the alternacompeti-tive to best meet the experimental scenario. For example, one large machine is faster and more productive than one 50 t machine, but it is not faster and more productive than eight 50 t machines working together. Therefore, given a scenario of making several products, would it be strategically better to make several products one at a time on a big fast machine (incurring set ups, inven-tory build up, etc.) or would it be better to dedicate lines to certain products on smaller machines (lower-ing productivity, etc.)? Residual questions managers had to consider in view of their priorities included for instance what would be the strategic implications in terms of quality, deliverability, flexibility, etc. given their alternatives and which of the alternatives would best meet their given priorities?
The subjects were asked to select an alternative that provided them with, in their expert opinion, the equip-ment choice most likely to sustain competitive advan-tage. In doing this, they were asked to provide both their preferences for factors (engineering cost–benefit factors and infrastructural factors) and weights of im-portance which they assigned to the factors in
mak-ing their capacity selections. MAU analysis techniques were used to aggregate the factor weights and prefer-ential value of the factors toward achieving sustained competitive advantage (Olson, 1996). The aggregated results of the factor weights going into the capacity choices and the capacity level selections were com-pared between treatments to understand differences in choices between treatments in achieving competitive advantage.
Three factors, each having two levels (a 2×2×2 design), were under consideration in this experiment. The factor levels of the experiment are also referred to as the competitive priorities because when a subject was placed in a treatment, he was presented with a description of the respective hypothetical competitive scenario. The subjects were told that in their hypo-thetical manufacturing scenario the executive to which they report has dictated that they are competing on three primary priorities, all of equal weighting. These three competitive priorities (of two levels each) are the three factors of the experiment.
The three competitive priorities represent differen-tiation strategies within a manufacturing operation. The first factor is referred to as a market differenti-ation strategy. Under this strategy, the firm may be competing by being a lower cost producer, or the firm may be competing with product differentiation. While many other marketing strategies exist, the ex-periment was controlled by presenting these limited extremes.
The second factor is referred to as a new prod-uct development strategy. Under this priority, the firm may have a rapid new product development priority or a product continuous improvement priority. The new product development priority forces a manufacturing operation to allocate production time to develop prod-ucts quickly. The description for this strategy includes a statement that profit is made by a market introduc-tion that is quicker than the competiintroduc-tion. After the introduction, competition quickly matches the prod-uct at which time above average profit margins are lost. The task of the continuous improvement prior-ity is to continually improve the qualprior-ity of an existing product.
schedules are set. Changes to the production schedule are not allowed, and promised dates are important. The second customer service priority is flexibility. If flexibility is the priority, then quick changeovers are emphasized and reacting to customer changes is the important consideration.
In summary, the three competitive priorities or factors in this experiment are as follows: a market differentiation priority, a new product development priority, and a customer service priority. Each factor has two priorities. The two priorities of the mar-ket differentiation priority are low cost and product uniqueness. The two priorities of the new product de-velopment priority are rapid new product dede-velopment and continuous product improvement. The two prior-ities of customer service are delivery reliability and flexibility.
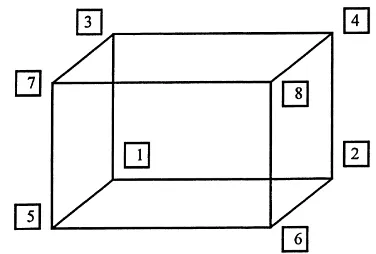
The treatments represent a combination of the pri-orities of all three factors (Lentner and Bishop, 1993). In a 2×2×2 design, eight total treatments are designed in the complete combination of factor priorities. The respondents are given a scenario in which the com-bination of levels represents the competitive priori-ties of that treatment. The combinations of prioripriori-ties along with anx-,y- andz-axis three-dimensional cod-ing scheme are presented in Table 1.
If the codes are plotted on a three-dimensional graph, the axes of the graph can be labeled with each of the associated priorities. The resulting configura-tion of the design can be thought of as a cube. Each corner of the cube represents a treatment. Fig. 1 is a diagram of the configuration of the combined levels of the designed experiment.
Each corner point in Fig. 1 represents a treatment. Every subject participating in the study was placed in one of the treatments. Any treatment can be referred
Table 1
Coding scheme of the designed experiment
Treatment x-axis y-axis z-axis Priority description
1 −1 −1 −1 Competes on cost, product development, and flexibility priorities
2 +1 −1 −1 Competes on unique product, product development, and flexibility priorities 3 −1 +1 −1 Competes on cost, quality, and flexibility priorities
4 +1 +1 −1 Competes on unique product, quality, and flexibility priorities 5 −1 −1 +1 Competes on cost, product development, and delivery reliability
6 +1 −1 +1 Competes on unique product, product development, and delivery reliability 7 −1 +1 +1 Competes on cost, quality, and delivery reliability priorities
8 +1 +1 +1 Competes on unique product, quality, and delivery reliability priorities Fig. 1. Configuration of the treatments of the designed experiment.
to through its number or its coding scheme. For in-stance treatment 6 is also treatment (+1,−1,+1) on the (x-, y-, z-axis) coding scheme. This means that any person participating in the study assigned to treat-ment 6 is given the hypothetical manufacturing sce-nario having the competitive priorities of maintaining unique products in the marketplace, developing new products rapidly, and meeting promised delivery dates. The treatments, in this way, represent combining the factor levels (Table 1).
5. The hypotheses
Hypothesis 1. The choice of one large machine is not affected by different manufacturing priorities used by managers attempting to gain competitive advantage.
Hypothesis 2. The choice of two medium large machines is not affected by different manufactur-ing priorities used by managers attemptmanufactur-ing to gain competitive advantage.
Hypothesis 3. The choice of four medium small machines is not affected by different manufactur-ing priorities used by managers attemptmanufactur-ing to gain competitive advantage.
Hypothesis 4. The choice of eight small machines is not affected by different manufacturing priorities used by managers attempting to gain competitive advantage.
The experiment tests each hypothesis by consider-ing how managerial preferences change under differ-ent scenarios (treatmdiffer-ents of the designed experimdiffer-ent) of manufacturing competitive priority. All the sub-jects are instructed to use the equipment decision to gain sustainable competitive advantage, so by chang-ing the scenario of manufacturchang-ing priority, the factors can be evaluated for degree of change. These responses are tested for significance between alternatives. For each of the hypotheses, the responses from the MAU analysis will be used to reject, or fail to reject, the hypotheses.
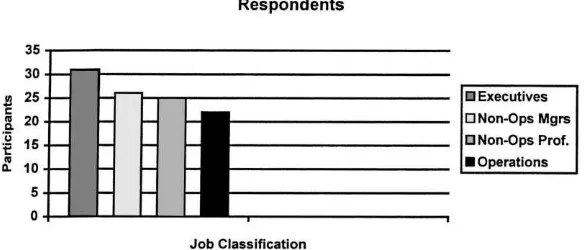
Fig. 2. Backgrounds of the participants.
6. A profile of the respondents
The data was collected by the recruitment of man-agers and professionals to participate in the study. The managers and professionals all were from plas-tics and allied industries. The subjects were recruited at five separate industry conferences. Since 104 sub-jects participated, the experiment was able to carry 13 sets of subjects in each treatment. The experiment was controlled for balance by placing a subject in all eight treatments prior to proceeding to the next set of subjects.
The participants were from a variety of functional positions. The participants were all required to have a professional or managerial position, and they had to have had some degree of experience in the op-erations area. The profile of the participants is in Fig. 2.
reported directly to the operations function others reported through a technical function. The manager and professional categories had 26 managers (25% of the participants) and 25 professionals (24% of the participants), respectively. The last designation for participants included anyone with direct functional re-sponsibility in the operations area. The people quali-fying for this designation were plant managers, op-erations managers, and process or production related engineers. A total of 22 of these professionals or ap-proximately 21% of these subjects participated in the study.
The respondents came from different companies. This was a requirement of the experiment in maintain-ing independence between subjects. Therefore, just as there were 104 different subjects, there were also 104 different companies. The companies ranged in size from small companies to large multi-national compa-nies. Some of the recognizable names of the com-panies of some of the participants included Amoco, Chevron, DeWalt, Union Camp, Dupont, Eastman, Av-ery, 3M, NCR, Bridgestone, Olin, Bayer, Dow, Rohm and Haas, and Borg-Warner.
In summary, the respondents were from a variety of functional, managerial, and professional respon-sibilities in the plastics industry. The respondents were from a variety of geographical locations. The respondents were from five different professional business conferences that target different audiences in the industry. Each of these points helped to as-sure a diversification of the responses, and should therefore, minimize data bias from geographical, cul-tural, or corporate influences. Independence of the data is improved by preventing subjects from the same company from participating. If subjects from the same company had participated, the influence of a company’s business beliefs and practices may con-tribute bias to the responses. By limiting participation to one respondent per company, company influences are minimized. A generalization of the results to the industry as a whole, therefore, is improved through the diversification of the respondents.
7. Results
Each of the subjects gave responses to questions un-der the different scenarios that were presented to them.
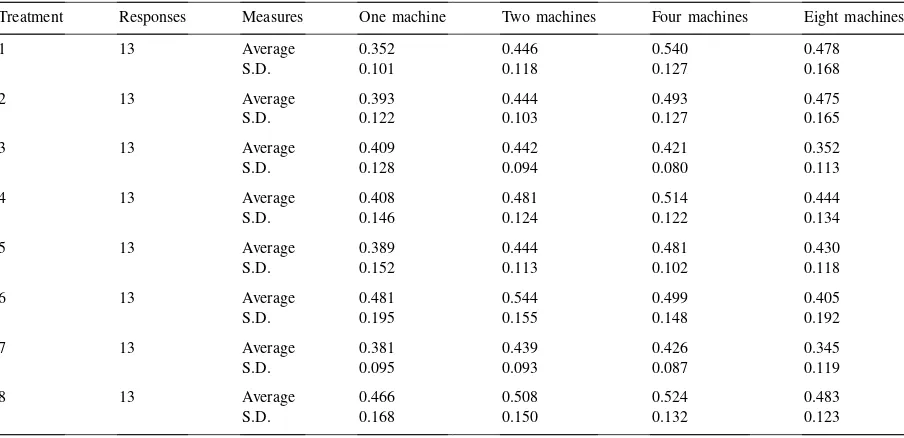
The respondents were asked to rank the attributes and rate the alternatives on each attribute. The MAU re-sult was calculated from these responses. The MAU results of all the respondents were then aggregated by treatment. The results of these calculations showed that multiple machine options were generally preferred over the single machine alternative as a strategic op-tion. While in some cases the single machine option was not statistically less preferred than multiple ma-chine alternatives, this option was the preferred choice in some treatments. Further analysis may help to un-derstand this result, but first the full preference matrix can be seen in Table 2.
The values in Table 2 are MAU preference values on a 0–1 scale, so the higher the number the more that option is preferred in that particular treatment. Tests for significance were run on the results from all four machine alternative preferential values. One-way analysis of variance (ANOVA) testing was used to determine significance. The results of the ANOVA are below in Table 3.
The ANOVA results for the single machine MAU response show that none of the effects are significant at theα=0.05 level. The preference for the single ma-chine alternative has a weak effect (0.10≤α<0.05) from the market differentiation (MD) main factor. The ANOVA results for the two machine MAU response show that the main effect of thex-axis or the MD stra-tegy is significant at theα=0.05 level. This indicates that this factor is significant in affecting manager’s preferences for two machines.
Table 2
MAU preference results by treatment
Treatment Responses Measures One machine Two machines Four machines Eight machines
1 13 Average 0.352 0.446 0.540 0.478
S.D. 0.101 0.118 0.127 0.168
2 13 Average 0.393 0.444 0.493 0.475
S.D. 0.122 0.103 0.127 0.165
3 13 Average 0.409 0.442 0.421 0.352
S.D. 0.128 0.094 0.080 0.113
4 13 Average 0.408 0.481 0.514 0.444
S.D. 0.146 0.124 0.122 0.134
5 13 Average 0.389 0.444 0.481 0.430
S.D. 0.152 0.113 0.102 0.118
6 13 Average 0.481 0.544 0.499 0.405
S.D. 0.195 0.155 0.148 0.192
7 13 Average 0.381 0.439 0.426 0.345
S.D. 0.095 0.093 0.087 0.119
8 13 Average 0.466 0.508 0.524 0.483
S.D. 0.168 0.150 0.132 0.123
Table 3 ANOVA results
Source d.f. Alternative 1,p-values Alternative 2,p-values Alternative 4,p-values Alternative 8,p-values
Model 7 0.3029 0.2328 0.1016∗ 0.0808∗
MD 1 0.0543∗∗ 0.0321∗∗ 0.0794∗ 0.0779∗
PD 1 0.6572 0.9328 0.1724 0.1522
MD×PD 1 0.6626 0.9171 0.0189∗∗ 0.0256∗∗
CS 1 0.1645 0.2006 0.6771 0.4523
MD×CS 1 0.2189 0.1697 0.4596 0.8266
PD×CS 1 0.3982 0.4411 0.4652 0.1852
MD×PD×CS 1 0.7589 0.4512 0.5249 0.5430
∗
p≤0.10. ∗∗
p≤0.05.
Table 4
Summary of experimental effects on the MAU preference values
Alternative Experimental factor Treatment priority with the highest preference value
One large machine MD (weak) Unique products
Two medium–large machines MD Unique products
Four medium–small machines MD×PD Unique products and new product development
MD (weak) Unique products
Eight small machines MD×PD Unique products and new product development
As can be seen from Table 4, the preference for using multiple machines (four and eight machines) on which to compete increases under new product devel-opment competitive priorities. This effect is weak at theα=0.10 level. The result is not surprising because these capacity alternatives offer parallel processing options for the managers. The result, which was unexpected, was the fewer (one and two) machine alternative results.
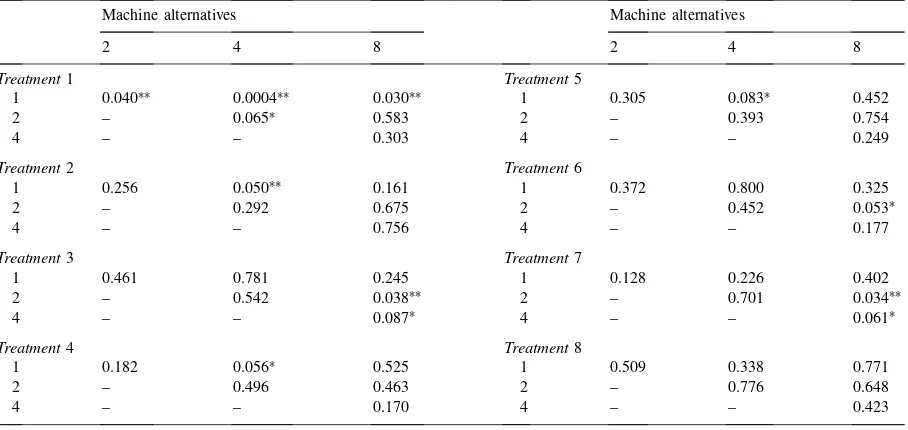
The alternatives with fewer (one and two) machines show a tendency to have preference values increase in treatments competing with unique products. In the case of the single machine alternative, this effect is a weak (at the α=0.10 level) effect, but in the case of the two-machine alternative, this effect is signifi-cant at the α=0.05 level. Further t-test analysis for paired comparisons between alternatives within treat-ments was used to explain this result because this pro-cedure helps identify which alternatives are preferred under the various priorities.
The procedure uses pairedt-tests to compare MAU values within treatments. In this way the MAU values are tested for significant differences. This information helps explain which alternatives if any are preferred
Table 6
Thep-value results of MAU alternative differences by treatment
Machine alternatives Machine alternatives
2 4 8 2 4 8
Treatment1 Treatment5
1 0.040∗∗ 0.0004∗∗ 0.030∗∗ 1 0.305 0.083∗ 0.452
2 – 0.065∗ 0.583 2 – 0.393 0.754
4 – – 0.303 4 – – 0.249
Treatment2 Treatment6
1 0.256 0.050∗∗ 0.161 1 0.372 0.800 0.325
2 – 0.292 0.675 2 – 0.452 0.053∗
4 – – 0.756 4 – – 0.177
Treatment3 Treatment7
1 0.461 0.781 0.245 1 0.128 0.226 0.402
2 – 0.542 0.038∗∗ 2 – 0.701 0.034∗∗
4 – – 0.087∗ 4 – – 0.061∗
Treatment4 Treatment8
1 0.182 0.056∗ 0.525 1 0.509 0.338 0.771
2 – 0.496 0.463 2 – 0.776 0.648
4 – – 0.170 4 – – 0.423
∗p≤0.10. ∗∗p≤0.05.
Table 5
Ordered alternatives by MAU preference values
Treatment Ordered (highest to lowest) alternatives
1 4, 8, 2, 1
2 4, 8, 2, 1
3 2, 4, 1, 8
4 4, 2, 8, 1
5 4, 2, 8, 1
6 2, 4, 1, 8
7 2, 4, 1, 8
8 4, 2, 8, 1
over others in different treatments. Thep-values are better understood when the alternatives from Table 2 are reordered by MAU value. The reordered values (highest to lowest) by treatment are in Table 5.
Table 7
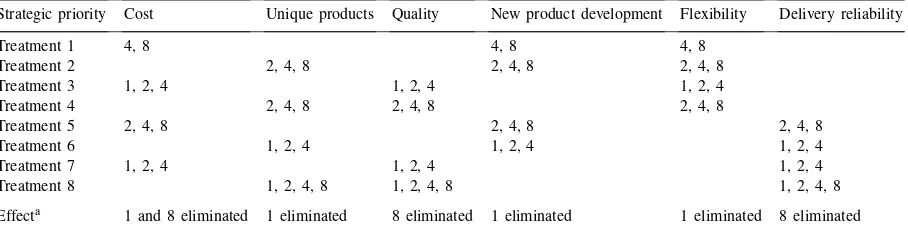
Effect of the treatment priorities on alternatives
Strategic priority Cost Unique products Quality New product development Flexibility Delivery reliability
Treatment 1 4, 8 4, 8 4, 8
Treatment 2 2, 4, 8 2, 4, 8 2, 4, 8
Treatment 3 1, 2, 4 1, 2, 4 1, 2, 4
Treatment 4 2, 4, 8 2, 4, 8 2, 4, 8
Treatment 5 2, 4, 8 2, 4, 8 2, 4, 8
Treatment 6 1, 2, 4 1, 2, 4 1, 2, 4
Treatment 7 1, 2, 4 1, 2, 4 1, 2, 4
Treatment 8 1, 2, 4, 8 1, 2, 4, 8 1, 2, 4, 8
Effecta 1 and 8 eliminated 1 eliminated 8 eliminated 1 eliminated 1 eliminated 8 eliminated aThe alternative was considered eliminated through a heuristic which determined that unless the alternative was statistically significant
in at least three of the four treatments containing that priority then the alternative was eliminated.
The results indicated that in all but one treatment the most preferred and the least preferred alternatives were statistically different (at anα=0.10 level). The other alternatives were not statistically different. Therefore, as an example in treatment 1, alternative four cannot be selected as the preferred alternative because it is not significantly preferred over alternatives eight or two. If, however, alternative one is considered elimi-nated based on statistical differences, then an interest-ing dynamic develops. This dynamic is presented in Table 7.
In Table 7, the machine alternatives which were measured as at least weakly significant (to theα=0.10 level) are listed by treatment under each priority. For instance, treatment 2 presents a respondent with the challenge of competing with three specific strategic priorities (unique products, developing new products, and flexibility) shows that the respondents preferred to eliminate the one large machine alternative and preferred to compete on these priorities with multiple machine alternatives. The columns, then, represent each of the treatments the priority was presented to the respondents. The priority of competing with unique products was presented to the respondents assigned to treatments 2, 4, 6 and 8. When the col-umn was examined, the machine alternatives, which were not preferred in at least three of four treat-ments, were then eliminated to emphasize priority tendencies.
The summarized results in the last row of Table 7 showed that managers competing on unique product, new product development, and flexibility
priorities tended to eliminate the one large machine alternative. Those competing on delivery reliability and quality priorities tended to not select the eight smaller machines. Those competing on cost prior-ities preferred to compete with the two and four alternatives. It is this particular result that provides insight into the ANOVA results for the fewer (one and two) machine alternatives in Table 4. These results indicate that under cost priorities managers tended to favor the middle alternatives (two and four ma-chines) avoiding in particular the large single machine alternative.
8. Discussion and conclusions
Based on the ANOVA results, the conclusion that operating strategies affect capacity choices was sup-ported. Under the boundaries of this study, when man-agers were given a strategic priority, they endeavored to use those capacity choices to meet the strategic goals. Even in the case of the single machine alter-native, the experimental factors influenced how this alternative was viewed. Infrastructural factors were valued in using this option with which to compete. This was understandable because a single machine limits the number of degrees of freedom a manager has in operating. Therefore, other intangible factors must be utilized to support the use of this capacity choice.
The objective assigned to the respondents was to gain and sustain competitive advantage by purchasing one of the equipment choices. The choices were scalable and equal. Therefore, each alternative resulted in an option, which could help them meet the strategic goals of their assigned treatment. In some of the treatments, an a priori expectation would be that the managers and professionals would use big, fast, and productive equipment to gain advantages through such structural factors as reducing costs and increasing productivity. Despite existing theory regarding these structural in-fluences, the respondents chose alternatives that re-sulted in managerial options for them. Even when cost is a priority, managers appear to consider reliability in making decisions.
The evidence indicated that structural considera-tions may have influenced managers’ values under quality and delivery priorities. The effect from these two priorities was that respondents tended to prefer-entially eliminate the eight small machine alternative as an operating option (Table 7). Therefore, the ev-idence supports the conclusions that quality and de-livery priorities favored fewer machine alternatives. Preferring fewer larger machines would be logical if machine-to-machine variability was a quality con-cern. This would occur when the same product was produced on different machines introducing unwanted variability in the product. Preferring fewer larger machines would be logical under delivery priorities if managers perceived that the parallel processing machines would be loaded out with other scheduled products.
The evidence indicated that the priorities of unique products, new product development and flexibility either individually or through interactions tended to eliminate the respondents’ preferences for fewer (one) machines (Table 7). The respondents valued multiple machines (two under the unique product priority and four or eight under interacting priorities of competing with unique products and developing new products). Therefore, the conclusion was supported statistically, despite the presence of experimental noise limiting statistical significance, that subjects competing on these priorities tended to have higher preferences for the multiple machine alternatives. The multi-ple machine alternatives provided the respondents with managerial options in meeting the customer demands of these priorities. The respondents’
pref-erences, however, for one machine were uniquely explained by evaluating the results from the cost priorities.
Cost priorities had the effect of eliminating both the one and eight machine alternatives. The results in Table 7 showed that when faced with cost priorities, respondents tended to eliminate the one large machine option and the eight small machine alternative. This was the only priority that eliminated these two alterna-tives. One possible alternative of this experiment was that the subjects would meet this challenge of lower-ing costs by buylower-ing the biggest, most productive ma-chine as a means to cut as many costs as possible. The results, however, were contradictory to this reasoning. Managers wanted the reliability of a second machine. If one machine went down for maintenance, then at least a second machine was available for production. The results supported the reliability argument indicat-ing that, while cost driven structural factors are impor-tant to manage, the subjects would approach the cost differentiation strategy with the reliability of two or four machines.
The ANOVA results support rejecting the hypotheses. Operating strategy, as expressed by competitive priorities, has a significant effect on equipment choice. The different strategic priorities generated different solutions (Table 7). In all cases, the extremes (though not necessarily both extremes) were eliminated. This is perhaps expected, but mov-ing towards the mean would have been easier to explain if both extremes were eliminated. Removing the eight machine alternative, however, signifies a preference for fewer machines while removing the one machine alternative signifies a preference for multiple machines. This means that the managers were endeavoring to use the equipment selection de-cision to meet the managerial priorities presented to them.
operating personnel. This line of research then can be used to investigate application to other businesses. For instance, the research can investigate how banks should strategically use capacity resources to gain and sustain competitive advantage or how hospitals can utilize assets to gain and sustain a strategic competitive advantage.
Appendix A
A.1. Experiment scenario
You are making a decision to purchase equipment. You are hoping to gain sustainable competitive advan-tage over your competitors by purchasing this equip-ment.
You are going to randomly be put into a man-ufacturing scenario which will give you additional information. In this scenario, you will be given three manufacturing priorities on which you are competing in the marketplace. It is important that you give all three priorities equal weighting even if they appear to be competing priorities. Your ability to reconcile and achieve all three prior-ities will provide significant information in this study.
You are going to buy the equipment to fit the scenario presented to you. You are trying to de-cide between purchasing among the following options:
• one large machine (e.g. one 400 t machine); • two larger medium sized machines (e.g. two 200 t
machines);
• four smaller medium sized machines (e.g. four 100 t machines);
• eight small machines (e.g. eight 50 t machines). Each of the purchase options are capable of running the jobs with relative capability, equal productivity, quality, etc. For example, the eight smaller machines taken together can produce equal pounds in an hour which one large machine can produce.
With this equipment purchase, your current plan is to produce approximately 16 commercial grade prod-ucts. You can meet the demand of all 16 products on any of the four machine options, but by running all 16 products about 80% of your machine time will be
uti-lized including both run time and setup time for these products.
A.2. Example scenario 1
• You need to sustain competitive advantage over your competitors.
• You need to make an equipment purchase to handle 16 commercial products.
• This will require 80% of your machine time. • You need to differentiate yourself on three
compet-itive priorities.
• Equal weight is assigned to all three competing pri-orities. These three strategic priorities for you are as follows:
1. Market strategy: You are a cost differentiator. Your company competes by driving cost lower. 2. Product development strategy: You develop new
products rapidly for your customers. This is a selling point of your operation.
3. Customer services strategy: Flexibility is paramount. You need to be able to switch be-tween products quickly.
A.3. Example scenario 2
• You need to sustain competitive advantage over your competitors.
• You need to make an equipment purchase to handle 16 commercial products.
• This will require 80% of your machine time. • You need to differentiate yourself on three
compet-itive priorities.
• Equal weight is assigned to all three competing pri-orities. These three strategic priorities for you are as follows:
1. Market strategy: You are a product differentiator.
Your company competes by
providing a unique product to the marketplace. 2. Product development strategy: You continuously
improve the quality of your existing product lines. This is a selling point of your company.
Appendix B Alternative ranking across attributes
References
Ancel, E.W., Griffiths, M.D., 1996. Strategic methodologies of investment appraisal of AMT objects: a review and synthesis. The Engineering Economist 41 (4), 345–363.
Clark, K.B., 1996. Competing through manufacturing and the new manufacturing paradigm: is manufacturing strategy pass? Production and Operations Management 5 (1), 42–59.
De Meyer, A., Nakane, J., Miller, J.G., Ferdows, K., 1989. Flexibility: the next competitive battle. The manufacturing futures survey. Strategic Management Journal 10, 135–144. Ferdows, K., De Meyer, A., 1990. Lasting improvements in
manufacturing theory: in search of a new theory. Journal of Operations Management 9, 168–183.
Hayes, R.H., 1985. Strategic planning — forward in reverse? Harvard Business Review 63 (6), 111–119.
Hayes, R.H., Wheelwright, S.C., 1984. Restoring Our Competitive Edge — Competing Through Manufacturing. Wiley, Chichester, MA.
Hayes, R.H., Wheelwright, S.C., Clark, K.B., 1988. Dynamic Manufacturing. Free Press, New York.
Hill, T., 1989. Manufacturing Strategy: Text and Cases. Irwin, Homewood, IL.
Hitt, M.A., Ireland, R.D., Hoskisson, R.E., 1995. Strategic Management, Competitiveness, and Globalization, 2nd Edition. West Publishing, St. Paul, MN.
Kalotay, A.J., 1973. Capacity expansion and specialization. Management Science 20 (1), 56–64.
Karmarkar, R.L., Kekre, S., 1987. Manufacturing configuration, capacity and mix decisions considering operational costs. Journal of Manufacturing Systems 6 (4), 315–324.
Keeney, R.L., Raiffa, H., 1976. Decisions with Multiple Objectives: Preferences and Value Tradeoffs. Wiley, New York.
Lefley, F., 1996. Strategic methodologies of investment appraisal of AMT objects: a review and synthesis. The Engineering Economist 41 (4), 345–363.
Lentner, M., Bishop, T., 1993. Experimental Design and Analysis, 2nd Edition. Valley Book Company, Blacksburg, VA. Leong, G.K., Snyder, D.L., Ward, P.T., 1990. Research in the
process and control of manufacturing strategy. OMEGA 18 (2), 109–122.
Lindberg, P., Linder, J., Tunalv, C., 1988. Strategic decisions in manufacturing — on the choice of investments in flexible production organizations. International Journal of Production Research 26 (10), 1695–1704.
Markland, R.E., Vickery, S.K., Davis, R.A., 1998. Operations Management Concepts in Manufacturing and Service, 2nd Edition. West Publishing, St. Paul, MN.
Mata, F.J., Fuerst, W.L., Barney, J.B., 1995. Information technology and sustained competitive advantage: a resource-based analysis. MIS Quarterly 12, 487–505. Mills, J., Platts, K., Gregory, M., 1995. A framework for the design
of manufacturing strategy processes. International Journal of Operations and Production Management 15 (4), 17–49. Newnan, D.G., 1991. Engineering Economic Analysis, 4th Edition.
Engineering Press, San Jose, CA.
Noaker, P.A., 1994. Can you justify change? Manufacturing Engineering 113 (6), 30–35.
Olson, D.L., 1996. Decision Aids for Selection Problems. Springer, New York.
Persson, I., 1991. Developing a manufacturing strategy within a capital investment process — a case study. International Journal of Operations and Production Management 11 (3), 32–42. Porter, M.E., 1985. Competitive Advantage. Free Press, New York. Sage, A.P., 1983. Economic Systems Analysis Microeconomics for Systems Engineering, Engineering Managements, and Project Selection. Elsevier, New York.
Schmenner, R.W., 1984. Production/Operations Management, Concepts, and Situations, 2nd Edition. Science Research Associates, Chicago, IL.
Skinner, W., 1969. Manufacturing the missing link corporate strategy. Harvard Business Review 3, 139–144.
Skinner, W., 1985. Manufacturing: The Formidable Competitive Weapon. Wiley, New York.
Skinner, W., 1996. Three yards and a cloud of dust: industrial management at century end. Production and Operations Management 5 (1), 15–24.
Tarquin, A.J., Blank, L.T., 1976. Engineering Economy: A Behavioral Approach. McGraw-Hill, New York.
Tracey, M., Vonderembse, M.A., Lim, J., 1999. Manufacturing technology and strategy formulation: keys to enhancing competitiveness and improving performance. Journal of Operations Management 17 (4), 411–428.
Upton, D.M., 1995. What really makes factories flexible? Harvard Business Review 7/8, 74–84.
Van Horne, J.C., 1988. Financial Management and Policy, 7th Edition. Prentice-Hall, Englewood Cliffs, NJ.
Van der Veen, D.J., Jordan, W.C., 1989. Analyzing trade-off between machine investment and utilization. Management Science 35 (10), 1215–1226.
Vickery, S.K., 1991. A theory of production competence revisited. Decision Sciences 22, 635–643.
Ward, P.T., McCreery, J.K., Ritzman, L.P., Sharma, D., 1998. Competitive priorities in operations management. Decision Sciences 29 (4), 1035–1046.