www.elsevier.com / locate / livprodsci
Requirements of lactating dairy cows for leucine and
methionine at the duodenum
a b ,
*
M. Iburg , P. Lebzien
a
LOHMANN Tierzucht GmbH, Am Seedeich 9 –11, Postfach 460, 0-27454 Cuxhaven, Germany
b
Institute of Animal Nutrition, Federal Agricultural Research Centre Braunschweig, Bundesallee 50, D 38116 Braunschweig, Germany Received 16 June 1998; received in revised form 6 April 1999; accepted 15 April 1999
Abstract
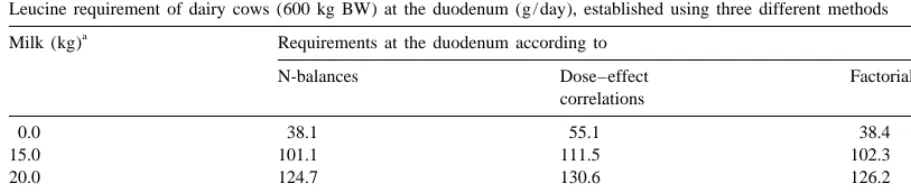
Infusion experiments were conducted with nine lactating dairy cows of the German Black and White breed in mid-stages of lactation, with a daily milk production averaging 20–25 kg fat-corrected milk (FCM). The cows were fitted with rumen and duodenal cannulae. The objective of the study was to investigate the cows’ requirements for leucine and methionine at zero N-balance as supply to the duodenum. Over a period of 13 weeks, the animals received rations that were sufficient for maintenance plus 17 or 15 kg milk / day, regardless of the actual, higher yields of the animals. Differences between estimated requirements (according to recent knowledge) and energy- and amino-acid supply by the ration were met by sucrose (hydrolysed)-, caseine (hydrolysed)- and amino-acid infusion into the proximal duodenum. Alternatively, leucine and methionine were withheld from the infusion. Each experimental variation went on for five days. During this time, N-balances were established. Following the 11 infusion periods, the amounts of amino acids at the duodenum resulting from the rations were measured. The daily amounts of leucine sufficient to meet the requirements of dairy cows [600 kg body weight (BW)] for maintenance alone and for maintenance plus 15, 20, 25 or 30 kg milk / day were 38.1, 101.1, 124.7, 148.3 and 171.9 g, respectively. These values corresponded with those calculated from dose–effect correlations (55.1, 111.5, 130.6, 150.0 and 169.4 g) at zero N-balance. Daily methionine requirements, calculated at zero N-balances, were 6.3, 22.6, 28.4, 34.1 and 40.0 g. Again, these results corresponded well with estimations derived from dose–effect correlations (5.6, 22.7, 28.4, 33.1 and 39.8 g). 2000 Elsevier Science B.V. All rights reserved.
Keywords: Dairy cows; Leucine; Methionine; Amino acids requirements
1. Introduction strated, the same amino acids are essential for both species. However, in ruminants, the amounts of In principle, the protein metabolism of ruminants amino acids available at the duodenum are not at tissue level resembles that of non-ruminants. As directly proportional to the corresponding amino Black et al. (1957) and Downes (1961) demon- acids in the ration, but depend on the complex nitrogen metabolism in the rumen. Due to meth-odical problems, our knowledge of maintenance
*Corresponding author. Tel.:149-531-596-440; fax:1
49-531-requirements, absorbability and intermediary
utilisa-596-376.
E-mail address: [email protected] (P. Lebzien) tion of individual amino acids in dairy cows is
limited (MacRae and Beever, 1997) and does not N-balance is zero and no other nutrient has a limiting readily allow quantification of the requirements for effect.
the individual amino acids at the duodenum. Schwab (1996) described three approaches that have been
used to estimate the amino-acid requirements of 2. Materials and methods
lactating dairy cows; ‘‘factorial’’ (mathematical),
‘‘direct dose–response’’ and ‘‘indirect dose–re- 2.1. Experimental design sponse’’, and discussed the advantages and
disadvan-tages of these methods. For a fuller description of the Nine lactating dairy cows of the German Black different methods, the reader is referred to Schwab and White breed in the mid-stage of lactation, with a
(1996). daily milk production averaging 20–25 kg
fat-cor-The objective of the present study was to de- rected milk (FCM) at the beginning of the trial, were termine the leucine and methionine requirements of used. Mean liveweight of the animals was 598622 lactating dairy cows at the small intestine. A method kg. The animals were fitted with ruminal cannulas was established to measure the effects of defined and simple T-type cannulas in the proximal deficiencies of single amino acids at the duodenum duodenum, positioned between the pyloric valve of in otherwise well-balanced rations on milk yields and the abomasum and the entrance of the bile duct. The N-balances (‘‘three-dimensional dose–effect correla- duodenal cannulas had an inner diameter of 20 mm tions’’). and were exteriorised caudally to the ribs. They were For this purpose, the protein- and energy require- made of polyethylene and the base was a disk with a ments of the animals were met by a combination of diameter of 60 mm.
2.2. Feeding 1. regular feeding and
2. infusion of amino acids and hydrolysed sucrose
Over a period of 13 weeks, all animals were into their proximal duodenum.
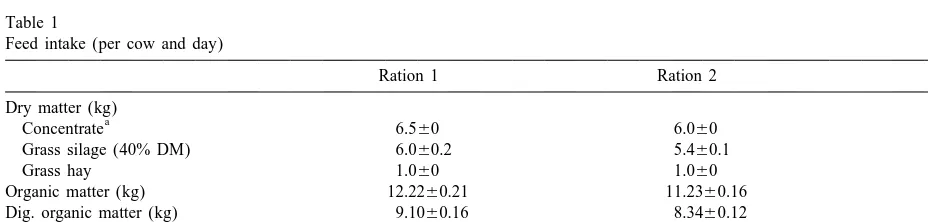
offered rations that were sufficient either for mainte-nance requirements plus 17 kg milk / day (Ration 1) Afterwards, the results were compared with the or 15 kg milk / day (Ration 2), regardless the actual results from factorial calculations (Rohr and Lebzien, milk yields of the animals, which were higher. The 1991) and calculations from changes in N-balance. composition of the rations is given in Table 1. In the latter case, amino-acid requirement for a given It was intended to give energy and protein suffi-milk protein yield is defined as the lowest amount of cient for approximately 7 kg of FCM by infusion. amino acid at the duodenum that is required to Thus, animals had to be divided into two groups, realise this protein yield, under the condition that based on their milk yield during the week prior to the
Table 1
Organic matter (kg) 12.2260.21 11.2360.16
Dig. organic matter (kg) 9.1060.16 8.3460.12
Metabolisable energy (MJ) 14662.6 13661.9
Net energy (MJ) 88.161.6 82.261.2
Nitrogen (g) 370 342
a
0.75
infusion period. Animals yielding 23 to 25 kg of (BW ) and an energy requirement for milk pro-FCM received ration 1 (sufficient for maintenance duction (MJ NEL / day) as [0.373milk fat content plus 17 kg of FCM), whereas, in cases where the (%)10.213protein content (%)10.95]3milk yield was below 23 kg (20–23 kg) FCM / day, yield (kg). Differences between the actual energy animals received ration 2 (sufficient for maintenance requirement of the animals and that supplied by the plus 15 kg of FCM). diet was met by infusion of hydrolysed sucrose into By withholding defined amounts of leucine and the duodenum (330 to 2100 g / day). The sucrose was methionine from the infusion solutions, effects on hydrolysed by invertase (Sigma, Deisenhofen, Ger-the N-balances allowed an estimation of Ger-the require- many) at pH 4.5 and 558C for 20 min. The NEL ments for leucine and methionine. content of sucrose was calculated as 9.9 MJ / kg (16.5 N-balances were calculated as N-balance5N-in- MJ gross energy / kg sucrose30.6 [efficiency for take2N-excretion (faeces, urine, milk). Productive milk production]).
N was calculated as the sum of N excreted via the Differences between the actual amino acid require-milk and retinated resp. mobilised body protein-N. ment and the amino acid supply by the ration were The animals received their ration in two equal met by continuous infusions of enzymatically hydro-meals at 7.30 am and 3.30 pm. The first two weeks lysed caseine (Megglysat CB, Meggle, Wasserburg, of the experiment served as an adaptation period. Germany) and amino acids (Welding, Frankfurt, Germany and Degussa, Hanau, Germany) into the 2.3. Infusions proximal duodenum via the duodenal cannulas. The basis for the calculation of the amount of individual It was our intention that the rations would not be amino acids needed at the duodenum was the net sufficient to fulfil the total requirements of the requirement for amino acids, defined as the amount animals for energy and amino acids. The requirement of amino acids required for maintenance plus the gap that arose during the trial periods was closed by amount of amino acids excreted with the milk: The infusing appropriate amounts of single nutrients net requirement for amino acids was calculated by (hydrolysed sucrose, hydrolysed caseine, amino estimating the net requirement for N according to acids) into the proximal duodenum. Rohr and Lebzien (1991) and taking into account the Calculations for energy- and amino-acid require- mean amino-acid composition of endogenous secre-ments were performed on a weekly basis. Fresh tions, tissue- and milk protein. Net nitrogen require-infusion solutions were prepared daily by diluting the ment (g) was calculated as: urinary nitrogen excreted amino acids and the hydrolysed caseine in 1700 ml (UN )e 1faecal nitrogen excreted (FN )e 1 surface-of water at 50638C. This solution was transfered loss nitrogen (VN)1milk protein-N, UN (g / day)e
into an infusion-bin containing 5000 ml of water, was calculated as 5.92 log BW26.76; FN (g / day)e
supplemented with 40 ml of propionic acid, to avoid was estimated as 2.913kg dry matter intake (DMI)
0.75
microbial contamination. After that, the hydrolysed and VN (g / d) as 0.0183BW . In addition, in-sucrose was added and dissolved by gentle stirring of testinal absorption of the amino acids and intestinal the solution. The osmolality of the solution was utilisation of the amino acids absorbed were included approx. 300 mOsmol / kg. The solutions were infused in the calculations (Rohr and Lebzien, 1991). using a tube pump (IKA Labortechnik, type PA-SF). Prediction of intestinal supply of amino acids was The tubes were fixed to the animals using non- according to Rohr and Lebzien (1991) and compared irritant breast harnesses. The mean pump capacity with calculations by Hvelplund and Madsen (1989). was 306 ml / h, resulting in a total infusion time of 22 The equation for the calculation of duodenally h per day. The remaining 2 h were used for available individual amino acids (Rohr and Lebzien, maintenance of the technical equipment. 1991) reads:
The total energy requirement of the animals was
calculated according to GfE (1986), giving an energy AA (g / day)5
x
requirement for maintenance [MJ net energy for
[27.83 DOM (kg / day)10.34 NI (g / day)22.34 DMI (kg / day)226.3)3a3b 0.75
]]]]]]]]]]]]]
where, AAx5relevant amino acid; DOM5digestible digestibility of nutrients was calculated from differ-organic matter; DMI5dry matter intake; NI5feed-N ences in nutrient flow in digesta at the various sites intake (exclusive urea-N); a5AA2nitrogen fraction of the gastrointestinal tract. Estimation of the amino of the non-urea-N in the duodenal chyme (50.73); acids was performed according to the procedure of
b5N from relevant amino acid (as a percentage of Spackmann et al. (1958), as modified by Weidner the total AAN) and c5N content of the individual and Eggum (1966), using an automated amino acid amino acids (%). analyzer (Beckmann System 6300).
2.4. Experimental groups 2.5. Statistical methods
The nine animals served as a trial group, from The effects of different amounts of the respective which, every week, two animals were allocated to amino acids on the N-balances allowed an estimation the balance trials for five days. Selection of the of the actual amino acid requirements of the animals. animals was based on their state of health, feed This was undertaken, on the basis of the data intake and performance. During this time, leucine or derived, for leucine and methionine.
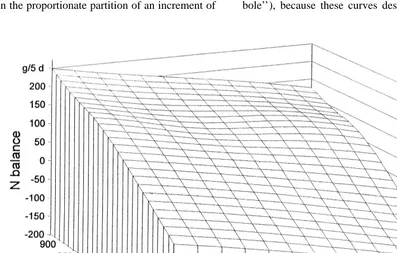
methionine were withhold alternatively from the A three-dimensional surface graph was chosen for infused solution, and faeces, urine and milk were presentation of the data, with the x-axis representing collected separately to establish N-balances. The the amount of nitrogen in the milk, the y-axis giving cows were milked twice daily. The urine was the amount of the relevant amino acid at the delivered into 40-l bins containing 250 ml of hydro- duodenum and the z-axis showing the N-balance chloric acid. Faeces and urine were weighed and resulting from the combination of x- and y-values. In subsampled daily for analysis. Composite samples of this way, the results of various infusion trials dealing the feed and left-over were freeze-dried, ground in a with the same amino acid were combined. Spline 1-mm screen ultracentrifuge-mill, and analyzed for interpolation of the derived data was carried out to organic matter, crude protein, crude fibre, ether interpolate a function for the two variables, N in the extract and ash (Naumann and Bassler, 1976). Urine milk and the amount of amino acids at the and milk samples were analyzed for nitrogen using duodenum, onto a rectangular grid by using the SAS the Kjeldahl-method (Naumann and Bassler, 1976). G3GRID procedure (SAS / GRAPH User’s Guide, Milk weights were recorded daily at each milking. 1988).
Milk samples of morning and afternoon milkings were taken on day two and day five of the infusion
period, preserved with potassium dichromate and 3. Results and discussion
stored at 48C until analyzed for lactose, protein and
Table 2
Digestibility (%) of the crude nutrients in the rations (n54)
Ration Organic Crude Ether Crude N-free
matter protein extract fibre extract
1 74.562.6 65.463.2 62.566.6 76.762.1 77.264.0
2 74.361.8 66.162.8 63.266.9 76.662.3 76.861.5
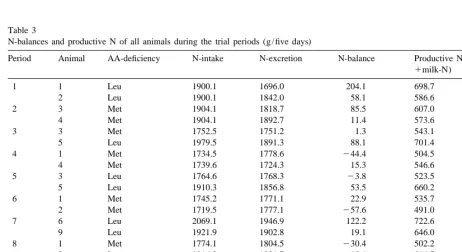
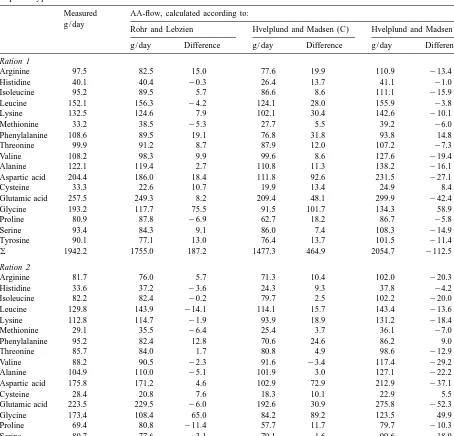
essential amino acid leads to a negative effect on the acid flow calculated according to Rohr and Lebzien N-balance, independent of the total N-supply. N- (1991) were less than 10%. Nevertheless, for some balances and productive N in relation during the amino acids, there is considerable imprecision. This various trial periods are given in Table 3. The results in problems in estimating the duodenal flow measured amounts of amino acids at the duodenum for single amino acids precisely. Based on the from rations 1 and 2 are given in Table 4. To duodenal flow of amino acids measured at the determine if it is possible to obtain an accurate duodenum and the estimated requirement at the calculation of the flow of individual amino acids at duodenum for individual amino acids, the rank of the duodenum, based on the characteristics of the limiting amino acids was given as leucine, iso-rations, the measured amino acid flow at the leucine, methionine, valine, histidine, threonine, duodenum was compared with calculations based on lysine, phenylalanine and arginine. These findings equations by Rohr and Lebzien (1991) and Hvel- are in contrast to those of other authors, where, in plund and Madsen (1989). It can be seen in Table 4 general, methionine and lysine were considered as that the differences between the measured total first resp. second-limiting amino acids (Schwab et amino acid flow at the intestine and the total amino al., 1976; Clark et al., 1977; Rogers and McLeay,
Table 3
N-balances and productive N of all animals during the trial periods (g / five days)
Period Animal AA-deficiency N-intake N-excretion N-balance Productive N (N-balance
1milk-N)
1 1 Leu 1900.1 1696.0 204.1 698.7
2 Leu 1900.1 1842.0 58.1 586.6
2 3 Met 1904.1 1818.7 85.5 607.0
4 Met 1904.1 1892.7 11.4 573.6
3 3 Met 1752.5 1751.2 1.3 543.1
5 Leu 1979.5 1891.3 88.1 701.4
4 1 Met 1734.5 1778.6 244.4 504.5
4 Met 1739.6 1724.3 15.3 546.6
5 3 Leu 1764.6 1768.3 23.8 523.5
5 Leu 1910.3 1856.8 53.5 660.2
6 1 Met 1745.2 1771.1 22.9 535.7
2 Met 1719.5 1777.1 257.6 491.0
7 6 Leu 2069.1 1946.9 122.2 722.6
9 Leu 1921.9 1902.8 19.1 646.0
8 1 Met 1774.1 1804.5 230.4 502.2
3 Leu 1816.3 1831.7 215.4 514.7
9 5 Leu 1943.5 1803.0 140.4 713.3
6 Leu 1940.9 2064.4 2121.4 442.4
10 5 Leu 1804.2 1895.9 291.7 507.3
6 Met 1907.0 1863.7 43.3 566.3
11 7 Leu 1955.9 1839.6 116.3 624.9
Table 4
Measured versus estimated flow of amino acids at the duodenum [according to Rohr and Lebzien (1991) and Hvelplund and Madsen (1989), respectively]
Measured AA-flow, calculated according to: g / day
Rohr and Lebzien Hvelplund and Madsen (C) Hvelplund and Madsen (R) g / day Difference g / day Difference g / day Difference
Ration1
Arginine 97.5 82.5 15.0 77.6 19.9 110.9 213.4
Histidine 40.1 40.4 20.3 26.4 13.7 41.1 21.0
Isoleucine 95.2 89.5 5.7 86.6 8.6 111.1 215.9
Leucine 152.1 156.3 24.2 124.1 28.0 155.9 23.8
Lysine 132.5 124.6 7.9 102.1 30.4 142.6 210.1
Methionine 33.2 38.5 25.3 27.7 5.5 39.2 26.0
Phenylalanine 108.6 89.5 19.1 76.8 31.8 93.8 14.8
Threonine 99.9 91.2 8.7 87.9 12.0 107.2 27.3
Valine 108.2 98.3 9.9 99.6 8.6 127.6 219.4
Alanine 122.1 119.4 2.7 110.8 11.3 138.2 216.1
Aspartic acid 204.4 186.0 18.4 111.8 92.6 231.5 227.1
Cysteine 33.3 22.6 10.7 19.9 13.4 24.9 8.4
Glutamic acid 257.5 249.3 8.2 209.4 48.1 299.9 242.4
Glycine 193.2 117.7 75.5 91.5 101.7 134.3 58.9
Proline 80.9 87.8 26.9 62.7 18.2 86.7 25.8
Serine 93.4 84.3 9.1 86.0 7.4 108.3 214.9
Tyrosine 90.1 77.1 13.0 76.4 13.7 101.5 211.4
o 1942.2 1755.0 187.2 1477.3 464.9 2054.7 2112.5
Ration2
Arginine 81.7 76.0 5.7 71.3 10.4 102.0 220.3
Histidine 33.6 37.2 23.6 24.3 9.3 37.8 24.2
Isoleucine 82.2 82.4 20.2 79.7 2.5 102.2 220.0
Leucine 129.8 143.9 214.1 114.1 15.7 143.4 213.6
Lysine 112.8 114.7 21.9 93.9 18.9 131.2 218.4
Methionine 29.1 35.5 26.4 25.4 3.7 36.1 27.0
Phenylalanine 95.2 82.4 12.8 70.6 24.6 86.2 9.0
Threonine 85.7 84.0 1.7 80.8 4.9 98.6 212.9
Valine 88.2 90.5 22.3 91.6 23.4 117.4 229.2
Alanine 104.9 110.0 25.1 101.9 3.0 127.1 222.2
Aspartic acid 175.8 171.2 4.6 102.9 72.9 212.9 237.1
Cysteine 28.4 20.8 7.6 18.3 10.1 22.9 5.5
Glutamic acid 223.5 229.5 26.0 192.6 30.9 275.8 252.3
Glycine 173.4 108.4 65.0 84.2 89.2 123.5 49.9
Proline 69.4 80.8 211.4 57.7 11.7 79.7 210.3
Serine 80.7 77.6 3.1 79.1 1.6 99.6 218.9
Tyrosine 78.6 71.0 7.6 70.3 8.3 93.3 214.7
o 1673.0 1615.9 57.1 1358.7 314.3 1889.7 2216.7
(R)5‘‘roughage-diet’’, (C)5‘‘concentrate-diet’’, as mentioned by Hvelplund and Madsen (1989).
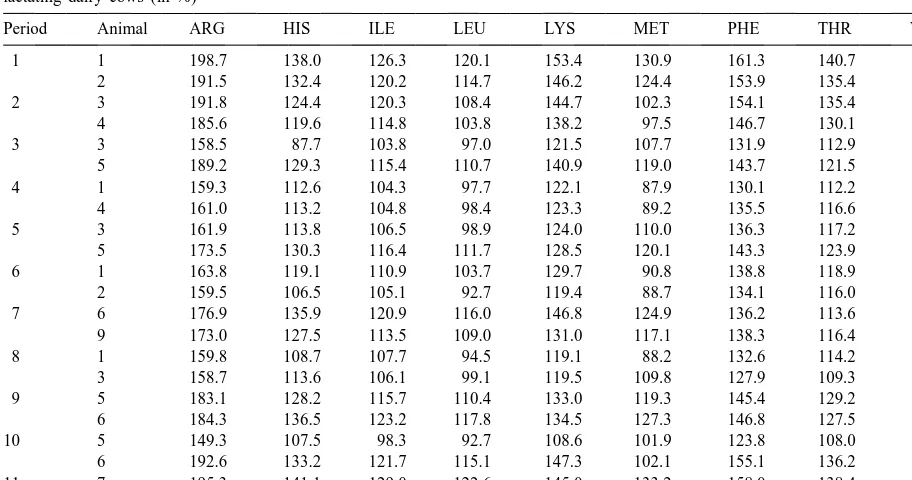
Table 5
Relation of amino acid supply at the duodenum to the estimated amino acid requirement (Rohr and Lebzien, 1991) at the duodenum of the lactating dairy cows (in %)
Period Animal ARG HIS ILE LEU LYS MET PHE THR VAL
1 1 198.7 138.0 126.3 120.1 153.4 130.9 161.3 140.7 135.7
2 191.5 132.4 120.2 114.7 146.2 124.4 153.9 135.4 129.7
2 3 191.8 124.4 120.3 108.4 144.7 102.3 154.1 135.4 122.8
4 185.6 119.6 114.8 103.8 138.2 97.5 146.7 130.1 117.7
3 3 158.5 87.7 103.8 97.0 121.5 107.7 131.9 112.9 105.1
5 189.2 129.3 115.4 110.7 140.9 119.0 143.7 121.5 124.5
4 1 159.3 112.6 104.3 97.7 122.1 87.9 130.1 112.2 105.7
4 161.0 113.2 104.8 98.4 123.3 89.2 135.5 116.6 106.5
5 3 161.9 113.8 106.5 98.9 124.0 110.0 136.3 117.2 107.1
5 173.5 130.3 116.4 111.7 128.5 120.1 143.3 123.9 125.6
6 1 163.8 119.1 110.9 103.7 129.7 90.8 138.8 118.9 112.0
2 159.5 106.5 105.1 92.7 119.4 88.7 134.1 116.0 100.7
7 6 176.9 135.9 120.9 116.0 146.8 124.9 136.2 113.6 130.2
9 173.0 127.5 113.5 109.0 131.0 117.1 138.3 116.4 122.7
8 1 159.8 108.7 107.7 94.5 119.1 88.2 132.6 114.2 102.5
3 158.7 113.6 106.1 99.1 119.5 109.8 127.9 109.3 107.1
9 5 183.1 128.2 115.7 110.4 133.0 119.3 145.4 129.2 124.8
6 184.3 136.5 123.2 117.8 134.5 127.3 146.8 127.5 132.4
10 5 149.3 107.5 98.3 92.7 108.6 101.9 123.8 108.0 100.3
6 192.6 133.2 121.7 115.1 147.3 102.1 155.1 136.2 130.7
11 7 195.3 141.1 129.0 122.6 145.0 133.2 158.0 138.4 138.0
8 181.4 123.4 111.5 106.3 131.4 114.8 138.1 120.9 106.3
defined several amino acids as being co-limiting for methionine or leucine in milk and body tissue at milk production. different levels of methionine / leucine inclusion. As long as the amino acid requirement for milk protein 3.1. N balance in correlation with the amount of synthesis is not met, body protein is metabolised and
leucine and methionine at the duodenum and the N-balance is negative. If the amount of amino acid at
amount of N in milk the duodenum is higher than that required for milk
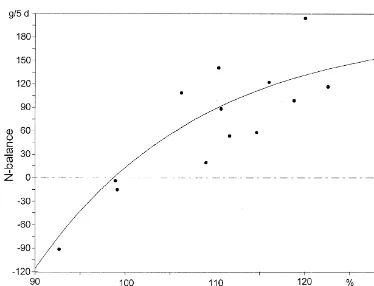
protein synthesis, if no other nutrient is limiting, and The amino acid supply at the duodenum as a result if there is still a capacity for body protein synthesis, of both rations and infusions was calculated and the then surplus will be stored as body tissue protein and results are given in Table 5 as a percentage of the the N balance will increase. Amino acids that cannot calculated requirement (Rohr and Lebzien, 1991) at be used for protein synthesis will increase the level the duodenum. The relations between the three of N excretion in the faeces and / or in the urine. parameters N balance, amount of amino acids at the Therefore, requirements for milk protein synthesis, duodenum and N in the milk are presented graphical- including the animal’s maintenance requirements, ly. These ‘‘dose–effect areas’’ for leucine and should be defined at zero N balance. Rulquin et al. methionine at various milk yields are shown in Figs. (1993) postulated that amino acid requirements are 1 and 2. A three-dimensional presentation was met ‘‘when milk protein responses are slightly below chosen to include all three parameters in one graph. the maximum attainable values’’.
Based on the results of the infusion trials, by The contour lines of the dose–effect areas, the interpolation, value-triplets for all (amino acid so-called ‘‘isoboles’’, are defined as the number of amount / N balance / N in the milk) combinations combinations with similar effects. Of special interest were calculated. The figures show a marked differ- are isoboles where N-balances are zero (‘‘zero-iso-ence in the proportionate partition of an increment of bole’’), because these curves describe, as explained
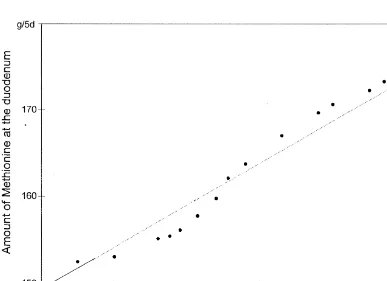
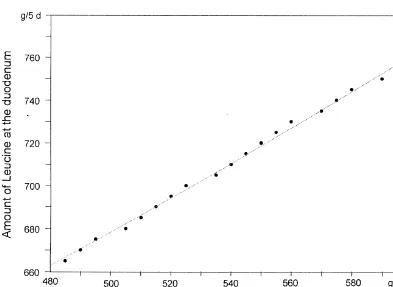
before, the actual amino acid requirements of the and Ørskov (1982) calculated a utilisation level of animal at the duodenum for a certain milk protein 80% for absorbed microbial amino acids. MacRae yield (Figs. 3 and 4). and Beever (1997) emphasised the relation of amino The points in Figs. 3 and 4 represent the amounts acid requirement to amino acid supply for its utilisa-of methionine / leucine at the duodenum, calculated tion.
from the relations shown in Figs. 1 and 2, giving a
zero N balance at milk protein yields ranging from 3.2. N-balance in correlation with the percentage 618 to 764 g per day. Higher or lower levels of of amino-acid supply
amino acids at the duodenum per g of milk protein
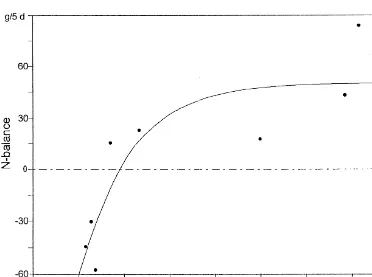
would result in positive or negative N-balances and The trials were based on the assumption that not in more milk protein, and would influence the supplying the animals with an amino acid amount of calculated efficiency of conversion of absorbed 100% of the estimated requirement would result in a amino acids into milk protein (Rulquin et al., 1993; zero N-balance if the estimated requirement is MacRae and Beever, 1997). correct. N-balances in relation to the amino acid Under the supposition that the concentrations of supply (as a percentage of the estimated requirement) methionine and leucine in milk protein are 2.5 and for methionine and leucine are given in Figs. 5 and 9.6%, respectively, and that the absorption rates of 6.
duodenal methionine and leucine are 80 and 87% From a statistical point of view, linear functions fit (Lebzien and Rohr, 1994), efficiencies of conversion nearly as well through the points as the chosen of absorbed amino acids into milk of 78 and 86% functions. The reason for using these sophisticated can be calculated. These values are quite high. Storm curves is that, in adult cows with limited milk
Fig. 4. Estimated amounts of leucine at the duodenum at different milk-N yields required for zero N balance.
production, N-balance cannot increase endlessly with vidual amino acids can therefore be calculated using increasing amino acid supply. There is, however, a split-requirement values for maintenance and milk limitation to this approach, namely, the method of yield, and the amino acid patterns of body protein, interpolation is likely to introduce an error of intestinal chyme and milk protein (Rohr and Leb-estimation, resulting from curvilinearity of the re- zien, 1991).
sponse, particularly when extrapolating beyond the
extremas of the range of data. 3.3. Estimations of leucine- and methionine It can be seen that, in the case of methionine, the requirements for lactating dairy cows
estimated requirement for a zero N-balance was too
high. Feeding the animals with 100% of the esti- In Table 6, methionine requirements, estimated by mated requirement (Rohr and Lebzien, 1991) for dose–effect curves (Fig. 3) and by N-balances (Fig. methionine resulted in a positive N-balance, imply- 5), are compared with factorial calculations of ing that the methionine requirement was overesti- methionine requirements.
Fig. 5. N-balances in relation to methionine supplementation (in %) of the estimated requirements (dairy cows).
more appropriate, as using this value produced the (1975). Literature data given by Rulquin et al. values derived using the N-balance method. How- (1993) varied between 31 and 52 g of methionine per ever, an absorption of 80% for the factorial calcula- day for a cow with a BW of 600 kg and that tion led to values that closely resembled the esti- produced 30–35 kg of milk.
mates of Rulquin et al. (1993). Rulquin et al. (1993) For leucine, an assumption of an intestinal absorp-stressed that, in the factorial approach, the choice of tion rate of 87% (Lebzien and Rohr, 1994) and an amino-acid composition of product, the absorption intermediary utilisation for milk production of 80% rate and the efficiency of utilisation largely de- seems to be appropriate (Table 7). In the literature, termines the final requirement values. estimated values for the intermediary utilisation vary Burroughs et al. (1975) reported a total between 60 (ARC, 1984) and 80% (GfE, 1986), methionine requirement of 30.8 g for a dairy cow values for absorption are 87 and 88% (Storm et al., with a BW of 550 kg and an average milk yield of 1983; Hvelplund and Hesselholt, 1987; Van Bruchem 30.0 kg / day (in that publication, calculations were et al., 1989; Lebzien and Rohr, 1994).
based on an average content of 3.2% milk protein). No endogenous N-losses were considered in that
¨
calculation, in contrast to Gunther (1987), who 4. Conclusion
reported an overall requirement of 36.0 g of
Fig. 6. N-balances in relation to leucine supplementation (in %) of the estimated requirements (dairy cows).
Table 6
Methionine requirement of dairy cows (600 kg BW) at the duodenum (g / day), established using three different methods
a
Milk (kg) Requirements at the duodenum according to
b
N-balances Dose–effect Factorial calculation correlations
Absorption580% Absorption590%
0.0 6.3 5.6 7.0 6.2
15.0 22.6 22.7 25.1 22.3
20.0 28.4 28.4 31.5 28.0
25.0 34.1 33.1 37.9 33.7
30.0 40.0 39.8 44.4 39.4
a
Protein-content of the milk53.0%.
b
Utilisation for milk production580%.
Table 7
Leucine requirement of dairy cows (600 kg BW) at the duodenum (g / day), established using three different methods
a
Milk (kg) Requirements at the duodenum according to
b
Absorption587% (Lebzien and Rohr, 1994) and utilisation for milk production580%.
Geiping, N., Menke, K.H., 1991. Bedeutung und Wirkungsweise
More research is needed to predict the supply of
¨ ¨
von Methionin in der Wiederkauerfutterung 2. Absorption und
individual amino acids to the duodenum within ¨
¨ ¨
Intermediarstoffwechsel. Ubers. Tierernahrg. 19, 133–156.
acceptable limits, to determine interactions between GfE, 1986. Energie- und Nahrstoffbedarf Iandwirtschaftlicher¨ supply and requirement at the duodenum, and the Nutztiere, Nr 3, Milch-und Aufzuchtrinder. In: Gesellschaft fur¨ effects of factors such as the genetic potential, age, Ernahrungsphysiologie der Haustiere, DLG-Verlag, Frankfurt /¨
stage of lactation and nutritional status of cows. Main, pp. 31–52. ¨
Gunther, K.D., 1987.DL-Methionine influences performance traits of dairy cows. Feedstuffs 59, 14–21.
¨ Hagena, F., 1985. Untersuchungen zum Einfluß eines ‘‘geschut-References
zten’’ Methionin-Supplements auf verschiedene
Leistungsmer-¨ ¨ ¨
kmale bei Milchkuhen. Dissertation agr., Universitat Gottingen. ARC, 1984. The nutrient requirements of ruminant livestock, Hvelplund, T., Hesselholt, M., 1987. Digestibility of individual Suppl. No. 1. Farnham Royal, Slough, Common. Agric. Bur. amino acids in rumen microbial protein and undegraded dietary Ayoade, J.A., Buttery, P.J., Lewis, D., 1982. Studies on protein in the small intestine of sheep. Acta Agric. Scand. 37,
methionine derivates as possible sources of protected 469–477.
methionine in ruminant rations. J. Sci. Food Agric. 33, 949– Hvelplund, T., Madsen, J., 1989. Prediction of individual amino 956.
acid passage to the small intestine of dairy cows from Black, A.L., Kleiber, M., Smith, A.H., Stewart, D.N., 1957.
characteristics of the feed. Acta Agric. Scand. 39, 65–78. Acetate as a precursor of amino acids of casein in the intact
Lebzien, P., Rohr, K., 1994. Bestimmung der wahren Verdaulich-dairy cow. Biochem. Biophys. Acta 23, 54–59.
¨ ¨ ¨
keit von Aminosauren aus dem Dunndarm von Milchkuhen.
¨ ¨
Brandt, M., Sudekum, K.H., Schroder, A., 1987. Zum Ausmaß der
Arch. Anim. Nutr. 45, 355–362.
¨ ¨ ¨
im Dunndarm von Milchkuhen verdauten Aminosauren. Z.
MacRae, J.C., Beever, D.E., 1997. Predicting amino acid supply ¨
Tierphysiol., Tierernahrg. u. Futtermittelkde. 58, 10–11.
and utilization in the lactating ruminant. Proc. Soc. Nutr. Burroughs, W., Nelson, D.K., Mertens, D.R., 1975. Evaluation of
Physiol. 6, 15–30. protein nutrition by metabolizable protein and urea
fermen-Naumann, K., Bassler, R. (Eds.). VDLUFA (Verband Deutscher tation potential. J. Dairy Sci. 58, 611–619.
Landvirtschaftlicher Untersuchungs- und Forschungs-anstat-Casper, D.P., Schingoethe, D.J., 1986. Evaluation of urea and
ten), 1976: Methodenbuch, Band III. Die chemische Untersuch-dried whey in diets of cows during early lactation. J. Dairy Sci.
ung von Futtermitteln. Verlag J. Neumann, Neudamm. 69, 1347–1354.
Rogers, G.L., McLeay, L.M., 1977. Responses of lactating cows Clark, J.H., Spires, H.R., Derrig, R.G., Bennink, M.R., 1977. Milk
to abomasal infusions of casein, methionine and glucose. Proc. production, nitrogen utilization and glucose synthesis in
lactat-N.Z. Soc. Anim. Prod. 37, 46–49. ing cows infused postruminally with sodium caseinate and
Rogers, G.L., Bryant, A.M., McLeay, L.M., 1979. Silage and glucose. J. Nutr. 107, 631–644.
dairy cow production. III. Abomasal infusions of casein, Downes, A.M., 1961. On the amino acids essential for the tissues
methionine and glucose, and milk yield and composition. N.Z. of the sheep. Aust. J. Biol. Sci. 14, 254–259.
J. Agric. Res. 22, 533–541. Fraser, D.L., Ørskov, E.R., Whitelaw, F.G., Franklin, M.F., 1991.
Rohr, K., Lebzien, P., 1991. Present knowledge of amino acid Limiting amino acids in dairy cows given casein as the sole
requirements for maintenance and production. In: Eggum, B.O. source of protein. Livest. Prod. Sci. 28, 235–252.
et al. (Eds.), Proc. 6th Int. Symp. Protein Metabolism and Geiping, N., Menke, K.H., 1989. Bedeutung und Wirkungsweise
¨ ¨ Nutrition, Denmark. EAAP-Publ. No 59, Vol. 1, 127–137. von Methionin in der Wiederkauerfutterung 1. Stoffwechsel
¨ ¨
`
limitants chez la vache laitiere par la methode des administra- Storm, E., Ørskov, E.R., 1982. Biological value and digestibility tions post-ruminal. Reprod. Nutr. Dev. 27, 299–300. of rumen microbial protein in lamb small intestine. Proc. Nutr.
´ ˆ ´ ´
Rulquin, H., 1992. Interets et limites dun apport de methionine et Soc. 41, 78 A.
´ `
de lysine dans l alimentation des vaches laitieres. INRA Prod. Storm, E., Brown, D.S., Ørskov, E.R., 1983. The nutritive value of Anim. 5 (1), 29–36. rumen microorganisms in ruminants. 3. The digestion of
´ ´
Rulquin, H., Pisulewski, P.M., Verite, R., Guinard, Jocelyne, 1993. microbial amino and nucleic acids in, and losses of endogenous Milk production and composition as a function of postruminal nitrogen from, the small intestine of sheep. Br. J. Nutr. 50, lysine and methionine supply: a nutrient-response approach. 479–485.
Livest. Prod. Sci. 37, 69–90. Van Bruchem, J., Bongers, L.J.G.M., Lammers-Wienhoven, SAS / GRAPH User’s Guide, Statistics. Aufl. 6.03, SAS Institute, S.C.W., Bangma, G.A., van Adrichem, P.W.M., 1989. Apparent Cary, NC. and true digestibility of protein and amino acids in the small Schwab, C.G., 1996. Amino acid nutrition of the dairy cow: intestine of sheep as related to the duodenal passage of protein Current status. Proc. 58th Ann. Meeting of the Cornell Nutri- and non-protein dry matter. Livest. Prod. Sci. 23, 317–327. tion Conference, Oct. 22–24, Rochester, NY, 184–198. Weidner, K., Eggum, B.O., 1966. Protein hydrolysis: A descrip-Schwab, C.G., Satter, L.D., Clay, A.B., 1976. Response of tion of the method used at the Department of Animal
Physi-lactating cows to abomasal infusion of amino acids. J. Dairy ology in Copenhagen. Acta Agric. Scand. 16, 115–119. Sci. 59, 1254–1270. Williams, C.H., David, D.J., Iismaa, O., 1962. The determination Spackmann, D.H., Stein, W.H., Moore, S., 1958. Automatic of chromic oxide in faeces samples by atomic absorption