3D MODELLING OF THE LUSATIAN BOROUGH IN BISKUPIN
USING ARCHIVAL DATA
D. Zawieska1, J. S. Markiewicz1,*, J. Kopiasz2, J.Tazbir1, A.Tobiasz1
1
Division of Photogrammetry, Remote Sensing and GIS, Faculty of Geodesy and Cartography,
Warsaw University of Technology, (d.zawieska, j.markiewicz)@gik.pw.edu.pl, (j.tazbir4, aleksandratobiasz777)@gmail.com 2
Archaeological Museum, Biskupin ([email protected])
Commission II
KEY WORDS: 3D modelling, Biskupin, site 4, pre-war photographs, structure from motion (SFM), archival data
ABSTRACT:
The paper presents the results of 3D modelling in the Lusatian Borough, Biskupin, using archival data. Pre-war photographs acquired from different heights, e.g., from a captive balloon (maximum height up to 150m), from a blimp (at a height of 50-110m) and from an aeroplane (at a height of 200m, 300 m and up to 3 km). In order to generate 3D models, AgiSoft tools were applied, as they allow for
restoring shapes using triangular meshes. Individual photographs were processed using Google SketchUp software and the “shape from shadow” method. The usefulness of these particular models in archaeological research work was also analysed.
1. INTRODUCTION
Site 4 in the Lusatian culture fortified settlement in Biskupin (north-western part of Poland) is situated on a peninsula, with an approximate size of 2 ha, the banks of which are lapped by the waters of Lake Biskupin on the north, east and west sides (Fig. 1a). This lake is one of a series of postglacial lakes located in the northern part of the Gniezno Lake District (Fig. 1b-c).
Figure 1: Location of Site 4 of the Lusatian culture fortified settlement in Biskupin: a) location on the map of Poland, b) current photographs of the site, c) pre-war photographs of the
site.
Archaeological work on Site 4 in Biskupin commenced in 1934. Well-preserved wooden relics of the settlement were discovered as early as the first season of the work. An area of approximately 1 ha (i.e., half of the settlement) was examined by the end of August 1939. Due to the lack of any complete documentation of the site (in particular, for the northern and central parts of the settlement, examined in the period 1934-1939; Fig.2), resulting mainly from the loss of documentation during World War II, as well as in connection with the limited possibilities to draw chronological and functional conclusions based on the archival plans of relics, new qualitative source data should be developed. After World War II, work continued until the beginning of the 1970s (Fig. 2).
Figure 2: The area of archaeological works carried out during the period 1934-1974.
2. METHODOLOGY OF 3D MODELLING
BASED ON ARCHIVAL DATA
Figure 3: Division of 3D modelling methods (Remondino, El-Hakim, 2006).
The authors of this paper present the short characteristics of algorithms applied in the 3D modelling process in the discussed research works.
2.1. 3D modelling based on SFM+MVS algorithms (AgiSoft Photoscan)
The processing of historical images is generally done with manual procedures, in particular the image triangulation and segmentation/classification steps (Nocerino, et al, 2012). During the process of historical aerial photos several errors might affect (Redecker, 2008, Nocerino, et al, 2012): a) inaccuracy or total lack of meta-information about inner orientation (focal length and coordinates of fiducial marks) and additional (i.e., distortion) parameters; b) missing specifications about the flight mission (especially flying height); c) poor radiometric image quality (haze, image darkness, non-uniform luminosity); d) distortions caused by roll and pitch due to sudden movements of the plane; e) improper transport or storage procedures of the film (humidity, temperature, etc.) and f) inaccurate processing of original films or hardcopies in field laboratories.
Photogrammetry (which is image-based) depends on the SFM approach, which is a combination of photogrammetric and computer vision methods. It is a fully automated 3D reconstruction technique, which refers to the simultaneous estimation of camera orientation, self-calibration and dense point cloud generation (Mousa, 2014). The image-based approach of an object reconstruction generally establishes correspondence between primitives extracted from a minimum of two (usually more) images. These corresponding primitives are converted into the 3D point cloud using the mathematical model. The main aspect connected with the image-based method is the possibility for image correlation, which is the most important issue during 3D reconstruction. Although this problem has been studied for more than 30 years, many problems still exist, such as the impossibility of completeness automation, occlusions, poor or untextured areas and repetitive structures (Remondino, 2008). In order to reduce the
positions or how many images to capture are required. According to Fraser (1996), Clarke (1998), El-Hakim (2003), Mousa (2014) and Remondino (2016), the factors to consider are as follows:
Base-to-depth ratio -Network accuracy increases with the increase of this ratio and when using convergent images, rather than images with parallel optical axes.
Number of captured images - Accuracy improves significantly with the number of images where a point appears. Measuring the point in more than four images, however, leads to less significant improvement.
Number of the measured point in each image -Accuracy increases with the number of measured points per image. However, the increase is not significant if the geometric configuration is strong and the points being measured are well defined (like targets) and well distributed in the image. In addition, this also applies to the utilized control points.
Image resolution (number of pixels) -For natural features, the accuracy improves significantly alongside the image resolution, while the improvement is less significant on well-defined, largely resolved targets.
2.2. Shape form shadow
In computer vision, the technique store cover shapes are known
as “shape from X” techniques, where X can be shading, stereo,
motion, texture etc. The “shape from shadow” (SFS) technique deals with the recovery of a shape from a gradual variation in the shading of the image. Artists have long exploited lighting and shading to convey vivid illusions of depth in paintings. To solve the SFS problem, it is important to study how the images are formed. A simple model of image formation is the Lambertian model, in which the grey level in the pixel of an image depends on the light source direction and the surface normal. In SFS, given a grey level image, the aim is to recover the light source and the surface shape for each pixel in the image. However, real images do not always follow the Lambertian model. Even if we assume the Lambertian reactance andknownlightsourcedirection,andifthebrightnesscanbedescribe dasa function of surface shape and light source direction, the problem is still not simple. This is because we have a linear equation with three unknowns if the surface shape is described in terms of the surface normal; if the surface shape is described in terms of the surface gradient, we have a nonlinear equation with two unknowns.
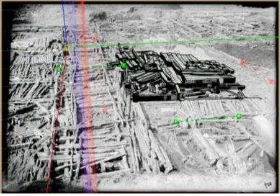
2.3. Shape projection using individual photographs
Elements which are determined during 3D modelling involving the use of a single photograph (Fig. 4):
Vanishing point bar - two green bars and two red bars with dashed lines and a square grip at each end. You click and drag the grips to align these bars with elements in your photo.
Horizon line - This yellow line aligns with the horizon in your model. Typically, if you set the vanishing point bars, the horizon line takes care of itself.
Axis bars - The solid green, red and blue lines represent each axis.
Axis origin - The origin is where the three axes meet.
Sketch Up is also equipped with Match Photo function which enhance the process of 3D reconstruction by enabling the user to easily draw a wireframe or block model. After the raw model is acquired, it should be rescaled based on real dimensions.
3. CHARACTERISTICS OF SOURCE DATA
The high quality of pre-war photographic documents is a result of the professional technical and organizational facilities organized by the Biskupin Expedition from 1934 to 1939, as well as the involvement of Polish military assets for this purpose. Selected archival photographs from about 800 photographic plates were used to meet the needs of the discussed examinations; they were scanned with a resolution of 3,200 dpi. A group of photographs acquired from various heights was selected (an aeroplane, a barrage balloon, an observational balloon and terrestrial photographs; Fig. 5). In addition, vector data processed during archaeological works (scale 1:10) were also utilized.
Figure 5: Archival photographs: a) nadir and oblique photographs acquired from a balloon, b) low-height aerial photographs, c) terrestrial photographs acquired from a portable platform or a ladder and d) photographs of details acquired from
the terrain surface.
4. METHODOLOGY OF PROCESSING ARCHIVAL PHOTOGRAPHS
During the first stage of processing, photographs selected for the purpose of the 3D modelling of the fragment of the borough were radiometrically corrected. This was caused by the differences in the radiometric quality of photographs, which originated from various periods and which were acquired under different illumination conditions. Additionally, the quality of some photographs was reduced due to the storage conditions that existed during the war; indeed, some photographs were destroyed (Fig. 6).
Figure 6: Examples of the radiometric correction of the selected photographs.
After consulting with an archaeologist, the methodology used to process the photographs was assumed. It was agreed to develop three types of 3D approach with the use of three different methods of model generation:
I) 3D model using SfM+MVS (AgiSoft Photoscan)
Figure 7: 3D model of a fragment of the fortified settlement in mesh form.
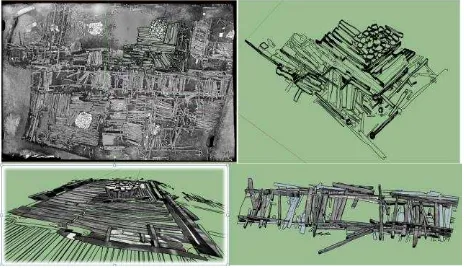
II) A wire-frame model resulting from the processing of individual photographs (SketchUp)
Figure 8: A wire-frame model of: A-C) a fragment of the main room of a residential farm building, D) main road developed
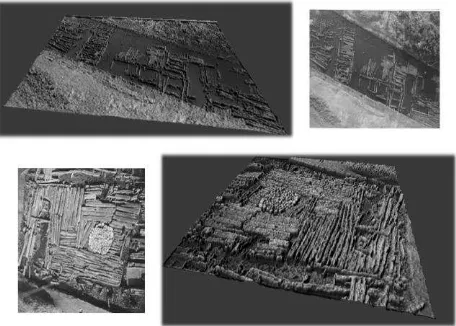
III) 3D visualization using the SFS method (Blender)
Figure 9: 3D visualization of a fragment of the fortified settlement developed using Blender tools.
Each of the developed models was used for multi-criteria spatial analyses in order to verify hypotheses formulated by the archaeologist. The model I (Fig. 7) used to generate trueortho images in order to carry out large area spatial analyses allowed for verifying the development and functions of the borough. Model II (Fig. 8) was used for detailed analyses of the constructions of particular objects, taking into account the materials, dimensions and functionality of analysed structures. As Model III (Fig. 9) is a non-metric model, it was used for the preliminary evaluation of the methods of construction of particular objects in the borough. Results of the discussed analyses allowed us to differentiate and divide the fragments of particular structures with consideration to the periods of construction.
5. THE USE OF 3D MODELS IN ARCHAEOLOGY
The Lusatian Borough belongs to a group of archaeological
2015). Interpretation difficulties concerning the borough’s
development and the chronology of discovered relics also result from the overlapping of elements, which originating from the earlier phase involving older relics. Weaknesses in the drawn documentations are exacerbated by irrecoverable losses of the documentation of archaeological cross sections during World War II (Rajewski, 1950, Kopiasz, 2015). A separate collation of plans, which could project particular levels of constructions regarding the earlier or later phases, has not been pursued (with the exception of borough fragments investigated after the war; Kopiasz, 2015). As a result, elements originating from two different chronological phases are sometimes visible on one drawing, without appropriate descriptions.
Due to the use of different methods of photographic
acquired before the war was created; they highlighted large areas for investigation, as well as elements of construction. In connection with the project, “The design for the development of the Lusatian culture borough on Site 4 at Biskupin: pre-war
research work”, whose beneficiary is the Archaeological
Museum at Biskupin (AMB), a considerable amount of photographic documentation concerning Site 4, distributed among three institutions (with the exception of photographic films from the AMB, the majority of acquired scans originated from the State Archaeological Museum in Warszawa, while photographs from the Archaeological Museum in Poznan have not been scanned) was scanned and processed as an element of the developed GIS database.
Recent developments in digital technologies have led to the possibility of utilizing the resources of archival photographs as a method of wide-ranging, functional and operational analyses. This process, among others, consists of the determination of the most probable construction of residential and farm buildings and their expanse (Kopiasz, 2016).During the analysis, relics from the borough, which originated from the earlier and later phases, should be also distinguished (Kopiasz, 2015; 2016).
The proposed digital technologies applied to the set of pre-war photographs from Biskupin are based on several photogrammetric technologies. With regard to the use of the Blender application, images generated in the form of a realistic land cover map are applied (Fig.9). This technology allows for better recognition of the relative chronology of a greater number of structures than in the case of the analysis of the photograph. Photographs from Biskupin are characterized by certain limitations resulting from the use of analogue equipment in grey levels. This sometimes led to the insufficient resolution of films, which explains why background areas are unreadable and why the relative chronology cannot be explicitly assigned to relics, which are located further away. There are also difficulties with regard to those images, which present big areas under small angles, from the terrain surface. This comment should not be considered as reflecting the weakness of pre-war
photographs, given that, as “primary” documentation, they
present certain features, which are more readable; for example, the highly visible rectangular shadow on half of the width of the wall foundation of one of the buildings proves the presence of an opening in this location, which initially served as a setting for a constructional pole. The lack of this detail in the drawn documentation stresses the exceptional importance of pre-war photographs from Biskupin.
One important advantage of the discussed technology is the possibility to perform chronological analyses (selection of older and younger elements) based on different shots under different angles (with some limitations) and from different directions. The additional advantage of the software is the possibility to create views by means of appropriate settings and their modifications using the software tools. The advantage also concerns the even image quality, which is independent from the magnification scale. When summarizing, it may be stressed that this technology is highly useful for the chronological analysis of areas, which were not documented with close “oblique” shots from the terrain surface or from a platform.
insights in relics from different directions and sides (the orbit option), but also perform measurements. As mentioned, levelling data concerning the levels of deposits of relics are not assigned to a considerable part of the drawn documentation from Biskupin. The discussed technology allows for the elimination of this disadvantage. Moreover, images generated using this technology provide the source information for the introduction of some corrections to the drawn documentation. For example, vertical structures are visible in the generated image, which are not marked in the drawn documentation (as a result of the schematic drawing of rings of trees- a cross section of a constructional pole in this case). Other examples include horizontal structures, which, according to the drawn documentation, participate in stratigraphic relations with other elements (other than in the case of images generated using the SketchUp application). The use of this method is highly recommended for areas of research into complex systems of structures originating from different phases (Kopiasz, 2015). It should be added that, in such cases, an archaeologist using the drawn documentation is only capable of distinguishing the chronology of structures, which are connected in a whole. In the case of Biskupin, this concerns the bottom parts of the walls, the expanse of which is determined by poles and horizontal balks between them or embedded in them.
Moreover, similar to Site 4 at Biskupin, this technology allows for the determination of events, which are not the results of human activities. This may point to the possibility of determining the thickness of flood deposits, which proves that the flood bank interior was destroyed by the natural forces on several occasions (the bank was broken at least two times as a result of the raised water level in Biskupin Lake during the Early Iron Age).
6. FINAL REMARKS
A set of photographic plates was used, among others, to develop 3D spatial models of relics of the borough, which were required for multi-criteria analyses. Finally, there are plans to apply these models in order to develop the HGIS spatial database. This database will store, among other items, scanned photographs, digital surface models, vector documentation and images generated using photogrammetric techniques. Designed and developed modules of the GIS database will allow for the display of objects generated at the stage of the virtual reconstruction of relics from the borough. This stage is connected with the appropriate development of the methodology for the virtual reconstruction of historical objects. The integration of photographic documentation and the unification of its scale will allow for a better understanding of construction as a whole, and for the recognition of particular structures with consideration to functional and chronological aspects in particular.
ACKNOWLEDGEMENTS
The research discussed in this paper was performed as part
of “The design for the development of the Lusatian culture
borough on Site 4 at Biskupin: pre-war research work” project, which is financed by the Ministry of Culture and National
El - Hakim, S.F., Berladin, J.A., Blais, F., 2003: Critical factors and configurations for practical 3D image-based modeling. In: VI Conference on Optical 3D Measurement Techniques, Zurich, Switzerland, pp. 159 - 167.
Fraser, C.S., 1996: Network design. Photogrammetry and Machine Vision. Whittles Pub, pp.256-281.
Moussa, W., 2014: Integration of Digitall Photogrammetry and Terrstrial Laser Scanning for Cultural Heritage Data Recording. Verlag der Bayerischen Akademie der Wissenschaften in Kommission beim Verlag C.H.Beck, Studgart, Germany.
Kopiasz, J., 2015: Archive documentation of the settlement from the Early Iron Age on site 4 in Biskupin and its digital integration. The Biskupin report, Biskupin IV, pp. 53-101.
Rajewski, Z.A., 1950: Report on the organization of work in
Biskupin in the area. Żnin in years 1938/1939 i 1946/1948. III Report on the excavations in the city of Lusatian culture in
Biskupin Żnin in the district for years 1938-1939 and 1946-1948, pp. 1-16
Redecker, A.P., 2008: Historical aerial photographs and digital photogrammetry for impact analyses on derelict land sites in human settlement areas. Int. Archives of Photogrammetry, Remote Sensing and Spatial Information Sciences, Vol 37(B8), pp. 5-10
Nocerino, E., Menna, F., Remondino, F., 2012: Multi-temporal analysis of landscapes and urban areas. Int. Archives of Photogrammetry, Remote Sensing and Spatial Information Sciences, Vol. 39(4), pp. 85-90
Remondino, F, El-Hakim, S.F., 2006: Image-Based 3D Modeling: A Review. The Photogrammetric Record, Vol. 21 (115), pp 269-291
Remondino, F., Menna, F., 2008: Image-based surface measurement for close-range heritage documentation. Int. Archives of Photogrammetry, Remote Sensing and Spatial Information Sciences, Vol 37(B5), pp. 199 - 2006.
Saharna, A., 2008: Projected Texture For 3d Object Recognition, https://cvit.iiit.ac.in/images/Thesis/MS/avinash SharmaMS2008/AvinashSharmaThesis2008.pdf (20. Jan. 2017).