DEVELOPMENT AND EVALUATION OF TECHNOLOGY EDUCATION
USING EARTH OBSERVATION TECHNIQUE
Y. Ito a, *, Y. Teramoto b, K. Abe b a
Graduate School of Education, Naruto University of Education, 748 Takashima, Naruto City, Tokushima
772-8502, Japan - [email protected]
b
Ateral, Inc., 309 Tokushima Science Center 209-5, Hiraishi-Sumiyoshi, Kawauchi, Tokushima City,
Tokushima 771-0134, Japan - (tera, abek)@ateral.com
Commission VI/4
KEY WORDS: Technology, Education, SAR, Image, Software, System
ABSTRACT:
In the present study, we introduce to secondary education an Earth observation technique using synthetic aperture radar (SAR). The goal is to increase interest in and raise the awareness of students in the Earth observation technique through practical activities. A curriculum is developed based on the result of questionnaire surveys of school teachers. The curriculum is composed of 16 units. Teaching materials related to the Earth observation technique are researched and developed. We designed a visual SAR processor and a small corner reflector (CR) as a new teaching technique. In teaching sessions at secondary school, the developed teaching materials and software were used effectively. In observation experiments, students set up CRs that they had built, and ALOS PALSAR was able to clearly observe all of the CRs. The proposed curriculum helped all of the students to understand the usefulness of the Earth observation technique.
* Corresponding author.
1. INTRODUCTION
Recently, global environmental problems, such as global warming and deforestation, have been attracting attention, and many schools are teaching students about such issues. However, Earth observation techniques have not been adequately investigated, and it is necessary to develop a more practical education program that includes observation experiments using sensors on artificial satellites.
In the present paper, we introduce to secondary education an Earth observation technique using synthetic aperture radar (SAR), which is not easily influenced by observation time or weather conditions. The goal is to generate interest in learners and raise awareness for Earth observation techniques through practical activities. A teaching program and materials for the Earth observation technique are researched and developed. We herein design a visual SAR processor and a small corner reflector (CR) from an educational point of view as new teaching materials. The developed educational tools are evaluated in a classroom environment.
2. TEACHING PROGRAM
2.1 Planning of teaching program
Technology education using an Earth observation technique involving SAR was investigated by questionnaire surveys submitted to secondary school teachers. The learning contents were chosen based on the results of the surveys. The primary contents are as follows:
(1) Introduction of the Earth observation technique. (2) Basic observation method by SAR.
(3) Design and production of CR as a ground target. (4) Observation experiment using SAR and CRs.
(5) Browsing Earth observation images. (6) Processing SAR data and analyzing images.
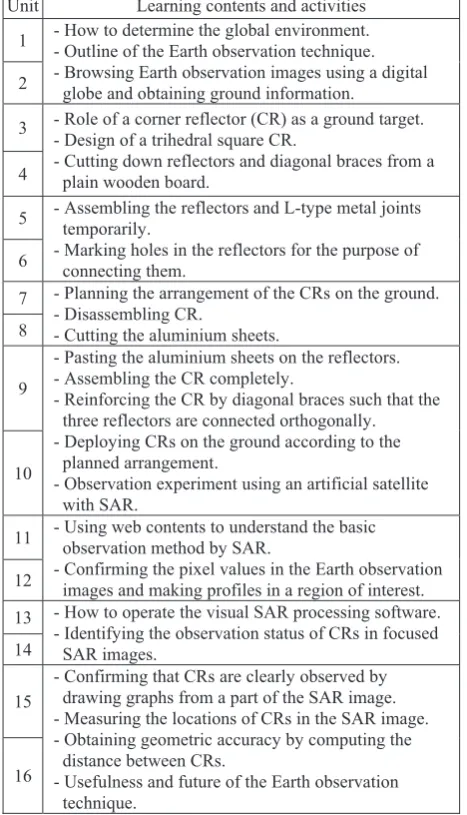
The planned teaching program including the practical activities is composed of 16 units. One unit is implemented in 50 minutes. Table 1 lists the learning contents and activities in this program. 2.2 Teaching materials
In the present study, a high-speed digital communication line connected to the Internet and more than 40 personal computers (PCs) were made available to the students at a secondary school in Japan. In consideration of the present school information system, the following software is adopted in the planned curriculum.
(1) Digital globe
As a digital global map, “Google Earth” is useful for studying geographical themes. Google Earth provides for free a huge number of Earth observation images observed by optical sensors.
(2) Web contents
Web contents (http://www.eorc.jaxa.jp/hatoyama/experience/ kids/) provided by the Japan Aerospace Exploration Agency (JAXA) are used to study the basics of the Earth observation technique. Original web contents are also used to introduce the basic observation method by SAR.
(3) Software
A visual SAR processor specialized for educational use is newly developed. The visual SAR processor is described in detail in Section 3. A spreadsheet with a help program is also used to confirm the pixel values in Earth observation images and to make profiles in a region of interest.
(4) Corner reflector
A small CR with a relatively large backscatter is designed in consideration of the skills, time, and ability to set up ground targets of the learners. A trihedral CR is adopted in order to achieve wide tolerance of installation angles for strongly reflecting radar signals (Bhattacharyya, 1991). A square panel is chosen as the reflector in order to increase the radar cross section (RCS) beyond that of a triangular reflector. Figure 1 shows the structure of the adopted CR. The panel is a wooden board attached to a thin aluminum sheet. Three square reflectors are connected orthogonally by L-type metal joints and diagonal braces. The square panels and the diagonal braces are cut from a flat wooden board, such as a piece of plywood. Worksheets on the design and production of the CR are also compiled in consideration of the knowledge and skills of the learners. The square reflector has sides of 0.8m. Generally, the maximum RCS of the trihedral square CR can be computed as 12Sa4/O2, where a and O denote the side of the square panel and the radar wavelength, respectively. Since the CR is too small to compute the maximum RCS for an L-band SAR, such as PALSAR, a model of the CR is designed on a simulation grid and the
finite-difference time-domain method is applied to the model (Taflove, 2005). As a simulation result, the maximum RCS of the CR is
Vmax=21.6dBm2, where O=0.236m. In preliminary experiments using PALSAR (FBS and FBD modes), the deployed CRs in a flat area with low-density vegetation were able to be clearly identified in these SAR images.
3. VISUAL SAR PROCESSOR
3.1 Concept
The learners are assumed to have little expertise in advanced mathematics and signal processing. In order to enable these users to work with Earth observation data on standard PCs, it is necessary to develop specially treated software that can process SAR data. The software must take into consideration the following requirements:
(1) Intermediate complex data generated by focusing the raw SAR data must be displayed as a set of grayscale images. (2) User-friendly GUI and intuitive operation methods are
key functions.
(3) A simple operation that allows the learner to understand the procedure at a glance is necessary.
(4) Complex file management is implicitly processed in a server computer.
(5) Appropriate parameters are automatically provided each time data is processed.
An efficient display methodology is also necessary from an educational viewpoint. The system must be able to show that the basic SAR technique is similar to a hologram by including numerous overlapping zone plates in the raw SAR data. In the case of focusing SAR data using the range-Doppler algorithm, the difference between a range-compressed image and an azimuth-compressed image can be easily identified. The processing history can be investigated by retrieving intermediate data from the server individually. The display area of the image can quickly be shifted and zoomed in/out using a PC mouse with a wheel. Icons arranged on the tool panel follow a processing procedure of the SAR data.
The learner does not need to know commands for the SAR processing in advance, and processing is started simply by clicking the corresponding icon. Since all intermediate data Table 1. Teaching program with Earth observation technique.
Unit Learning contents and activities 1 - How to determine the global environment.
- Outline of the Earth observation technique. - Browsing Earth observation images using a digital
globe and obtaining ground information. 2
3 - Role of a corner reflector (CR) as a ground target. - Design of a trihedral square CR.
- Cutting down reflectors and diagonal braces from a plain wooden board.
4
5 - Assembling the reflectors and L-type metal joints temporarily.
- Marking holes in the reflectors for the purpose of connecting them.
6
7 - Planning the arrangement of the CRs on the ground. - Disassembling CR.
- Cutting the aluminium sheets. 8
9
- Pasting the aluminium sheets on the reflectors. - Assembling the CR completely.
- Reinforcing the CR by diagonal braces such that the three reflectors are connected orthogonally. - Deploying CRs on the ground according to the
planned arrangement.
- Observation experiment using an artificial satellite with SAR.
10
11 - Using web contents to understand the basic observation method by SAR.
- Confirming the pixel values in the Earth observation images and making profiles in a region of interest. 12
13 - How to operate the visual SAR processing software. - Identifying the observation status of CRs in focused
SAR images. 14
15
- Confirming that CRs are clearly observed by drawing graphs from a part of the SAR image. - Measuring the locations of CRs in the SAR image. - Obtaining geometric accuracy by computing the
distance between CRs.
- Usefulness and future of the Earth observation technique.
Hole for metal joint
Diagonal brace
Figure 1. Structure of a trihedral square CR. Plywood
generated with the reference file name are automatically stored in the server, operation of a complicated file management system is not necessary. In this way, it is possible to concentrate on just the processing results without having to learn about the file management system. There are several types of parameters in the SAR data processing, and it is necessary for these parameters to be set appropriately. In this system, following each procedure, the appropriate default values are included in the dialog for the setting of the parameters. The default parameters can be easily fine-tuned.
The visual SAR processing system must be newly developed in
consideration of the specifications of the learner’s computer.
The server processes the SAR data and stores all of the intermediate data. Special software, other than a standard web browser, is not used by the client PC. Thus, this system, which adopts Ajax technology, is composed of a rich Internet application that requires minimal communication between the web server and clients (Ito, 2008; Ito, 2010).
3.2 System structure
The system of the developed visual SAR processor has three software components: the SAR server, the HTTP server, and a web browser for client computers. The HTTP server and the web browser work together under Ajax technology (Crane, 2005). The SAR server is the primary component for managing users and SAR data sets by relational database management system and for processing all SAR data sets. The SAR server has managers for the user, the data, processor, and the image display. The data manager accesses both the SAR and the user databases indirectly through open database connectivity (ODBC).
An antenna-pattern data file is shared in all SAR data with the same sensing mode. The processor manager invokes the SAR processor to focus the raw SAR data by the range-Doppler method. The SAR database can manage the processing parameters, the calibration data, and all of the raw, range-compressed, single/multi-look complex, map-projected images. The image displaying manager provides complex data layers to overlap and display multi-temporal, frequency, interferometric and polarimetric SAR data images. The processed images can be shown using more intuitive and interactive methods by the image displaying manager and the image manipulator.
3.3 System specifications
The range-Doppler method focuses on the two-dimensional raw SAR data by carrying out one-dimensional pulse compression sequentially in the range and azimuth directions (Cumming, 2005). In the compression procedure, the user can set various options for the image quality and the processing time. Range compression has options for the range throwaway region, the DC bias, the imbalance between the in-phase and quadrature-phase signals, the number of FFT points, the window function, interference noise reduction, automatic gain control, secondary range compression, and antenna-pattern correction. Similarly, azimuth compression has options for resolution in the azimuth direction, azimuth and range throwaway regions, average terrain height, the number of interpolation points for correcting range cell migration, the number of FFT points, the window function, the number of azimuth looks, and the rate of adoption of the effective azimuth compressed region. The SAR image is processed by applying official time offsets for both the range gate and the state vector.
The orthorectified and map-projected image is generated from an image with slant range spacing according to the specified projection, the digital elevation model (DEM), and the geoid model. The SAR processor compensates for geometric and radiometric distortion based on the antenna-pattern, the local incidence angle, and the duration of the synthetic aperture time, and by applying a window function in FFT and eliminating interference noise. The radar brightness and backscatter coefficients (E0, V0) of a specified region in the SAR image are transferred to the client computer for investigating the scattering process and radiometric calibration. The RCS of the target is estimated by integrating a set of E0 with a calibration tool. The geometric calibration is carried out by using the ground control points and the corresponding locations in the SAR image. The results of the geometric calibration indicate the location errors in both the range and azimuth directions. In the user interface of the visual SAR processor in the client computer, the web browser displays an operation window consisting of the view area, a scene selection tab, a tool panel, and scroll bars in the range and azimuth directions. The user can process the SAR data using the tool panel with various icons and indicators. The raw SAR data provided by ERS-1/2 AMI, Radarsat-1 SAR, JERS-1 SAR, and ALOS PALSAR are applicable. For the map projection and the geometric calibration, one of the DEMs (SRTM-3, ASTER GDEM, GSIDEM50) and one of the geoid height models (EGM96, GSIGEO2000) can be employed. GSIDEM50 and GSIGEO2000 represent digital maps with a 50-m grid (elevation) and a 2-km grid (geoid), respectively. These data are provided by the geospatial information authority of Japan.
3.4 Operation and processing examples
First, the user specifies the URL of the SAR server in the web browser and enters a user name and a password. After authentication is performed, an initial catalogue of the SAR data is listed. Each row in the catalogue displays a thumbnail icon, a scene ID, an identification name, an area description, path and row numbers, the observation date/time, and the last used date/time. The list can be individually sorted by each item. A full-text search using arbitrary keywords and an advanced search are implemented. The advanced search is executed by specifying options such as the sensor name, the instrument name and type, the scene ID and name, the path and row numbers, the flight path direction, polarizations, the data provider, the processing level, and the observation location in latitude and longitude. Detailed information used for the acquisition and the calibration is also shown. After selecting the target SAR data from the catalogue, a quick-look image is displayed. The processing region is specified in this image as a rectangular area.
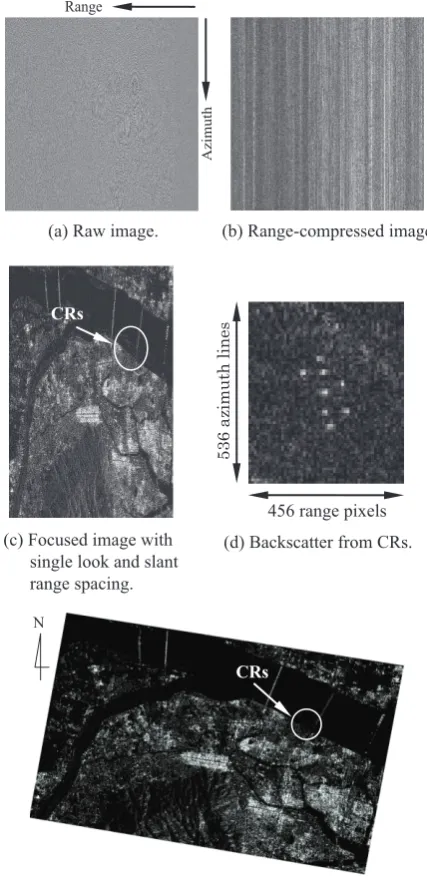
Figure 2 shows processing examples of the ALOS PALSAR data. The cropped raw SAR data are shown as a grayscale image with the slant range spacing converted from the complex data in Figure 2(a). The brightness and contrast of the grayscale image in the view area is automatically adjusted by the average and standard deviation computed from the source SAR data. A number of zone plates are confirmed in the raw SAR image and abnormal signals over a wide range can be easily identified. Next, the range compression is applied with options. In Figure 2(b), the range-compressed image with the slant range spacing is shown as the grayscale image converted from the floating-point complex data. Several lines along the range cell migration
appear in the range-compressed image. The azimuth compression is applied to the range-compressed image in the same manner. The focused image with the slant range spacing is shown in Figure 2(c). The well-focused image clearly represents backscatter from CRs on the ground surface, as shown in Figure 2(d).
In the post processing, the image with slant range spacing is re-sampled according to the specified ground resolution, map projection, and DEM, and the geoid model. Figure 2(e) shows the map-projected image generated from the image in Figure 2(c). The foreshortening caused by the ellipsoidal height is corrected in this image. The procedure requires the location and the value of each pixel in the SAR image. The mouse cursor can be pointed at the pixel to display the information in real time. After selecting the investigation area, the data file including the partial SAR image is transferred from the SAR server to the client computer. The data file is used to make profiles and to integrate the amount of backscatter around the target.
4. TEACHING PRACTICES
4.1 Outline
The teaching program was carried out twice in accordance with the research schedule. The first teaching session was carried out at a secondary school attached to Naruto University of Education in 2007. This session followed the teaching program, but did not use the spreadsheet in Table 1. Group study was adopted in order to promote mutual cooperation. Each group produced and set up a single CR. The second teaching session was carried out at the same school in 2008. This teaching session followed the teaching program, excluding units 3 through 10 in Table 1. A total of 16 students in the third grade of secondary school participated in the second teaching session. Questionnaire surveys on the Earth observation technique were carried out before and after the teaching session in order to evaluate the effectiveness of the proposed curriculum. The students evaluated themselves with respect to the learning contents after each class.
4.2 Results of teaching practices
The students first discussed how to deal with the global environmental problem. They noticed that it was important to know a state of the Earth surface. The Earth observation images
in various regions were easily obtained using “Google Earth”
digital globe software. The students recognized importance of the Earth observation technique as a method for viewing the global environment. They also learned the basics of Earth observation using an artificial satellite through web contents provided by JAXA. They learned the characteristics of both passive and active sensors and were very interested in active sensor mechanisms, such as the SAR, which enabled high-resolution ground information to be obtained without sunlight. Next, the teacher asked the students to set up an object reflecting electromagnetic waves strongly on the ground in order to explain the observation technique using the SAR. The teacher presented an example of the target. The CR was produced in each group according to the observation schedule by ALOS PALSAR. The students had experience in cutting wooden boards from a previous study. Activities of making and cutting out wooden parts from a board following the worksheets were done skillfully. A double-edged saw and an electric
drill/driver machine were used in the production. Figure 3(a) shows the students making holes in the reflectors. They pasted thin aluminum sheets onto each reflector (Figure 3(b)). The CR was assembled using three square reflectors, nine L-type metal joints, and three diagonal braces, as shown in Figure 3(c). In the first teaching session, observation experiments were carried out on 14 and 15 November 2007. The CRs were observed by PALSAR using the FBS mode on both ascending and descending orbits. The CRs were set up in the riverbed of the Yoshino River, Tokushima, Japan. The area was almost flat and had little vegetation at that time. It was located within a five-minute walk from the school. All of the students
(a) Raw image. (b) Range-compressed image.
(e) Map-projected image (Size: 9.5 km u 6.8 km, Projection: UTM, GSIDEM50, GSIGEO2000).
© METI and JAXA Figure 2. Processing examples of ALOS PALSAR data
(Scene ID: ALPSRP096272930, Descending orbit, Off-nadir: 34.3°, Mode: FBS, Polarization: HH, Date: 15 Nov. 2007, Scene center: 34.082047° N, 134.539266° E, Tokushima, Japan).
(c) Focused image with single look and slant range spacing.
CRs
CRs
(d) Backscatter from CRs.
N
456 range pixels
536 az
im
ut
h li
nes
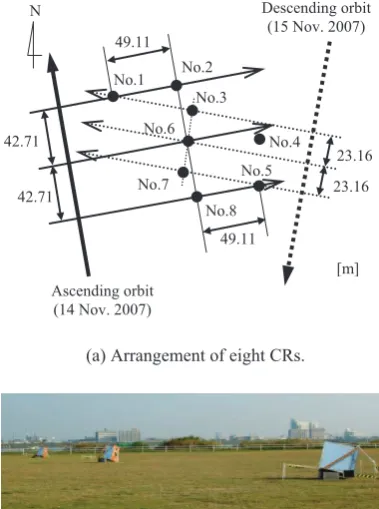
cooperated in setting up the CRs. The radar incidence angles of both the azimuth and range directions were adjusted to maximize the power of reflection. After the observation experiment of 14 November, all the CRs were horizontally rotated by approximately 160 degrees. A total of eight CRs (Nos. 1 through 8), including three CRs (Nos. 6 through 8) produced by the students, were deployed at the riverbed according to the arrangement shown in Figure 4(a). Figure 4(b) shows the deployed CRs and the ground condition on 15 November 2007. Three CRs (Nos. 2, 6, and 8) have the same range length, and two pairs of CRs (Nos. 1 and 2) and (Nos. 5 and 8) are on the same azimuth lines in the ascending orbit. Similarly, three CRs (Nos. 3, 6, and 7) have the same range length, and two pairs of CRs (Nos. 1 and 3) and (Nos. 5 and 7) are on the same azimuth lines in the descending orbit.
A total of four servers processed the visual SAR processor with the same SAR data in order to reduce the processing time. Up to three students were able to use a single server simultaneously. The laptop computers were connected to the processing server through a wireless LAN. The SAR data was smoothly processed and displayed in the browser. The students acquired operation skills of the visual SAR processor without difficulty by referring to the user manual. The SAR images were generated according to the procedure, as shown in Figure 2. In order to investigate the characteristics of the SAR images, the teacher reported that the longest suspension bridge, the Akashi Kaikyo Bridge, the length of which is approximately 4km, was observed as a diamond shape. A student immediately noticed that the primary reason for this was the multi-pass effect caused by the single reflection from the wire rope only and the double reflection from the wire rope and the sea surface.
The SAR data with reflection signals from the CRs was focused as shown in Figure 2(d). The students found the pixels corresponding to the CRs in both the focused and
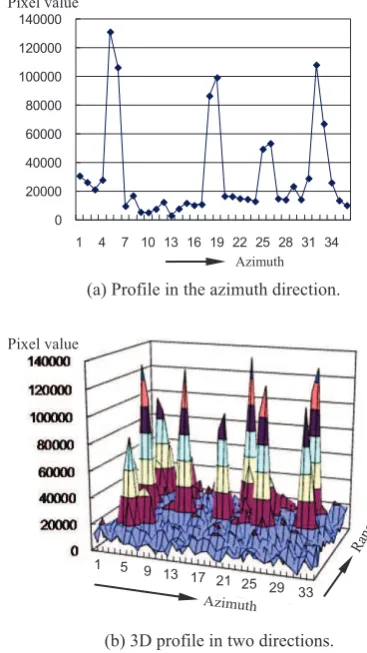
map-projected images. Eight cross points corresponding to each CR were clearly identified in Figure 2(d). The amount of backscatter and the locations of the CRs were obtained from the information of the corresponding cross points. As expected, three CRs (Nos. 2, 6, and 8) had the same range length, and two pairs of CRs (Nos. 1 and 2) and (Nos. 5 and 8) were on the same azimuth lines. When the ascending orbit was used, a similar result was obtained. The numerical data set of the small rectangular region including the eight CRs in the SAR image was retrieved to the client computer by the students. The students were able to make profiles in both range and azimuth directions around the CR by using the spreadsheet and the transmitted numerical data file, as shown in Figures 5(a) and 5(b). The location of each CR was surveyed by the cross point in the SAR image. The distance between the CRs was measured by the locations and the ground pixel size. The difference between the measured distance and the actual distance indicated in Figure 4(a) was small. Finally, the students discussed the usefulness and the future of the Earth observation technique. 4.3 Evaluation
Each student scored the questions about the learning contents in the questionnaire with a score of from 1 to 5. Table 2 shows the average scores before and after the teaching sessions. The average scores in the upper and lower rows are the evaluation results for the first and second teaching sessions, respectively. The evaluation results for the common learning contents indicated a similar tendency. The average scores after teaching were higher than those before teaching for all of the learning contents, excluding the global environmental problem and the notation for the locations on Earth. The score for the Earth observation technique increase remarkably. On the other hand,
(c) Assembling the CR.
(a) Making holes. (b) Pasting aluminium sheets carefully.
Figure 3. Students producing CR.
(b) Deployed CRs and ground condition. Figure 4. Observation experiment at the riverbed of Yoshino
river, Tokushima, Japan. Ascending orbit
(14 Nov. 2007)
Descending orbit (15 Nov. 2007)
(a) Arrangement of eight CRs. No.1 No.2
No.3
No.4
No.5 No.6
No.7
No.8 49.11
[m] 49.11
42.71
42.71
23.16
23.16 N
the score for the global environmental problem decreased for the first teaching session. The reason for this is thought to be that the Earth observation technique was dealt with as the primary topic in all units.
In order to investigate the learning process in the first teaching practice, the questionnaire conducted after the class included two evaluation points: the production of the CR and the understanding of the Earth observation technique. By investigating the learning process, the students were able to become familiar with the CR by building several CRs. In addition, the students expressed interest in and understood the Earth observation technique after the teaching sessions. Moreover, the Earth observation technique was further clarified by processing the SAR data using the reflection signals obtained from the CRs produced by the students.
5. CONCLUSIONS
A curriculum was developed to explain the Earth observation technique using the SAR on an artificial satellite. In teaching sessions at a secondary school, new teaching materials and software were used effectively. In the observation experiments, the learners set up ground targets that they had built, and ALOS PALSAR was able to observe all the targets. As a result, the students were able to understand the usefulness of the Earth observation technique.
In the future study, we would like to introduce a more sophisticated Earth observation technique, such as interferometric, polarimetric, and scan SAR, to technology
education. The functions of the visual SAR processor must be enhanced according to the teaching practices as well.
ACKNOWLEDGEMENTS
The present research was supported in part by a Grant-in-Aid for Scientific Research (C) (No. 18500668) from the Ministry of Education, Culture, Sports, Science and Technology of Japan. The SAR data obtained by ALOS PALSAR were provided under the second ALOS research announcement program of JAXA.
REFERENCES
Bhattacharyya, A. K., Sengupta, D. L., 1991. Radar Cross
Section Analysis and Control. Artech House, USA, pp.115-139.
Cumming, I. G., Wong, F. H., 2005. Digital Processing of
Synthetic Aperture Radar Data. Artech House, USA,
pp.225-282.
Crane, D., Pascarello, E., James, D., 2005. Ajax in Action. Manning Publications.
Ito, Y., Teramoto, Y., Abe, K., 2008. Development of educational SAR processor using Ajax technology. The International Archives of the Photogrammetry, Remote Sensing
and Spatial Information Sciences, ISPRS, Vol.XXXVII, Part
B6a, pp.23-28, Beijing, China.
Ito, Y., Teramoto, Y., Abe, K., 2010. Development of a visual SAR processor and its calibration function. Proceedings of the
31st Asian Conference on Remote Sensing, CD-ROM, Hanoi,
Vietnam.
Taflove, A., Hagness, S. C., 2005. Computational Electrodynamics: The Finite-Difference Time-Domain Method. Artech House, USA.
Figure 5. Profiles around the CRs. (b) 3D profile in two directions.
(a) Profile in the azimuth direction. Azimuth Pixel value
Pixel value
Table 2. Evaluation results. The upper and lower rows indicate the average scores of the first and second teaching practices, respectively.
Learning contents
Average score Before
teaching
After teaching Global environmental problem 4.11 3.78 4.00 4.00
Resource mapping 3.33 3.44
2.71 4.52 Earth observation technique 3.11 4.44 3.17 4.60
Map service 3.78 4.78
3.83 4.83
Digital globe 3.78 4.67
3.52 4.86 Processing digital images 2.11 4.44 2.79 4.79 Notation of location on the Earth 4.78 4.33
NA NA
Use of spreadsheet NA NA
4.07 4.50 Use of visual SAR processor NA 4.13
NA 4.29