www.elsevier.nlrlocateraqua-online
The influence of dietary oxolinic acid on fluidised
bed biofilter performance in a recirculation system
ž
/
for rainbow trout Oncorhynchus mykiss
J. Skjølstrup
a, E. McLean
a,), P.H. Nielsen
b, J.-O. Frier
ba
Aalborg UniÕersity, Aquatic Biotechnology Laboratories, SohngaardsholmsÕej 57,
DK-9000 Aalborg, Denmark b
EnÕironmental Engineering Laboratories, SohngaardsholmsÕej 57, DK-9000 Aalborg, Denmark
Accepted 22 August 1999
Abstract
Ž . y1
The effect of medicated feed, containing 2.35"0.01 mg oxolinic acid OA g , upon the
Ž .
performance of fluidised bed FB biofilters was examined over a 29-day period. Rainbow trout were used as stock animals in duplicate recirculation systems. OA was detectable within the systems throughout the period of study, with bulk water OA concentrations reaching 1.24 mg ly1 at their highest point. Sludge levels of OA were measured at 60 mg dayy1 at peak. A mass balance for OA was undertaken on day 21 of the study. Seventy-two percent of the antibiotic could be recovered from the trout, sludge and water, with fish being of minimal significance at trial termination. The treated feed did not effect biofilter performance, either during the feeding
Ž .
period 7 days duration or for 14 days post-feeding, with respect to nitrification rates. In separate studies, which employed a scale model of the recirculation system, maximum nitrification rates
ŽMNR were examined using media from each of the biofilters and four doses of OA 0.1–100 mg. Ž
y1.
l . OA did not effect MNR, but water turbidity and bacterial count increased.q2000 Elsevier Science B.V. All rights reserved.
Keywords: Oxolinic acid; Fluidised bed; Nitrification; Sludge; Medicated feed; Mass balance
1. Introduction
Water recirculation systems provide many advantages, perhaps the three most Ž .
important being: 1 conditions for cultured stock can be controlled for optimal growth;
)Corresponding author. Tel.:q968-515191; fax:q968-513418; e-mail: [email protected] 0044-8486r00r$ - see front matterq2000 Elsevier Science B.V. All rights reserved.
Ž .
Ž .2 environmental effects can be reduced to fulfill the increased demand for cleaner Ž .
production systems; and, 3 stock can be protected from external pollution events. However, increasing stocking densities must offset the costs involved in recirculation system setup. With increased stocking levels, comes a heightened risk of stock loss due to disease. Accordingly, recirculation systems generally incorporate components for
Ž
water disinfection. Examples include UV-irradiation and ozonation Liltved and Land-.
fald, 1995 . Nevertheless, bacterial infections remain a common problem, such that medicated feeds are often employed for treatment purposes. Two antimicrobials are
Ž .
approved for use in aquaculture in Denmark: oxolinic acid OA and sulfadiazinr
tri-Ž .
metoprim Ministeriet for Fødevarer, Landbrug og Fiskeri, 1997 . OA has been demon-strated to be effective against several bacterial pathogens including red mouth disease
ŽArchimbault et al., 1988 , and furunculosis Austin et al., 1983 . The pure form of OA. Ž .
Ž .
is hydrophobic Samuelsen et al., 1992 , such that it is generally delivered via feeding. Most aquaculture recirculation systems are equipped with biological filters for
Ž .
conversion of total ammonia nitrogen TAN , excreted by the cultured animals, to less
Ž .
toxic nitrate review: Skjølstrup et al., 1997 . Due to the nature of recirculated systems, chemicals added to the tank water will often enter the biofilter. Although antibiotics, including formalin, oxytetracycline and erythromycin, have been tested for their
in-Ž
hibitory effect upon the nitrification process Collins et al., 1976; Klaver and Matthews, .
1994; Heinen et al., 1995 , conflicting results have been reported. Nitrifying bacteria are
Ž .
Gram-negative Stanier et al., 1990 and OA is primarily effective against such
Ž .
organisms Alderman et al., 1994 . Moreover, OA is persistent, with a reported oral Ž
bioavailability in the range of 14%–40% Bjorklund and Bylund, 1991; Hustvedt et al.,
¨
.
1991 . Accordingly, between 60%–86% of feed-delivered OA will enter the water column either as a solute or complexes. Limited information is available upon the dynamics of OA, derived from medicated feeds, within recirculation systems; or its impact upon nitrification processes.
This investigation was designed to examine the effect of food-derived OA upon the
Ž .
performance of a fluidised bed FB biofilter with respect to nitrification rates. In addition, the dynamics of OA in the water column, sludge, feed and fish were evaluated. Animals employed in the experiments were rainbow trout held in an experimental
system with a water volume of 1.5 m3. The recirculation system consisted of: FB
biofiltration, degassing, cooling and oxygenation components and a novel collection
Ž .
device for sampling of settable particulates Skjølstrup and McLean, 1997 .
2. Materials and methods
2.1. Experimental strategy
Ž .
FB biofilter performance was evaluated by monitoring daily nitrification rates DNR , concentrations of ammonia and nitrite concentrations in the FB inlet and outlet water
ŽTable 1 . DNR was quantified by examining TAN removal within the main system..
Ž .
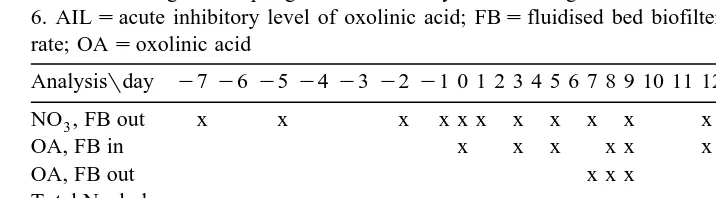
Table 1
Time scheduling for sampling from the main system. Feeding with OA medicated feed took place on days 0 to 6. AILsacute inhibitory level of oxolinic acid; FBsfluidised bed biofilter; MNRsmaximum nitrification rate; OAsoxolinic acid
biofilter media from the main system. The media in the scale model was provided with ammonia, oxygen and bicarbonate to excess. Heterotrophic activity in the main system was evaluated using on-line analyses of oxygen consumption within the FB.
Ž .
On the last day of the experimental period, the acute inhibitory level AIL of OA on the nitrifying capacity of the FB was also investigated using the scale model. Samples of media from the FB were exposed to different concentrations of OA during MNR determinations. Preliminary MNR runs acted as reference values for comparison. Apart from determination of MNR and nitrite accumulation, AIL runs incorporated water turbidity measurements and bulk water bacteria enumeration. These studies were
undertaken because stressed biofilters are characterised by biofilm sloughingr
detach-Ž .
ment Characklis and Marshall, 1990 . Since handling of FB biofilter media samples was expected to affect biofilm stability, three standard MNR runs were undertaken for each analysis. Thus, in the current investigation two types of FB OA tolerance were investigated, viz. tolerance under typical conditions during OA treatment of rainbow trout in a recirculated system and a tolerance during short-term exposure to high levels of OA in a scale model.
A secondary goal of this research was to examine the fate of feed delivered OA. A
Ž .
mass balance over the experimental period 21 days was used. It was assumed that the mass balance included five significant contributions. One positive: OA delivered with the medicated feed and four negative: dissolved OA removed during daily water exchange, settleable OA removed during daily sludge discharge, OA accumulation in
fish and, finally, unaccounted OA, e.g., losses due to metabolismrdegradation, etc.
Sample takes for OA analyses are summarised in Table 1. Sludge production was quantified using sludge nitrogen content.
Ž The main system was checked for steady-state conditions for a 7-day period days-7
. Ž .
to -1 prior to initiation of medication day 0 , which was completed on day 6.
Ž .
2.2. The recirculation system
3 Ž .
The main recirculation system contained 1.5 m of water Fig. 1 and was a
Ž .
modification of a modular design Skjølstrup and McLean, 1997 , consisting of two inter-connected identical units, each equipped with a fish tank, FB biofiltration, hy-draulic sludge separation, oxygenation, degassing and temperature control. Since OA is
Ž .
photo-degradable Lunestad et al., 1995 the UV-disinfection system incorporated into
Ž .
the original design, was removed Fig. 1 . In the common degasser, water was
continuously mixed between the two systems. This method was chosen to guarantee identical inlet water characteristics for the two FBs. FB biofilter performance was,
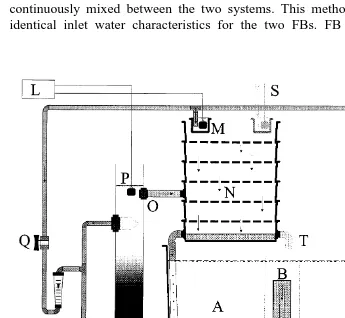
Fig. 1. Diagram of the main experimental system showing one of two identical units. Water from both units
Ž . Ž . Ž . Ž .
was mixed in a common degasser. A Holding tank. B Tank outlet. C Auxiliary oxygen. D Settling zone.
Ž .E Sludge container. F Tank inlet. G Venturi injection of oxygen. H Pump. I Flowmeter. J Cooler.Ž . Ž . Ž . Ž . Ž . Ž .K Fresh water. L Data aquisition. M Beaker for oxygen determination of FB inlet water. N Degasser.Ž . Ž . Ž . Ž .O Outlet FB biofilter. P Oxygen probe. Q Valve. R FB biofilter. S Flow from second unit. T Flow toŽ . Ž . Ž . Ž . Ž .
Ž . Ž .
therefore, evaluated using duplicate observations. In contrast, data on other system
Ž .
components fish, sludge, OA mass balance , were derived from mixed and homoge-nized samples from both units.
A special characteristic of both FB biofilters was internal water circulation, which Ž results in prolonged residence times and improved determination of activity rates DNR
. Ž
and oxygen consumption due to larger concentration gradients Skjølstrup and McLean,
. Ž .
1997 . FB media consisted of glass weighted PVC Sadolax IrS, Hobro, Denmark ,
with a material density of approximately 1.3 kg dry weight dmy3. The media had a
2 y3 Ž .
surface area:volume ratio of 1000 m m assuming a smooth surface at a bed
porosityrpore volume of approximately 35%. Bed expansion was 50%, with a hydraulic
Ž . 3 y2 y1
surface scross-section of biofilter loading of 100 m m h . Total surface area
within each FB was 14.5 m2, including inner-walls of pipes and tubing, etc.
Oxygen concentrations at the outlet of both FBs were 9.8"1.0 mg O ly1.
2
Temperature was 16.8"0.38C and 17.1"0.38C, respectively. Decreases in pH values
due to nitrifying activity were controlled with addition of sodium bicarbonate. The
recirculation rate for the whole experimental set-up was 90"1%, i.e., 10"1% of the
total water volume in the system was replaced from the domestic supply each day
Ž; y1.
150 l day .
Batch experiments on biofilter media from the two FBs were performed using a scale
Ž .
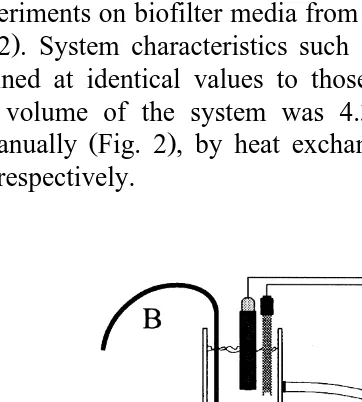
model Fig. 2 . System characteristics such as flow, bed expansion, and temperature, were maintained at identical values to those of the main system. Including biofilter media, total volume of the system was 4.3 l. Temperature, oxygen and pH were
Ž .
controlled manually Fig. 2 , by heat exchange, addition of pure oxygen and sodium bicarbonate, respectively.
Ž . Ž .
Fig. 2. Diagram of the scale model used during batch experiments. A FB biofilter media. B Oxygen
Ž . Ž . Ž . Ž . Ž .
2.3. Fish and husbandry
Ž . Ž
Each tank Fig. 1 was stocked with 20 kg of healthy rainbow trout Oncorhynchus
. Ž
mykiss . Fish were individually weighed 7 days prior to medication mean weight for all
. Ž
fish 375"65 g . At study termination on day 21, animals were re-weighed 416"95
. Ž y1 y1.
g . The fish were fed by automated feeders 100 g tank day throughout the
experimental period. This corresponded to approximately 0.5% body weight per day. A
Ž .
commercial high-energy diet Ecolife 19, BioMar, Brande, Denmark was used except Ž
for the period of medication where a commercially available medicated feed Aquavet .
OA, BioMar, Brande, Denmark was employed instead. The OA content of the
medicated feed was 2.35"0.01 mg OA gy1 feed. Oxygen concentration in the two
tanks ranged between 7.9"0.4 and 7.8"0.4 mg O ly1. Average temperature for both
2
tanks was 15.3"0.58C.
2.4. Analytical methods
Temperature in the tanks and biofilters, and oxygen in the biofilter inlet and outlet w
Ž .
were monitored on-line by OxyGuard OxyGuard, Birkerød, Denmark combi-probes
Ž .
attached to a control system see Fig. 1 . Readings were recorded for each parameter
every 15 min and logged using a Grantw datalogger. Biofilter residence time was
Ž w
calculated using readings from flow meters attached to the two biofilter inlets SED , .
model 785-2-1-315; Granzow, Glostrup, Denmark; Fig. 1 . pH was measured daily by Ž
Hamilton liquid-glass electrodes connected to a CyperScan pH-meter Gravquick,
.
Glostrup, Denmark . Biofilter inlet and outlet TAN and nitrite concentrations were
measured daily, spectrophotometrically, using Hachw
reagents on a Hach DR-2000 spectrophotometer. Sampling for TAN and nitrite determination in the main system was done in duplicate. Water samples from FB inlets and outlets, together with samples of accumulated sludge, were taken in the morning before feeding. System nitrate was
measured on 45mm pre-filtered samples by a Techniconw Traacs 800e auto-analyzer
on samples from the FB biofilter outlets. Water opacity was examined using a Perkin
Ž .
Elmer UVrVIS spectrophotometer 650 nm and 800 nm . Total sludge nitrogen
ŽKjeldahl-method , was determined in duplicate according to AOAC 1984 .. Ž .
TAN measurement in the scale model, during MNR determination, was based upon single water samples. FB biofilter media for MNR determination were sampled at random times from the main system. Estimates of water column bacteria in the scale model during AIL runs were based on direct counting of cells stained with the
Ž X
.
fluorochrome, DAPI 4 -6-diamidino-2-phenylidole . DAPI was added to 2 ml of sample
to a final concentration of 25mg DAPIrml. After 5 min of staining, sampled bacteria
were filtered onto a poly-carbonate filter of 0.22-mm pore size and counted by
fluorescence microscopy.
OA was measured by HPLCrfluorescence detection for fish, water and feed samples.
Ž .
The analytical method developed by Schneider et al. 1999 was used for all samples although sample preparation varied. Four fish, two from each tank, were sampled before
Ž .
medication and 2 weeks after medication ceased day 0 and 21, respectively . The whole
Ž .
summarises the times of sludge and water sampling. Sludge OA was measured in combined homogenized samples. Extraction of OA from fish and sludge samples
Ž .
followed the methods described by Schneider et al. 1999 . Water samples were
analysed without extraction. Feed samples for OA analysis were prepared in the same
Ž .
manner as fish. The HPLC HP 1100 employed a Phenomenex C18 column held at
288C and Hitachi FL-7480 detector. Run time was 5 min for an injection volume of 20
ml, with 0.02 M phosphorous acid–acetonitrile–tetrahydrofuran solution as the mobile
y1 Ž
phase. The analytical method had a limit of quantification of 4mg OA l Schneider et
. al., 1999 .
2.5. DNR, MNR and AIL measurements
DNRs within the main system were calculated using inlet and outlet concentrations of TAN, residence time and data relating to total surface area within each FB. MNRs were
Ž . Ž .
measured using the scale model Fig. 2 . Samples 559.7"26.2 g DW, ns36 of
biofilter media, together with bulk water, were taken from each of the FBs according to the schedule described in Table 1. All MNR runs were made in duplicate using media sampled from each FB. MNR runs lasted for 180 min with TAN determinations every 30 min. Time 0 and 180 min samples were also analyzed for nitrite. The sampled media were returned to their original biofilter immediately after each run in order to maintain main system media volume. Media used for AIL determination were discarded.
Based upon results from preliminary experiments, oxygen and pH were controlled at
intervals of 10.0 to 12.0 mg O ly1 and 6.9 to 7.5, respectively, and an ammonium
2
chloride solution was employed to provide initial TAN concentrations of 6 mg NH -N4
ly1, thereby resulting in unlimited nitrification.
On day 21, AIL runs were undertaken on samples from each FB exposed to various concentrations of OA. Reference values for water column bacteria and absorbance were derived from standard MNR runs undertaken on days 15, 18 and 21. During AIL determinations, absorbance, and the number of water column bacteria were determined for initial and terminal sampling points. The same samples were also analysed for nitrite at the experiment start and end, and for TAN determinations every 30 min. AIL was
Ž .
examined at four concentrations of OA Sigma, St. Louis, USA : 0.1, 1.0, 10, and 100
mg OA ly1. The OA was dissolved in a 0.5 M NaOH-solution.
3. Results
3.1. Performance of FB biofilters
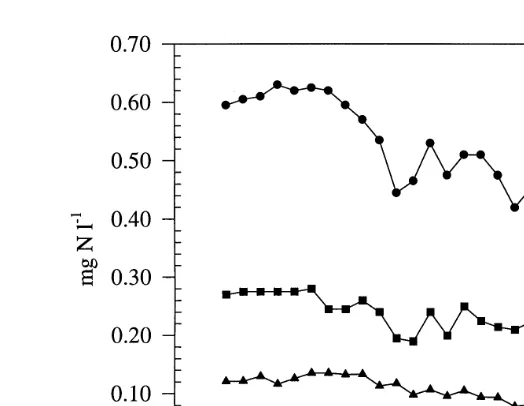
Concentrations of TAN and nitrite of inlet and outlet water from the FBs are depicted in Fig. 3. Following addition of OA to the water column, inlet TAN and nitrite levels showed sustained decreases throughout the experimental period, with inlet TAN
concen-y1 y1 Ž .
trations declining from 0.6 mg NH -N l4 to 0.4 mg NH -N l4 Fig. 3 . In contrast,
outlet TAN levels remained relatively constant, thereby indicating decreased nitrification
Ž .
Fig. 3. Concentrations of TAN and nitrite in the FB, and biofilter inlet and outlet of the experimental system
ŽFig. 1 over a period of 29 days. Medicated feed was introduced into the system at day 0 and ceased on day 6..
Each data point is presented as"SD, ns2.
magnitude than that observed for TAN. Both inlet and outlet nitrite was at all times
y1 Ž . y1
below 0.15 mg NO -N l2 Fig. 3 . Nitrate was constant at 55"4 mg NO -N l3
throughout the period of investigation.
Fig. 4. Consumed oxygen, MNR and DNR for FB biofilters. MNR data were acquired from scale model
Ž .
Oxygen consumption within the FB biofilters, representing total aerobic microbial
activity, decreased from a mean value of 11.3 g O day2 y1 prior to addition of OA, to
y1 Ž .
9.4 g O day2 Fig. 4 . MNR for sampled biofilter media, together with DNR at the
time of sampling is also depicted in Fig. 4. MNR of 0.35 g NH -N m4 y2 dayy1 were
recorded for the 7-day period prior to use of medicated feed. Thereafter, MNR declined
y2 y1 Ž .
steadily, achieving levels of 0.25 g NH -N m4 day by trial end Fig. 4 .
Observa-Ž
tions upon DNR mimicked those for MNR, although rates were lower 0.05–0.10 g y2 y1 .
NH -N m4 day ; Fig. 4 . The range of nitrite accumulation during MNR runs fell
y1 Ž
betweeny0.071 and 0.019 mg NO -N l2 negative values reflecting a reduction from
. initial concentrations .
3.2. Determination of AIL
Ž . Ž
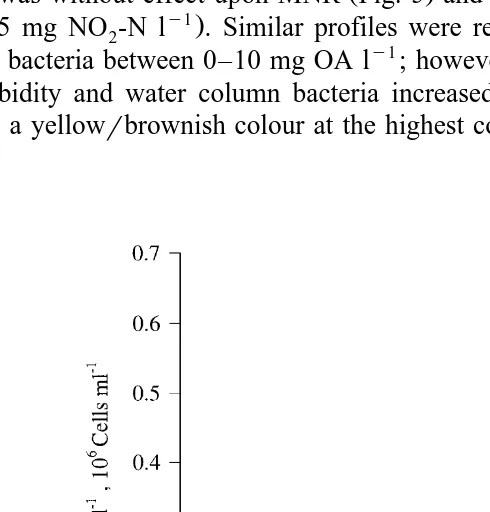
OA was without effect upon MNR Fig. 5 and nitrite accumulation range:y0.058
y1.
to 0.005 mg NO -N l2 . Similar profiles were recorded for both turbidity and water
column bacteria between 0–10 mg OA ly1; however, at a concentration of 100 mg OA
y1 Ž .
l turbidity and water column bacteria increased Fig. 5 . The water changed from
clear to a yellowrbrownish colour at the highest concentration of OA employed.
Ž .
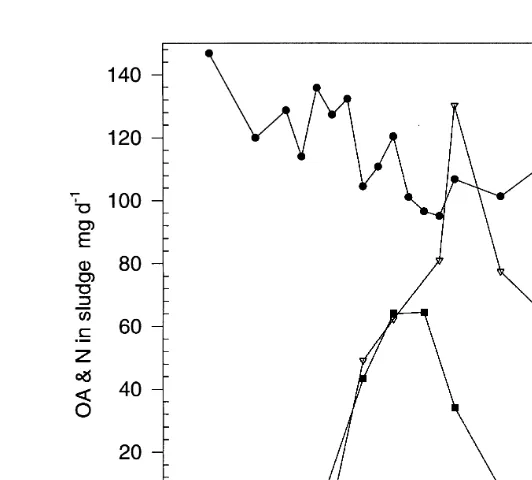
Fig. 6. Total nitrogen N and OA in accumulated sludge and concentration of OA in bulk water. For further details, see legend to Fig. 3.
3.3. The fate of OA
Results from the analysis of OA and nitrogen in both water and sludge samples are illustrated in Fig. 6. Prior to application of medicated feeds, OA was below the level of detection within the experimental system. The daily amount of OA in the sludge reached
Ž y1. Ž .
a peak value 64 mg OA day , 5 days after feeding medication began Fig. 6 . The
accumulation of OA in the sludge was triphasic. There was an initial rapid accumulation between 0 and 5 days, followed by a rapid decline between days 7 and 12, and a
Ž .
plateauing until the end of the experiment Fig. 6 . In marked contrast to sludge OA,
Ž y1.
bulk water concentrations of the antibiotic peaked at day 9 1.24 mg OA l , 2–3 days
after medication ceased. Total sludge nitrogen ranged between 611 and 944 mg N dayy1
Table 2
Mass balance for OA for the recirculation system on the final day, day 21
Ž . Ž .
Fraction OA mg OA %
Feed 3286 100
Ž .
Accumulated in fish day 21 data 1 0
Sludge 520 16
Waste water 1836 56
with highest values being recorded during the earlier parts of the experiment, and lower
Ž .
levels being observed following a period of medication Fig. 6 .
Ž .
Analysis of sludge and bulk water equivalent to the system outlet concentration OA
Ž .
provided data for estimation of system mass balance Table 2 . The amount of OA detected in fish at day 21 of the trial represented a minor component of the mass balance
Ž-0.1% of total . In contrast, 56% was removed from the system via water exchange,.
15% with settleable particulates, leaving approximately 28% unaccounted for by the analyses.
4. Discussion
Ž y3
In this study, and under practical conditions at a stocking density of 25 kg m .
system water , feed-based OA had no effect upon nitrification rates of a system based
Ž y1
upon FB biofilters, at the dosage employed fed 0.5% body weight day with feed
.
containing 0.235% wrw OA . Nevertheless, OA, derived from trout effluents has been
shown to retain a broad-spectrum activity on several different strains of sediment and
Ž .
water column bacteria Spanggaard et al., 1993 . Other antibacterial agents, including
Ž . Ž .
erythromycin Collins et al., 1976 and oxytetracycline Klaver and Matthews, 1994 , have been shown to inhibit biofilter nitrification rates.
The conclusion that OA was without impact upon the biofilter’s nitrification rates
Ž .
appears, at first glance, to be inconsistent with the presented results Fig. 4 , since a general decrease was registered for MNR, DNR and total oxygen consumption following fish treatment with medicated food. This effect is likely to be due to decreased microbial activity within the FB, which could be interpreted as a direct inhibition by OA. However, it is important to note that recirculation systems continually evolve with respect to biofilm kinetics. In a system such as the one used here, the state of biofilm transformation is likely to be even more pronounced due to the relatively high surface
Ž .
area to water ratio tubes, pipes, tank and degasser walls, etc. when compared to larger systems. Clearly, the experimental system provides ample opportunity for colonisation and subsequent growth of nitrifying biomass outside the FB. It is noteworthy that nitrate added to the system via feeding and set-up water, was maintained at a constant level
Ž .
throughout the experimental period. Moreover, sludge nitrogen did not increase Fig. 6
Ž .
as a result of, for example, reduced appetite uneaten feed pellets among the stocked animals. If OA were to have influenced the efficiency of the FB, then concentrations of TAN in the inlet and outlet water would have increased. In fact, the opposite was
Ž .
observed Fig. 3 . Clearly, the results indicate an increase in total ammonia removal that in all likelihood occurred due to nitrifying bacteria biomass build up within the system as a whole.
Several studies have reported reduced efficacy of antibiotics for biofilm bacteria
Žreview: Gandar, 1996 . This may occur due to biofilm resistance to biocides. Since AIL.
runs were performed on biofilter media that had experienced earlier exposure to OA, the
Ž .
resistance to antibiotics may also be enhanced due to the protective nature of the
Ž .
exopolysaccharide matrix, which envelopes biofilm cells Gandar, 1996 . However, while this effect can not be excluded from the present study, one advantage of FBs, compared to other designs, relates to the steady conditioning of the system resulting in a
Ž .
thinner biofilm Ruggeri et al., 1994 and hence reduced barrier potential. Alternatively, it has been hypothesised that the electrical charge of the polysaccharide chains might
Ž .
influence antimicrobial diffusion Gandar, 1996 .
Comparison of OA concentrations reached in the bulk water of the experimental system with those for the selected concentrations during AIL determination, revealed
Ž y1.
that only the two highest OA concentrations tested 10 and 100 mg OA l returned
elevated values. Since no effects were observed during long-term exposure of the model system to OA, acute inhibition of MNR determination would not be expected in the
scaled system for concentrations of 0.1 and 1 mg OA ly1. In fact, MNR remained
unaffected even at the highest concentration of OA tested. The increase in water column
bacteria and the development of a yellowrbrown colour during scale model tests
performed at 100 mg OA ly1, are believed to be a result of dissolution of the biofilm.
Ž .
Such a phenomenon is a result of an indisposed stressed biofilm. It is credible that continued sloughing of biofilm from the FB within the main system might lead to a reduced nitrifying capacity over extended periods but this remains conjecture. The mechanisms underlying the apparent lack of effect for OA needs to be explained since biocides in general have been suggested as being a major cause for the sudden
Ž . Ž .
detachment of biofilm sloughing Characklis and Marshall, 1990 . A disadvantage of
the experimental strategy employed was that sampled biofilter media had been exposed to OA for varying durations such that the possibility remains that the microflora adapted to OA exposure.
Although nitrification was unaffected in the main system over the period of investiga-tion, there is reason to believe that the performance of a nitrifying biofilter would be
influenced by an OA concentration G100 mg OA ly1, as indicated by the scale model
studies. The concentration of OA in the bulk water is obviously a function of fish
Ž y1 .
density. A fish density of 2.5% kg wet weight of fish kg tank water=100 was used
in this experiment. Densities of up to 20% have been reported for some commercial systems. Thus, five times higher levels of bulk water OA might, in theory, be achieved in such systems were the identical doses of OA to be used.
Ž .
Most of the OA added via the feed left the system either in solute water exchange
Ž .
form or associated with particulates sludge removal , with limited amounts being accounted for by fish tissues at day 21. Direct determination of OA bioavailability for the fish was not examined. However, there was a delay of 2 days following cessation of medication before the peak OA levels occurred in the water column. The uptake and excretion or OA degradation by the fish was, therefore, likely to be much higher than the analytical results on fish samples indicate. The precise method by which OA enters the water column from the feed remains to be determined. However, the possibility that some of the food-based OA entered the water directly from the feed pellet cannot be discounted. Since 72% of the OA delivered to the system was ‘‘recovered’’, 28% remains ‘‘undefined’’. With bioavailability of OA reported in the range of 14%–40%
absorbed by the fish was biotransformed and metabolized during the experimental
Ž .
period see Ishida, 1992 . In addition, OA would have degraded over time, throughout
Ž .
the entire system see Lunestad et al., 1995 . The data with respect to OA thus represent a mass balance for the system as a whole. It is noteworthy that the sludge production appeared to decline following OA treatment. This might have occurred because of increased soluble production due to alterations in food processing and faecal stability. Future studies upon the possible effect of OA upon FB performance should be undertaken using higher concentrations than employed in the present study and for extended periods. Attention should be leveled at the stability and kinetics of system biofilms following antibiotic exposures.
Acknowledgements
The authors are indebted to the Danish Technical Institute, Aarhus, for their assistance in OA quantification. This research was funded by the Danish Technical
Ž .
Research Council grant number 9400386 .
References
Alderman, D.J., Rosenthal, H., Smith, P., Stewart, J., Weston, D., 1994. Chemicals used in mariculture. ICES Coop. Res. Rep., 100 pp.
AOAC, 1984. Official methods of analysis. Association of official analytical chemists. Arlington, 1141 pp. Archimbault, P., Ambroggi, G., Nicolas, S., 1988. Oxolinic acid in the trout: bioavailability and tissue
residues. Ann. Rech. Vet. 19, 39–43.
Austin, B., Rayment, J., Alderman, D.J., 1983. Control of furunculosis by oxolinic acid. Aquaculture 31, 101–108.
Bjorklund, H., Bylund, G., 1991. Pharmacokinetics and bioavailability of oxolinic acid and oxytetracycline in¨
Ž . Ž .
rainbow trout Oncorhynchus mykiss . In: Friis, C. Ed. , Proceedings of the 5th congress of the European association for veterinary pharmacology and toxicology, 18–22 August 1991, Copenhagen, Denmark, pp. 298–299.
Characklis, W.G., Marshall, K.C., 1990. Biofilms. Wiley, New York, 796 pp.
Collins, M.T., Gratzek, J.B., Dawe, D.L., Nemetz, T.G., 1976. Effects of antibacterial agents on nitrification in an aquatic recirculation system. J. Fish. Res. Board Can. 33, 215–218.
Gandar, S., 1996. Bacterial biofilms: resistance to antimicrobial agents. J. Antimicrob. Chemother. 37, 1047–1050.
Heinen, J.M., Weber, A.L., Noble, A.C., Morton, J.D., 1995. Tolerance to formalin by a fluidized bed biofilter
Ž .
and Rainbow trout Oncorhynchus mykiss in a recirculating culture system. J. World Aquacult. Soc. 26, 65–71.
Hustvedt, S.O., Salte, R., Kvendset, O., Vassvik, V., 1991. Bioavailability of oxolinic acid in atlantic salmon
ŽSalmo salar L. from medicated feed. Aquaculture 97, 305–310..
Ishida, N., 1992. A study on the metabolic fate of oxolinic acid, a synthetic antibacterial agent, in cultured fishes. Bulletin of the National Research Institute for Fisheries Science 4, 1–58.
Klaver, A.L., Matthews, R.A., 1994. Effects of oxytetracycline on nitrification in a model aquatic system. Aquaculture 123, 237–247.
Liltved, H., Landfald, B., 1995. Use of alternative disinfectants, individually and in combination, in aquacultural wastewater treatment. Aquacult. Res. 26, 567–576.
Ministeriet for Fødevarer, Landbrug og Fiskeri, 1997. Perspektivplan for akvakultur i Danmark 1997. Danmarks Fiskeriundersøgelser, Lyngby, 124 pp.
Ruggeri, B., Caire, G., Specchia, V., Sassi, G., Bosco, F., Gianetto, A., 1994. Determination of optimal
Ž .
biofilm activity in a biological fluidized bed BFB reactor. Water Sci. Technol. 29, 347–351.
Samuelsen, O.B., Lunestad, B.T., Husevag, B., Hølleland, T., Ervik, A., 1992. Residues of oxolinic acid in˚ wild fauna following medication in fish farms. Dis. Aquat. Org. 12, 111–119.
Schneider, J., Frausig, A., Pedersen, B.M., 1999. Determination of oxolinic acid and flumequine in trout muscle. Method documentation. Technical Report, Dept. Chemical Technology, Danish Technological Institute, Taastrup, Denmark, 15 pp.
Skjølstrup, J., McLean, E., 1997. Appraisal of expanded bed biofilters in an aquaculture recirculation systems:
Ž .
engineering for ready access to evaluate system performance characteristics. In: Jørgensen, L. Ed. , Cultivation of Cold Water Species: Production, Technology and Diversification. Short communications and abstracts presented at ‘‘Aquaculture Trondheim 97’’, 10–12 August 1997, Trondheim, Norge, pp. 98–99. Skjølstrup, J., Nielsen, P.H., Frier, J.-O., McLean, E., 1997. Biofilters in recirculating aquaculture systems:
Ž .
State of the art. In: Makkonen, J. Ed. , Technical Solutions in the Management of Environmental Effects of Aquaculture, Vol. 95. The Scandinavian Association of Agricultural Scientists Seminar no. 258, 13–15 September 1995, Oulu, Finland. Kala-Jariistaraportteja, pp. 33–49.
Spanggaard, B., Jørgensen, F., Gram, L., Huss, H.H., 1993. Antibiotic resistance in bacteria isolated from three freshwater fish farms and an unpolluted stream in Denmark. Aquaculture 115, 195–207.