ABSTRACT:
Intertidal ecosystems have primarily been studied using field-based sampling; remote sensing offers the ability to collect data over large areas in a snapshot of time which could compliment field-based sampling methods by extrapolating them into the wider spatial and temporal context. Conventional remote sensing tools (such as satellite and aircraft imaging) provide data at relatively course, sub-meter resolutions or with limited temporal resolutions and relatively high costs for small-scale environmental science and ecology studies. In this paper, we describe a low-cost, kite-based imaging system and photogrammetric pipeline that was developed for constructing high-resolution, 3D, photo-realistic terrain models of intertidal rocky shores. The processing pipeline uses automatic image feature detection and matching, structure-from-motion and photo-textured terrain surface reconstruction algorithms that require minimal human input and only a small number of ground control points and allow the use of cheap, consumer-grade digital cameras. The resulting maps combine colour and topographic information at sub-centimeter resolutions over an area of approximately 100m, thus enabling spatial properties of the intertidal environment to be determined across a hierarchy of spatial scales. Results of the system are presented for an intertidal rock platform at Cape Banks, Sydney, Australia. Potential uses of this technique include mapping of plant (micro- and macro-algae) and animal (e.g. gastropods) assemblages at multiple spatial and temporal scales.
1 INTRODUCTION
Plant and animal assemblages that live in intertidal regions such as rocky shores are part of a complex, dynamic ecosystem, the structure and functioning of which can vary across a cascade of spatial and temporal scales (Underwood, 2000). Intertidal ecosystems have primarily been studied using field-based sam-pling (e.g. (Murphy et al., 2008)) at appropriate resolutions to capture the spatial variability at which assemblages occur. Re-mote sensing is the ideal tool to collect contiguous data over large areas in a snapshot of time. Sensors on satellite and aircraft platforms provide data at relatively coarse spatial (greater than 30cm/pixel) and temporal resolution and this constrains the use-fulness of these data to test ecological models. Conventional re-mote sensing systems do not provide information on topographic variability at small scales (centimeters and meters), which is known to influence the distribution of assemblages of plant and animal species. The high costs of data collection further limit their effec-tiveness in small-scale environmental science and ecology stud-ies.
In this paper we develop data collection techniques and data pro-cessing algorithms for constructing ultra-high resolution (sub-centimeter) three-dimensional (3D) maps of intertidal rock plat-forms with a low-cost kite-based mapping system using hundreds of photographs over a broad area. Low-cost platforms such as kites and balloons are an alternative means for collecting data over small areas and have been used for aerial photography, for example in agriculture (Aber et al., 1999, Aber et al., 2002, Arti-gas and Pechmann, 2010), ecology (Guichard et al., 2000), hu-manitarian applications (Sklaver et al., 2006) and archaeology (Verhoeven, 2009) although typically to acquire a single or a small number of photographs. For example, (Guichard et al., 2000) developed a stereo photography rig carried by a helium balloon for collecting stereoscopic image pairs over rocky shores.
Our method instead fuses information from hundreds and poten-tially thousands of overlapping monocular images using modern photogrammetry and bundle adjustment techniques (Frahm et al., 2010, Agarwal et al., 2010), allowing for coverage over much larger areas with high-resolution.
In this paper, we describe a photogrammetric pipeline that was developed for constructing high-resolution, 3D, photo-realistic terrain models using multiple low-altitude images collected from a consumer-grade digital camera on-board the kite platform. The data processing utilises automatic image feature detection and matching strategies (Vedaldi and Fulkerson, 2008, Beis and Lowe, 2003) that minimise the number of ground control points required during data collection and human-effort required in post-processing. Matched image features were used to estimate the relative pose between cameras and the 3D positions of image features (up-to an unknown scale factor). Image pairs were combined incrementally to form a complete 3D point cloud of the scene and relative cam-era positions (up-to an unknown scale, rotation and translation) using structure-from-motion and bundle adjustment (Snavely et al., 2008). Multi-view stereo reconstruction (Furukawa and Ponce, 2010) was then used to create a dense, 3D pointcloud from which a triangulated surface model was created. Finally, the surface model was photo-textured using a band-limited blending of mul-tiple image patches at each region of the surface and visualised in 3D using a level-of-detail rendering system to capture sub-centimeter details over the entire span of the map. The resulting maps combine colour and topographic information, thus enabling spatial properties of the intertidal environment to be determined across a hierarchy of spatial scales. Potential uses of this tech-nique include mapping of plant (micro- and macro-algae) and an-imal (e.g. gastropods) assemblages at multiple spatial and tem-poral scales.
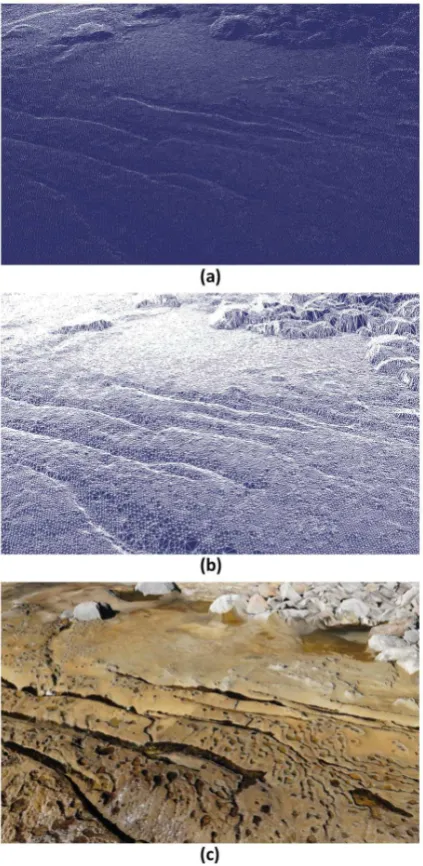
demon-Figure 1: Examples of aerial images captured from the kite-based imaging platform (taken from approximately 15m altitude).
strated from experiments at an intertidal rock platform at Cape Banks, Sydney, Australia in Section 3. Conclusions and future work are discussed in Section 4.
2 METHODOLOGY
2.1 Kite-based Image Acquisition
A kite-based imaging system was built that used a 2.7m wingspan conynes-delta kite to lift a fixed, downwards-looking rig hold-ing a consumer-grade digital camera. The conynes-delta kite was chosen for its stability and lifting capacity in a wide range of wind conditions. The camera was suspended from a Picavet rig which attached to the line of the kite approximately 10m lower than the kite to minimise the impact of wind gust-induced motion of the camera. The Picavet provided mechanical levelling of the camera during changes in the flying angle of the kite. The camera used was a Sony NEX-3 with a 16mm pancake lens which provided an imaging field of view of approximately 73-by-52o
with a resolu-tion of 4592-by-3056 pixels. The camera was chosen as a trade-off between the image quality achieved from a full-frame sen-sor digital SLR and the light-weight of a small-sensen-sored compact digital camera. Figure 1 illustrates example images captured by the system at an altitude of approximately 15m from the ground, with a coverage footprint of approximately 22-by-15m.
During data collection, the kite was used to hoist the camera rig over the area of interest and the camera programmed to capture images at a frequency of approximately one shot per second. The kite could be flown at a variety of altitudes between approxi-mately 10-100m, based on desired area coverage and ground spa-tial resolution and limited by the length of the kite line. The de-sired height was achieved using distance markers on the line and by approximating the flight angle of the kite. The kite was then slowly walked across the terrain allowing multiple overlapping images to be captured of the entire area of interest.
2.2 Image Processing, Feature Extraction and Matching
After data collection, images were copied from the camera to a desktop computer for processing. Images that were affected by motion blur during wind gusts or large occlusions of the ter-rain (for example images of people moving in the scene) were removed manually before the processing began. Scale-Invariant Feature Transform (SIFT) features (Vedaldi and Fulkerson, 2008) were extracted in each image and matched across all image pairs
Figure 2: Steps in Terrain Reconstruction: (a) 3D point cloud generated from multi-view stereo, (b) surface triangulation, (c) final photo-textured surface model.
using a kd-tree (Beis and Lowe, 2003) of the features in each im-age. Robust detection of feature match outliers was performed us-ing epipolar constraints between images (Torr and Murray, 1997). SIFT features correspond to distinctive points in the texture of surfaces captured in images and were highly suited for use in the rocky intertidal environment. Multi-core software implementa-tions of these methods were developed in order to process images in parallel, speeding up processing times.
2.3 3D Pointcloud Reconstruction
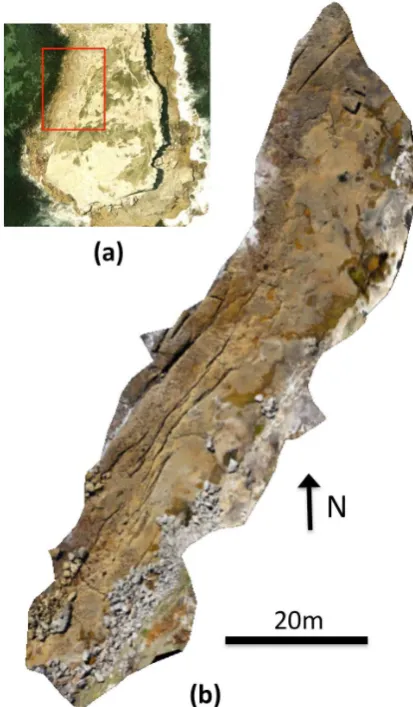
Figure 3: Study Site: (a) Cape Banks (shown in red box) at Botany Bay, Sydney Australia, (b) existing aerial photography of the area (courtesy of Google Maps), (c) ground-based photo of the rock platform at low tide (photo taken week prior to data collection).
3D point cloud and existing geo-referenced aerial photography of the site were used via Horn’s method (Horn, 1987) to compute a transformation of the pointcloud into 3D geo-referenced coor-dinates with absolute scale. Alternatively, ground control points could have been measured at the site for example using a hand-held Global Positioning System (GPS) receiver.
A multi-view stereo reconstruction algorithm (Furukawa and Ponce, 2010) based on the correlation score of dense patches in the over-lapping images was then used to produce a dense 3D point-cloud corresponding to a higher spatial resolution than by using SIFT features alone. This algorithm used the relative camera poses es-timated during bundle adjustment to triangulate dense image fea-tures and robustly remove outliers from the terrain point cloud. The resulting 3D pointcloud had a spatial density that depended on the level of texture in the environment and was usually within a small factor of the image pixel size (i.e. approximately one 3D feature for every 5-by-5 pixel patch on average).
2.4 Photo-textured Terrain Model and Visualisation
A triangulated terrain surface model was constructed from the 3D pointcloud using Delaunay triangulation (Barber et al., 1996). For each face of the surface, the images corresponding to the coverage of the face were identified using the estimated relative poses of each camera. The images were ranked based on the distance between the point in the environment and the camera centre (and thus image resolution at this point). Each face was then applied with a photo-texture using a band-limited blending (Johnson-Roberson et al., 2010) of the closest four image patches at the surface face. The final 3D model was visualized using a level-of-detail rendering system (Johnson-Roberson et al., 2010) (to capture sub-centimeter details over the entire span of the map) and was used to additionally construct an orthographically recti-fied photo-mosaic of the area.
The 3D model building process is illustrated in Figure 2. Figure 2 (a) shows the initial 3D point cloud after multi-view stereo recon-struction is applied. Figure 2 (b) illustrates the 3D surface mesh constructed from triangulation. Figure 2 (c) shows the final 3D
Figure 4: Photo-mosaic Reconstruction of an Intertidal Rockflat: (a) Existing aerial photography of the area (courtesy of Google Maps), (b) constructed photo-mosaic using kite-based images and processing pipeline.
photo-textured model. The terrain reconstruction algorithms ben-efited from the large degree of overlap in the imagery; the view selection and band-limited-blending allowed for only the best im-ages of a given surface to be used in the final model, providing leeway for images taken from poor angles or with disturbances or occlusions such as shadowing.
3 RESULTS AND DISCUSSION
3.1 Experimental Setup
Experiments were performed over an intertidal rock platform at Cape Banks (34.000o
S, 151.249o
E) on the north edge of Botany Bay, Sydney, Australia (see Figure 3). The site lies within a na-tional park aquatic reserve and is host to various intertidal species such as micro- and macro-algae, gastropods, snails and cunjevoi. Data collection was performed during low tide on a clear sunny day around midday to maximise image quality. Images were cap-tured continuously at an altitude of approximately 15-20m as the kite line was walked across a 100m-by-20m section of a rocky platform. The time taken to acquire images across the platform was approximately five minutes.
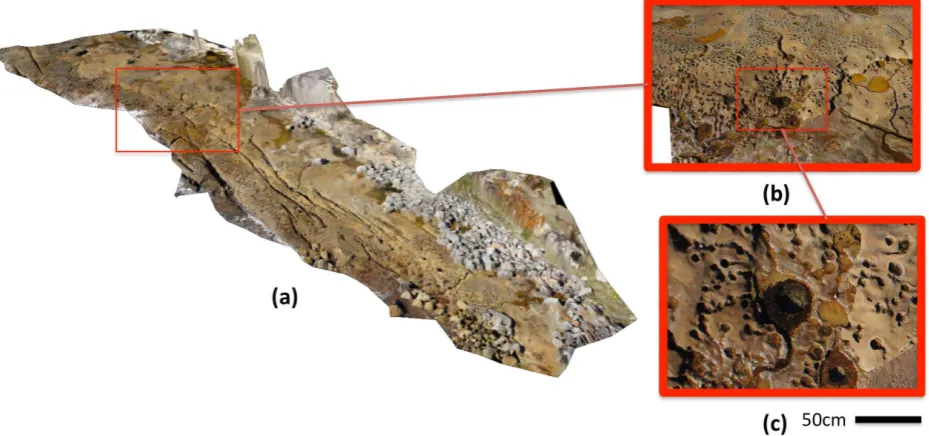
process-Figure 5: 3D Photo-textured Reconstruction of an Intertidal Rockflat: (a) 3D oblique view of the rock platform, (b) medium-level zoom oblique view of rock platform section, (c) full-zoom overhead view of individual rockpool. The level-of-detail visualisation system allows for different model scales to be visualised in a single, continuous terrain model.
Figure 6: 3D Photo-textured Reconstruction of an Intertidal Rockflat: Perspective view from the southern end of the 3D ter-rain reconstruction with annotations illustrating landscape fea-tures/habitat types at the site.
ing pipeline took approximately 4.5 hours running on a process-ing server with two six-core, 3.3GHz processors with most time spent performing image processing tasks such as feature extrac-tion and matching. The same processing pipeline was performed on a dual-core, 2.4GHz laptop for comparison, taking approxi-mately 17 hours to complete.
3.2 Mapping Results
Figure 4 illustrates the final photo-mosaic of the intertidal rock platform and existing manned aerial photography of the the Cape Banks area for reference. Along the western limit of the map is the waterline to the bay and along the eastern limit in the map is a steep cliff-face which is permanently above the high tide water-line.
Figure 5 shows the 3D photo-textured model of the terrain recon-struction. The final 3D terrain map displayed a 3D topographic
resolution of approximately 0.25 points/square-cm and a photo-texture resolution of approximately 2-4mm/pixel. Figure 5 (b) and (c) illustrate zoomed-in views of the 3D model from medium scale to fine-scale views. The level-of-detail visualisation system allowed for different model scales to be visualised in a single, continuous terrain model. The highest level of detail information provides detailed structural information on individual rock pools with colour information indicating the presence of micro-algae coverage and assemblages of gastropods such as periwinkles and limpets.
The site exhibits a number of habitats visible in the mosaic such as rock pools, boulder fields and crevices between the rock (see Figure 6).
3.3 Potential Applications in Intertidal Ecology
The presented mapping technique provides two primary types of information of interest for the study of intertidal ecosystems with a high level-of-detail over large areas that would be infeasible us-ing traditional samplus-ing methods. Topographic mappus-ing allows for high-resolution measurements such as rugosity, vertical posi-tion on the shore with respect to tides and the slope and aspect with respect to the sun over a large area. Photographic mapping allows for the identification of intertidal species present during imaging and has the potential to provide data on variables such as chlorophyll/ algal biomass with the addition of near-infrared images.
tidal cycle, enables independent measurements to be made. Ap-plications include the determination of impacts of structures on sediment properties or the effects of spillage of contaminants e.g. algicides, pesticides or fertiliser (Murphy and Tolhurst, 2009) on phytobenthos.
4 CONCLUSIONS AND FUTURE WORK
In this paper, we have described a photogrammetric pipeline that was developed for constructing high-resolution, 3D, photo-realistic terrain models of intertidal areas using multiple low-altitude im-ages collected from a consumer-grade digital camera suspended by a kite platform. Dynamic intertidal ecosystems by their na-ture can change rapidly at the scale of minutes to years making it almost impossible to acquire data that describe changes which oc-cur spatially independently of temporal changes using field-based sampling. The methods presented acquire colour and topographic information across a hierarchy of spatial scales in a very small time interval, enabling changes in spatial distributions of assem-blages to be determined independently of temporal changes. The appropriate sampling of plant and animal assemblages in highly dynamic ecosystems such as intertidal environments is an enduring problem. Ongoing work is focusing on mapping and registering multiple datasets collected over subsequent low tides to track the dynamics of biota in the area over varying timescales. Additionally, ongoing work is focusing on acquiring near-infrared images using a modified consumer grade camera that will compli-ment the visual images and provide additional data such as vege-tation, chlorophyll and algal biomass indices.
ACKNOWLEDGEMENTS
This work was supported in part by Australian Research Council and the New South Wales State Government.
REFERENCES
Aber, J., Aber, S. and Pavri, F., 2002. Unmanned Small-format Aerial Photography from Kites for Acquiring Large-scale, High-resolution, Multiview-angle Imagery. In: ISPRS Commission I/FIEOS 2002 Conference Proceedings.
Aber, J., Sobieski, R., Distler, D. and Nowak, M., 1999. Kite Aerial Photography for Environmental Site Investigations in Kansas. Kansas Academy of Science 102(1-2), pp. 57–67. Agarwal, S., Snavely, N., Seitz, S. and Szeliski, R., 2010. Bundle Adjustment in the Large. In: European Conference on Computer Vision.
tions. ISPRS Journal of Photogrammetry and Remote Sensing 65(1), pp. 538–549.
Furukawa, Y. and Ponce, J., 2010. Accurate, Dense, and Robust Multi-View Stereopsis. IEEE Trans. on Pattern Analysis and Ma-chine Intelligence 32(8), pp. 1362–1376.
Guichard, F., Bourget, E. and Agnard, J., 2000. High-resolution remote sensing of intertidal ecosystems: A low-cost technique to link scale-dependent patterns and processes. Limnology and Oceanography 45(2), pp. 328–338.
Horn, B. K. P., 1987. Closed-form solution of absolute orien-tation using unit quaternions. Journal of the Optical Society of America 4(4), pp. 629–642.
Johnson-Roberson, M., Pizarro, O., Williams, S. and Mahon, I., 2010. Generation and Visualization of Large-scale Three-dimensional Reconstructions from Underwater Robotic Surveys. Journal of Field Robotics 27(1), pp. 21–51.
Murphy, R. and Tolhurst, T., 2009. Effects of experimental ma-nipulation of algae and fauna on the properties of intertidal soft sediments. Journal of Experimental Marine Biology and Ecology 379(1-2), pp. 77–84.
Murphy, R., Tolhurst, T., Chapman, M. and Underwood, A., 2008. Spatial Variation of Chlorophyll on Estuarine Mudflats determined by Field-based Remote Sensing. Marine Ecology Progress Series 365(1), pp. 45–55.
Perkins, R., Honeywill, C., Consalvey, M., Austin, H., Tolhurst, T. and Paterson, D., 2003. Changes in microphytobenthic chloro-phyll a and EPS resulting from sediment compaction due to de-watering: opposing patterns in concentration and content. Conti-nental Shelf Research 23, pp. 575–58.
Sklaver, B., Manangan, A., Bullard, S., Svanberg, A. and Handzel, T., 2006. Rapid Imagery through Kite Aerial Photogra-phy in a Complex Humanitarian Emergency. International Jour-nal of Remote Sensing 27(21), pp. 4709–4714.
Snavely, N., Seitz, S. and Szeliski, R., 2008. Modeling the world from Internet photo collections. International Journal of Com-puter Vision 80(2), pp. 189–210.
Underwood, A., 2000. Experimental ecology of rocky intertidal habitats: what are we learning? Journal of Experimental Marine Biology and Ecology 250, pp. 51–76.
Vedaldi, A. and Fulkerson, B., 2008. VLFeat: An open and portable library of computer vision algorithms (http://www.vlfeat.org/).