Fusion of ALS Point Cloud and Optical Imagery for 3D Reconstruction of Building’s Roof
B. Hujebri a, *, F. Samadzadegana, H. Arefia
a Dept. of Geomatics Engineering, Faculty of engineering, University of Tehran
N. Kargar St. Jalale al e Ahmad St., Tehran: 14395515, Iran- (b.hujebry, samadz, hossein.arefi)@ut.ac.ir
KEY WORDS: Reconstruction, Building, LiDAR, Image, Segmentation, Mean-Shift
ABSTRACT:
Three-dimensional building models are important in various applications such as disaster management and urban planning. In this paper a method based on fusion of LiDAR point cloud and aerial image data sources has been proposed. Firstly using 2D map, the point set relevant to each building separated from the overall LiDAR point cloud. In the next step, the mean shift clustering algorithm applied to the points of different buildings in the feature space. Finally the segmentation stage ended with the separation of parallel and coplanar segments. Then using the adjacency matrix, adjacent segments are intersected and inner vertices are determined. In the other space, the area of any building cropped in the image space and the mean shift algorithm applied to it. Then,
the lines of roof’s outline edge extracted by the Hough transform algorithm and the points obtained from the intersection of these lines transformed to the ground space. Finally, by integration of structural points of intersected adjacent facets and the transformed points from image space, reconstruction performed. In order to evaluate the efficiency of proposed method, buildings with different shapes and different level of complexity selected and the results of the 3D model reconstruction evaluated. The results showed credible efficiency of method for different buildings.
* Corresponding author.
1. INTRODUCTION
Accurate and up-to-date 3D geo-spatial information, including building models, is quite valuable for several applications. A few examples where accurate digital building models are useful include the following: evaluation of the aftermath of natural disasters, search and rescue, urban planning, environmental studies, telecommunication network planning.
In recent years, by introducing the LiDAR system and using the 3D geo-referenced data, different methods have been proposed for 3D building modelling. In recent years, several methods have been proposed for 3D building reconstruction. The algorithms comprise methods that only employ LIDAR point cloud for model generation while some others use additional data sources such as aerial or satellite imagery. (Ma, 2006) proposed a methodology of 3D building model reconstruction will be examined based on the integration of aerial photographs and LIDAR data. The methodology is comprised of two elements. The first one is to reconstruct 3D building models from LIDAR data. Rough building models are the outcome of this step. The second element is to refine the rough models with information derived from aerial photographs. Cheng et al. proposed an approach by integrating aerial imagery and LiDAR data to reconstruct 3D building models (Cheng, Gong, Li, & Liu, 2011). In this approach, an algorithm for determination of principal orientations of a building was introduced and 3D boundary segments were then determined by incorporating LiDAR data and the 2D segments extracted from images, a strategy including automatic recovery of lost boundaries was finally used for 3D building model reconstruction. The focus of this study is to improve the quality of building boundaries, not building roofs. (Satari, 2012) proposed a multi-resolution hybrid approach for the reconstruction of building models from LiDAR data. The detection of the main roof planes is obtained
through a polyhedral approach, whereas the models of appended parts, are reconstructed by adopting a model-driven approach. Clustering of the roof points is based on the FCM. The verification of planes between multi-resolution spaces adopts a method based on a least squares SVM that, in the model-driven section, is applied for detecting types of projecting structures. Finally, the detection of boundary roof lines is obtained through a fuzzy Hough transform. (Awrangjeb, Zhang, & Fraser, 2012) proposed a method for automatic roof reconstruction by integrating LIDAR data and photogrammetric imagery. In the detection step, image lines are classified into
different classes. In the reconstruction step, lines in ‘roof edge’ and ‘roof ridge’ classes are primarily employed to fit the
LIDAR plane boundaries. (Arefi & Reinartz, 2013) also proposed a method for extraction of 3D building models from high resolution DSMs and orthorectified images produced from Worldview-2 stereo satellite imagery. Accordingly, a building block is divided into smaller parts according to the direction and number of existing ridge lines for parametric building reconstruction. The 3D model is derived for each building part, and finally, a complete parametric model is formed by merging the 3D models of the individual building parts. The edge information extracted from orthorectified image has been employed as additional source of information in 3D reconstruction algorithm.
Due to direct accessibility of 3D coordinate of LiDAR points,
planar patch’s mathematical equations of building roofs could
be determined accurately. However, extracting the edges and boundary of buildings with high accuracy from LiDAR points is a difficult task and will not be always precise. When points of some parts of the roof not exist or LiDAR point cloud density is low, this problem is more noticeable. In new aerial laser
scanning systems, in addition to using laser to adopt 3D point’s
cloud of surface features, equipped by high resolutions small International Archives of the Photogrammetry, Remote Sensing and Spatial Information Sciences, Volume XL-1/W3, 2013
format RGB camera. So besides spatial data of features, RGB and spectral information are also available. Since the resolution of the images is high, the building edges and the other man-made structures are detectable with a higher accuracy. In this paper a method proposed to integrate the LiDAR point cloud and aerial imagery.
2. PROPOSED METHOD FOR BUILDING RECONSTRUCTION
In this study, firstly by using 2D plane (building footprint), points located inside polygon of each building are extracted from the overall scatter, individually. In this research, to reconstruct the 3D model of building roofs, data-driven approach has been used. In data-driven methods, point’s segmentation is a fundamental step. Several algorithms have been proposed for segmenting the point cloud such as region growing (Jarząbek-Rychard, 2010), RANSAC based algorithms (Tarsha-Kurdi, Landes, & Grussenmeyer, 2008), 3D Hough transform (Tarsha-Kurdi & Grussenmeyer, 2007).
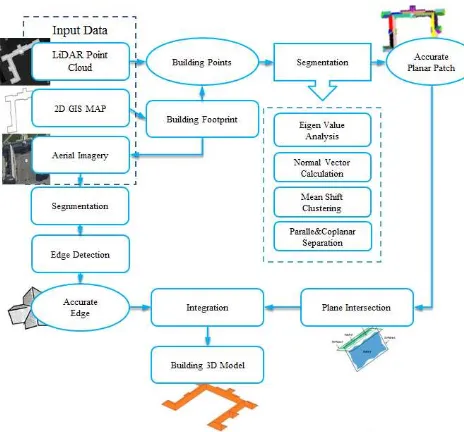
Figure 1. presents the proposed workflow for the generation of
building roof 3D models. Detailed explanations are given in the following sections.
Figure 1. Workflow for the proposed method 3D building roof
reconstruction.
In this research, to segmentation the different parts of the roof, clustering approach based on mean shift algorithm is used. This algorithm has been widely used in various fields of pattern recognition and remote sensing such as: image segmentation, object tracking etc. This algorithm is a nonparametric method therefore it is not necessary to know the priori information about the data. In the segmentation stage using mean shift clustering algorithm, different parts of the building roof which have a similar normal vector, are located in a same cluster. In the final stage of segmentation, the planes that are parallel or coplanar, with regard to other features (points distance from a fitted plane and 3D spatial position of points) are separated. After segmentation, by using the intersection points of adjacent facets, vertex and ridge line of roof could be calculated. On the other in the image space by applying mean shift algorithm, segmentation is performed on the image. Thereby,
small parts of the roof are removed and by applying edge detection algorithms, building outlines are identified. And in the next stage, by using Hough transform algorithm, edge lines of roof are extracted. In the final stage (3D reconstruction) using a combination of extracted outlines from the image and calculated vertex and ridges from LiDAR point cloud (two different roof structural information), 3D models of building roofs are produced.
2.1 Eigen Value Analysis
The normal of some points are either non-existent or ambiguous. Therefore, they should be detected and excluded from the subsequent clustering operation (Sampath & Shan, 2006). In this research by using eigenvalue analysis these points are detected and kept out from the following steps.
Figure 2. Eigenvalue Analysis. Planar Points (red) Non-Planar Points (blue)
2.2 Normal Vector
In order to apply the mean-shift method to clustering, a feature space needs to be built up first. In this paper PCA (Liu & Mason, 2009) algorithm has been used for calculate the normal vector.
Figure 3. Normal Vector calculation using PCA
2.3 Mean Shift Algorithm
Mean-shift is an algorithm for nonparametric density gradient estimation using a kernel. A mode means a local density maximum. It was first proposed by Fukunaga and Hostetler to calculate density gradient (Fukunaga & Hostetler, 1975). The main idea behind mean shift is to treat the points in the d-dimensional feature space as an empirical probability density function where dense regions in the feature space correspond to the local maxima or modes of the underlying distribution (Derpanis, 2005). For each data point in the feature space, one International Archives of the Photogrammetry, Remote Sensing and Spatial Information Sciences, Volume XL-1/W3, 2013
performs a gradient ascent procedure on the local estimated density until convergence. The stationary points of this procedure represent the modes of the distribution. Furthermore, the data points associated (at least approximately) with the same stationary point are considered members of the same cluster.
Given n data points xi ϵ Rd, the multivariate kernel density
estimate using a radially symmetric kernel (e.g., Epanechnikov and Gaussian kernels), K(x), is given by,
(1)
where h (termed the bandwidth parameter) defines the radius of kernel. The radially symmetric kernel is defined as,
(2)
Taking the gradient of the density estimator (1) and some further algebraic manipulation yields,
(3)
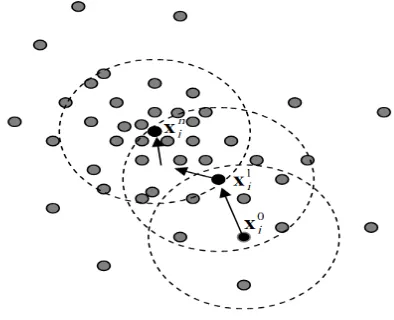
where g(x) = −k’ (x) denotes the derivative of the selected kernel profile. The second term, called the mean shift vector, m, points toward the direction of maximum increase in density and is proportional to the density gradient estimate at point x obtained with kernel K. The mean shift procedure for a given point xi is as follows: (see Figure 2):
1. Compute the mean shift vector m(xit).
2. Translate density estimation window: xi t+1
= xi t
+ m(xi t
).
3. Iterate steps 1. and 2. until convergence, i.e., = 0
Figure 4. Mean shift procedure
Figure 5 present the clustering result. As shown in this figure facets that have similar normal vector are in the same cluster. These similar clusters are grouped in two different types of facets which one of them is parallel facet (green facet) and other one is coplanar facets (two middle parts of red cluster).
Figure 5. Clustering results
2.4 Parallel and Coplanar Separation
Since in the clustering process only normal vector is used, the facets with similar normal vectors are placed in the same cluster, however all points which have similar normal vector, are not belong to the same facets. At the end of the aforementioned clustering process, we have the directions of all the roof planes, described by their normal vectors. Each cluster actually describes a family of parallel planes with the equation
ax + by + cz − d =0. The value of d can be used to further segment the parallel planes. Lidar points that yield similar d values are regarded to belonging to the same planar segment. Finally, a building roof can have two or more planar segments that are mathematically the same, but spatially separated. Such coplanar segments could be separated in the original data space based on the concept of density clustering and connectivity analysis (x,y,z).
Figure 6. Final results of segmentation
2.5 Reconstruction
Building roof hypotheses mathematical equation were generated from the LiDAR data through plane segmentation and facet intersection. However one of the most common problems encountered when using LiDAR data within a data-driven approach is determining a way to regularize the LiDAR-derived boundaries, because of LiDAR point cloud limitations in boundary determination. Therefore in this research building roof edges were extracted from high resolution aerial image, using Hough Transform.
The first step in the roof reconstruction process is to generate a topologic framework of adjacency constraints for all the roof plane segments (Sampath, 2010). This is accomplished by generating an adjacency matrix. In the next step, the adjacency constraints are used to determine the internal vertices of the roof.
The adjacency matrix maps the adjacency of each plane segment International Archives of the Photogrammetry, Remote Sensing and Spatial Information Sciences, Volume XL-1/W3, 2013
on the roof. The primary measure of adjacency is the distance between two roof segments, which is defined as the minimum distance of all possible point combinations between the two segments (Sampath & Shan, 2010).
(4)
Here d(P,Q ) is the distance between the two planar segments P and Q, d(pi,qi) stands for the distance between any two points respectively in the boundary of the segments P and Q.
Figure 7. (a) Building roof, (b) Adjacency matrix
If the equations of planes 1 through 3 are given by:
1 1 1 1
2 2 2 2
3 3 3 3
0
0
0
A X B Y C Z D
A X B Y C Z D
A X B Y C Z D
(5)
The solution to vertex E is determined by simultaneously solving the equations of correspondence planes:
3 3 1 1 1 1 1
2 2
3 2
3 2
F
X A B C D
Y A B C D
Z A B C D
(6)
In other side on image space, using 2D map information and point cloud height, the image of each building are cropped from overall image and then Mean Shift segmentation algorithm is applied. Then roof edges that are in buffer zone near the building outline, detected and then hough line extraction algorithm is applied on outline edges. Then the resulted points, by monoplotting equations and correspond segment equation of any point in Lidar space, will transform to the ground. Finally, by integration of inner vertices from LiDAR and outer points from image building models are reconstructed.
3. EXPERIMENT AND RESULT
The input LIDAR data in this study were obtained by Topscan using ALTM 1225 airborne laser scanner system. These data are irregular structures and average density of points is one point per square meter. This data is related to the city of Stuttgart in Germany that shown in Figure 8.
a b
Figure 8. Data set; (a) LiDAR point cloud; (b) Aerial Image;
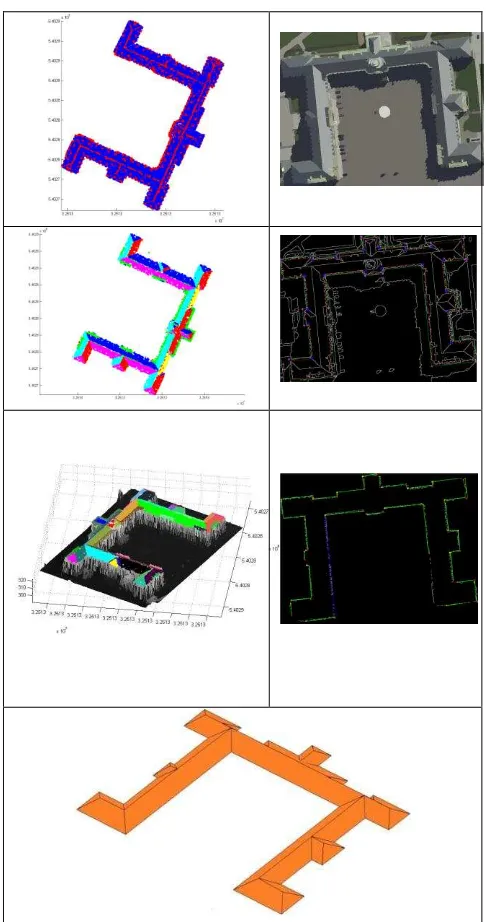
Figure 9 illustrates different steps of proposed method to 3D roof reconstruction of sample building.
Figure 9. 3D building roof reconstruction; International Archives of the Photogrammetry, Remote Sensing and Spatial Information Sciences, Volume XL-1/W3, 2013
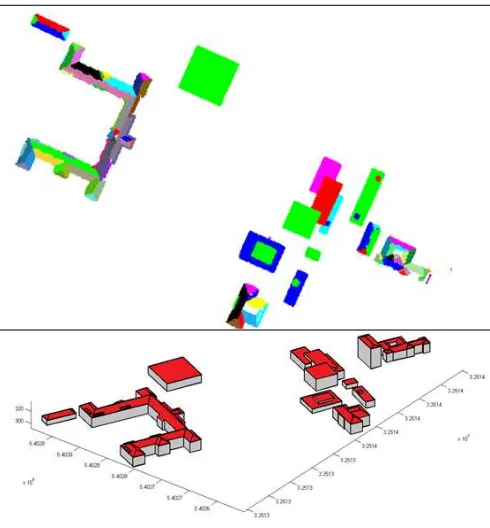
In order to reconstruct the 3D model of the building roof, several buildings with different shapes, sizes and levels of complexity are selected. Consequently, according to obtained results of proposed method on buildings with different complexity levels reflect the ability of this method to accurately 3D modelling of buildings.
Figure 10. (Top) Segmentation results (Bottom) Reconstruction results
4. CONCLUSION
An algorithm for 3D reconstruction of the buildings based on LiDAR point cloud and aerial imagery is proposed which uses the advantage of both data sources, thus accurate planar patches from LiDAR and edge information from aerial image. In order to evaluate the proposed method, several different buildings were selected. The performance of proposed method in dealing with different types of buildings was significant. Also in this paper Mean Shift algorithm is used, that is a non-parametric
method, hence it doesn’t require priori knowledge about data distribution and cluster shapes.
REFERENCES
Arefi, H., & Reinartz, P. (2013). Building Reconstruction Using DSM and Orthorectified Images, 1681–1703. doi:10.3390/rs5041681
Awrangjeb, M., Zhang, C., & Fraser, C. S. (2012). AUTOMATIC RECONSTRUCTION OF BUILDING ROOFS THROUGH EFFECTIVE INTEGRATION OF LIDAR AND MULTISPECTRAL IMAGERY. ISPRS Annals of the Photogrammetry, Remote Sensing and Spatial Information Sciences (Vol. I, pp. 203–208).
Cheng, L., Gong, J., Li, M., & Liu, Y. (2011). 3D Building Model Reconstruction from Multi-view Aerial Imagery and Lidar Data, 77(2), 125–139.
Derpanis, K. G. (2005). Mean Shift Clustering, 1(x), 1–4.
Fukunaga, K., & Hostetler, L. D. (1975). The Estimation of the Gradient of a Density Function , with Applications in Pattern - Recognition, lim(4), 32–40.
Jarząbek-Rychard, M. (2010). IMPLEMENTATION OF 3 D POINT CLOUDS SEGMENTATION BASED ON PLANE GROWING METHOD. Practical Aspects of Geodesy and Cartography, 1–7.
Liu, J. G., & Mason, P. J. (2009). Essential Image Processing and GIS for Remote Sensing.
Ma, R. (2006). Building model reconstruction from data integration,
Sampath, A. (2010). SEGMENTATION AND
RECONSTRUCTION OF POLYHEDRAL BUILDINGS
FROM AERIAL LIDAR POINT CLOUD. Purdue University,West Lafayette, Indiana.
Sampath, A., & Shan, J. (2006). Clustering based planar roof extraction from lidar data. ASPRS Annual Conference. Reno, Nevada.
Sampath, A., & Shan, J. (2010). Segmentation and Reconstruction of Polyhedral Building Roofs From Aerial Lidar Point Clouds. IEEE TRANSACTIONS ON GEOSCIENCE AND REMOTE SENSING, 48(3), 1554–1567.
Satari, M. (2012). A MULTI-RESOLUTION HYBRID
APPROACH FOR BUILDING MODEL
RECONSTRUCTION, 27(September), 330–359. doi:10.1111/j.1477-9730.2012.00688.x
Tarsha-Kurdi, F., & Grussenmeyer, P. (2007). HOUGH-TRANSFORM AND EXTENDED RANSAC ALGORITHMS FOR AUTOMATIC DETECTION OF 3D BUILDING ROOF PLANES FROM LIDAR DATA. Science And Technology, XXXVI(1), 407–412. Retrieved from
Tarsha-Kurdi, F., Landes, T., & Grussenmeyer, P. (2008). EXTENDED RANSAC ALGORITHM FOR AUTOMATIC DETECTION OF BUILDING. The photogrammetric journal of Finland, 21, 97–109.