UAV-BORNE THERMAL IMAGING FOR FOREST HEALTH MONITORING:
DETECTION OF DISEASE-INDUCED CANOPY TEMPERATURE INCREASE
M. Smigaj a, *, R. Gaulton a , S. L. Barr a , J. C. Suárez b
a School of Civil Engineering and Geosciences, Newcastle University, Newcastle upon Tyne, NE1 7RU, UK ITU, Civil Engineering - (m.smigaj, rachel.gaulton, stuart.barr)@ncl.ac.uk
b Forest Research, Northern Research Station, Roslin, Midlothian, EH25 9SY, UK - [email protected]
Commission VI, WG VI/4
KEY WORDS: Stress detection, unmanned aerial vehicle, unmanned aerial system, UAV, UAS, camera calibration.
ABSTRACT:
Climate change has a major influence on forest health and growth, by indirectly affecting the distribution and abundance of forest pathogens, as well as the severity of tree diseases. Temperature rise and changes in precipitation may also allow the ranges of some species to expand, resulting in the introduction of non-native invasive species, which pose a significant risk to forests worldwide. The detection and robust monitoring of affected forest stands is therefore crucial for allowing management interventions to reduce the spread of infections.
This paper investigates the use of a low-cost fixed-wing UAV-borne thermal system for monitoring disease-induced canopy temperature rise. Initially, camera calibration was performed revealing a significant overestimation (by over 1 K) of the temperature readings and a non-uniformity (exceeding 1 K) across the imagery. These effects have been minimised with a two-point calibration technique ensuring the offsets of mean image temperature readings from blackbody temperature did not exceed ± 0.23 K, whilst 95.4% of all the image pixels fell within ± 0.14 K (average) of mean temperature reading.
The derived calibration parameters were applied to a test data set of UAV-borne imagery acquired over a Scots pine stand, representing a range of Red Band Needle Blight infection levels. At canopy level, the comparison of tree crown temperature recorded by a UAV-borne infrared camera suggests a small temperature increase related to disease progression (R = 0.527, p = 0.001); indicating that UAV-borne cameras might be able to detect sub-degree temperature differences induced by disease onset.
1. INTRODUCTION
Tree growth and survival depends on climatic conditions, which influence processes like photosynthesis and respiration. Thus, change in climate and weather conditions will inevitably influence forest health and growth. As temperature and moisture affect pathogen growth, reproduction and infection, climate changes will also indirectly affect the distribution and abundance of forest pathogens, as well as the severity of tree diseases (Ray, 2010). The pathogens requiring moist conditions will have an increased impact on host trees where wetter future conditions are predicted, e.g. red band needle blight (Dothistroma septosporum) in United Kingdom; whilst pathogens primarily attacking stressed trees will have an increased impact on hosts in drier regions (Sturrock, 2011). Temperature rise and changes in precipitation may also allow the ranges of some species to expand, resulting in the introduction (usually initiated by trade of live plant material and timber) of non-native invasive species to new regions. These pose a significant risk to forests worldwide, having the potential to cause the death of many trees (Sturrock, 2011). The detection and monitoring of affected forest stands is therefore crucial for allowing management interventions to reduce the spread of infections.
Stresses induced by an invasion of insects or onset of disease manifest themselves in tree foliage, and may result in a variety of changes to the plant’s physiological processes, such as photosynthesis and respiration. Key symptoms include
* Corresponding author
breakdown of photosynthetic pigments, needle loss and decreases in water uptake (Wulder, 2003). When a plant is under moderate stress, stomatal closure and reduction in photosynthetic activity also occurs, whilst with the onset of severe water stress, a general disruption of metabolism develops, which is signalled by high rates of respiration. The closure of stomatal apertures is a defence mechanism which not only helps reduce water losses, but also prevents the entry of microbes and host tissue colonisation. It was also found to cause an increase in leaf and canopy temperature (Moshou, 2012); a change that can often be detected by thermal imaging at the leaf level at an early stage of infection (Chaerle, 1999; Lindenthal, 2005).
There has been limited research into the use of thermal remote sensing approaches for tree health monitoring. The main challenge arises from the need for high spatial resolution data to identify individual diseased trees or to monitor areas of fragmented forest cover, such as those typical for the UK. However, such data is typically obtained with low temporal frequency, due to the high costs of aerial imagery. In addition, cloud cover often significantly restricts the availability of suitable data. Newly emerging technologies, such as small unmanned aerial vehicles (UAVs), could supplement aerial data acquisition, but sensor development is still in its early stages. This paper examines the performance of a low-cost fixed-wing UAV-borne The International Archives of the Photogrammetry, Remote Sensing and Spatial Information Sciences, Volume XL-3/W3, 2015
thermal system for detection of canopy temperature differences related to a disease onset.
2. SYSTEM SPECIFICATION 2.1 UAV Platform
The unmanned aerial vehicle used for this study was a fixed-wing QuestUAV Qpod (Figure 1) capable of performing 15 minute long flights. It has a wing-span of 2.3 metres and take-off weight of 5 kg. It was developed to carry thermal, RGB (red, green and blue) and NIR (near-infrared) sensors, and is equipped with gimbals minimising cameras movements in the roll axis during the flight.
Figure 1. QuestUAV Qpod fixed-wing UAV.
2.2 Sensors
The thermal sensor used for this study is a weight-optimised Optris® PI-450 longwave infrared camera with manual focus. It is a Focal Plane Array (FPA) based on uncooled microbolometers, equipped with a 38° x 29° field-of-view lens. The spectral range is 7.5 – 13 µm, with a temperature range of -20 – 900°C (accuracy: ±2°C, thermal sensitivity: 40 mK) (Table 1). The camera is operated through a miniaturised lightweight PC (with a Windows XP Professional operating system). The whole kit weights 380 g, making it ideally suited for UAV-borne applications.
Detector FPA, uncooled (25 µm x 25 µm) Lens (FOV) 38° x 29° FOV / f = 15 mm Optical resolution 382 x 288 pixels Spectral range 7.5 – 13 µm Thermal sensitivity 40 mK Temperature range -20 – 100 °C
Accuracy ±2 °C or ±2 %, whichever is greater
Total weight 320 g
Table 1. Specifications of OPTRIS PI450 thermal sensor.
In addition, a NIR-modified Panasonic DMC-LX5 compact digital camera (with external NIR filter) was deployed on the UAV. The DMC-LX5 has a resolution of 10.1 megapixels (3648 x 2736 pixels) with a 1/1.63″ CCD sensor, and it weighs 271 g.
3. THERMAL SENSOR CALIBRATION The Optris® thermal camera has been calibrated in laboratory conditions against a thermally-controlled blackbody radiation source. This comprised of a thermo-electric flat plate blackbody, utilising thermo-electric heating devices to control the heat transfer between a high-conductivity flat plate (coated with a high-emissivity paint) and a heat exchanger. The calibration set-up is presented in Figure 2.
Figure 2. Camera calibration against a blackbody.
3.1 Temperature Drift over Time
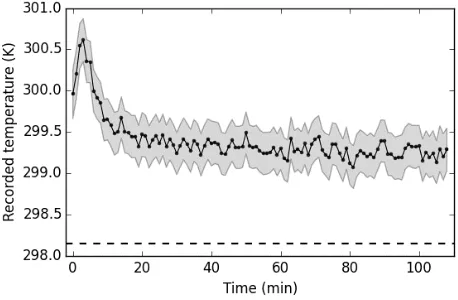
The first stage of calibration was the analysis of camera readings stability over time. For this purpose, the camera was set to store one raw image of a blackbody at 298.15 K (25 °C) every minute over the course of 109 minutes. A significant temperature shift was observed over the course of the first 30 minutes (Figure 3), indicating a need for stabilisation. Moreover, after the readings stabilised, an overestimation of >1 K of the blackbody temperature throughout the image was revealed.
Figure 3. Mean image temperature of a blackbody at 298.15 K (dashed line), as recorded by a camera over time. Shaded areas
represent one-sigma standard deviation.
Further investigation of temperature readings at a pixel level showed a non-uniformity in the photo response of the detectors in the array. Responses over time at four sample pixels from the image centre, top left, top right and bottom right corners are presented in Figure 4. The temperature readings across the imagery vary significantly, with differences exceeding 1 K between the top left and top right image corners. The pattern The International Archives of the Photogrammetry, Remote Sensing and Spatial Information Sciences, Volume XL-3/W3, 2015
of change in reading offsets over time also tends to vary across the selected pixels, making the calibration more challenging.
Figure 4. Temperature readings over time of a blackbody at 298.15 K (dashed line), as recorded by sample pixels from the image centre (blue), top left corner (orange), top right
corner (red), and bottom right corner (green).
3.2 Non-uniformity Correction
The non-uniformity across the image can be corrected using a two-point calibration technique (Ryerson, 1999), which requires measuring a blackbody at two distinct and known temperatures. If the output digital numbers are linearly related to the input radiance, then for a given wavelength:
(1)
where λ = wavelength
R = spectral radiance emitted by the target surface G = spectral response (gain) of the sensor DN = digital numbers recorded by the sensor
O = spectral radiance emitted by the sensor’s inner parts (offset)
If the radiances of two blackbodies at different known temperatures (“cold” and “hot”) are given by:
, ; , (2)
where Rc = band-integrated “cold” blackbody radiance Rh = band-integrated “hot” blackbody radiance Tc = temperature of “cold” blackbody Th = temperature of “hot” blackbody P = Planck blackbody radiance
then by measuring their image intensities, there is enough information to solve Equation 1 for gain (G) and offset (O) parameters:
; (3)
where Rh = band-integrated “hot” blackbody radiance Rc = band-integrated “cold” blackbody radiance DNh = digital number for image of “hot” blackbody DNc = digital number for image of “cold” blackbody
However, as equation 1 is sensitive to any non-linearity between the input radiance and output data numbers, the camera response was first checked by recording image intensities of a blackbody heated to a wide range of temperatures (i.e. 25 to 60 °C).
As presented in Figure 5, the average and pixel level sensor responses are linear in terms of emitted flux versus digitised flux over the measured temperature range.
Figure 5. Mean image values of a blackbody heated to a wide range of temperatures; R2 = 0.99995, p < 0.001.
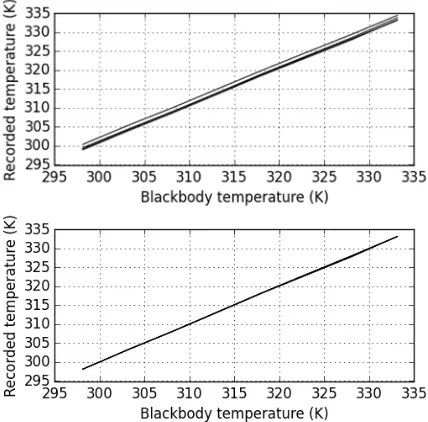
Imagery of the blackbody at 25 °C and 60 °C have been used to calculate the gain and the bias of each detector across the array. In order to minimise the difference in offsets between different pixels of the imagery observed over time, averages of ten pictures of the blackbody were used. The gain and offset matrices were then used to calibrate all the detectors across the array so that they produce a radiometrically accurate and uniform reading at the two reference temperatures, as presented in Figure 6.
Figure 6. Central, top left, top right and bottom right corner image values of a blackbody heated to a wide range of temperatures prior to (upper) and after (lower) calibration.
In order to check the effectiveness of the derived corrections, they were applied to a separate set of the imagery of a blackbody at a known temperature, which was used to investigate temperature drift over time (section 3.1). As presented in Figure 7, the applied correction accounted for an overestimation (>1 K) in the average temperature readings; the imagery are now representing the actual blackbody temperature with maximum offsets of ± 0.23 K (once sensor stabilisation is achieved).
Figure 7. Corrected mean image temperature of a blackbody at 298.15 K (dashed line), as recorded by a camera over time.
Shaded areas represent one-sigma standard deviation.
The variation in temperature readings across the imagery has also been minimised, as represented by corrected values recorded at four sample pixels from the image centre, top left, top right and bottom right corners (Figure 8). However, some variation between the selected pixels remained due to the inconsistent pattern of change, hindering full corection of the sensor’s non-uniformity.
Figure 8. Corrected temperature readings over time of a blackbody at 298.15 K (dashed line), at sample pixels from the
image centre (blue), top left corner (orange), top right corner (red), and bottom right corner (green).
Nevertheless, the applied non-uniformity correction allowed us to obtain consistent temperature readings across an image (e.g. Figure 9), and provided with useful information about the capabilities of the Optris® thermal sensor, and expected errors. The analysis of corrected images (excluding the first 30 minutes) showed that even though the average maximum range of values of corrected imagery was 0.72 K, 95.4% of the pixels fell within ± 0.14 K (average) of mean temperature reading.
Figure 9. Image offsets from true temperature of a blackbody at minute 40, prior to (left) and after (right) applying corrections.
4. DATA ACQUISITION 4.1 Study Area
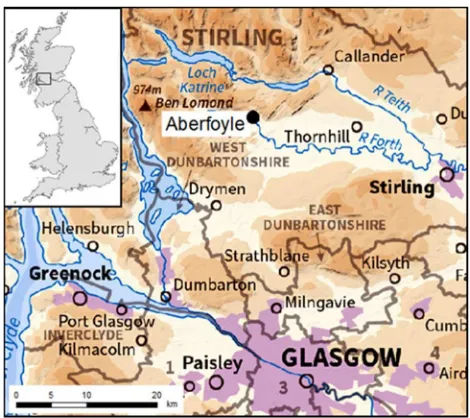
The study was located in the Queen Elizabeth Forest Park near Aberfoyle, central Scotland (Figure 10); a plantation forest managed by Forestry Commission. Within the forest, five research plots have been established in Scots and Lodgepole pine (Pinus sylvestris and contorta) stands representing a range of Red Band Needle Blight infection levels. Within each of the plots, positions of approximately 40 sample trees were measured with the aid of land surveying methods.
Figure 10. Location of the study area – Queen Elizabeth Forest Park near Aberfoyle, United Kingdom. © Crown Copyright and Database Right 2015. Ordnance Survey (Digimap Licence).
4.2 Remote Sensing Data
Over the summer 2014, airborne LiDAR (8.5 points per m2), hyperspectral and thermal (nominal spatial resolution: 2 m) datasets were acquired by the NERC Airborne Research and Survey Facility (ARSF).
Simultaneously, late in the afternoon, a test NIR and thermal dataset from the UAV system was collected for two of the research plots (one instrumented). The data was collected at the height of 122 m, resulting in a pixel size of 5 cm for NIR dataset, and 25 cm for thermal dataset. To minimise blur resulting from the UAV’s movement, the imagery over the areas of interest was collected only whilst flying into the wind.
4.3 Ground Measurements
To accompany the remote sensing data acquisition, for each of the sample trees, extensive structural measurements were collected. One of the quantified variables was the severity of red band needle blight infection, which was assessed visually by estimating the proportion of infected to uninfected tree crown, following guidelines from Bulman (2004). Infection level was expressed as percentage of total unsuppressed crown volume in 10% increments (i.e. 10, 20 …), where a score of 20 indicates that 20% of crown was diseased. In addition, a 1% score was given to trees where the disease was detectable at a trace level. Bare branches caused by needle loss, as well as sprigs or leaves The International Archives of the Photogrammetry, Remote Sensing and Spatial Information Sciences, Volume XL-3/W3, 2015
on the main stem below the lowest twig were excluded from the estimation. Additionally, measurements of the diameter at breast height (DBH), crown spread in two directions, height of the tree and the uncompacted live crown ratio were performed. To compliment this, a number of needle samples were collected for leaf water content and leaf spectral reflectance measurements.
Within two of the plots, four selected trees have been instrumented with multi-depth sapflow sensors to monitor the flow of water within the trunk. Average temperature of the upper canopy is constantly monitored using a Campbell IR 120 narrow field infrared sensor. Soil moisture is monitored through TDR sensors to detect moisture deficits that could cause anomalous physiological changes, and Skye sensors are continually monitoring Photochemical Reflectance Index (a measure of photosynthetic light use efficiency) based on simultaneous measurements of incident and reflected light. Together, these measurements provide a detailed estimate of physiological processes (water fluxes, photosynthesis and thermal characteristics linked to transpiration) for the instrumented trees.
5. DATA PROCESSING 5.1 Geometric Correction
Geometric correction of the UAV-borne datasets was achieved by registration to a canopy height model (CHM) derived from LiDAR. CHM is a digital surface model normalised for differences in ground elevation. A local maximum filter was then developed to identify tree tops within the canopy height model, and aid a “tree to tree” registration of thermal and NIR imagery (Figure 11). This allowed for identification of the surveyed trees on the acquired imagery.
Figure 11. Georeferencing process of UAV-borne imagery: 1) canopy height model derivation, 2) tree tops identification, 3)
registration to CHM on “tree to tree” basis.
5.2 Preliminary Canopy Temperature Analysis
The aforementioned geometric correction method allowed for identification of the surveyed trees on UAV-borne imagery. Their positions along with the associated disease levels are shown on georeferenced thermal imagery in Figure 12.
Figure 12. Survey trees distribution with their estimated disease levels, on georeferenced thermal UAV-borne imagery.
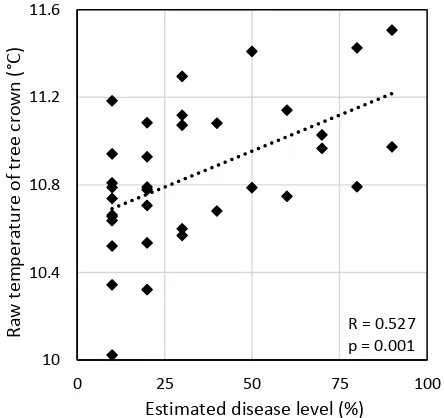
These disease levels have been compared against the obtained raw canopy temperature values (prior to atmospheric correction). The canopy temperatures of trees of interest have been extracted by averaging at least six central pixels (excluding areas which could have been directly influenced by the understorey vegetation, i.e. canopy edges) of each of the tree crowns. A moderate positive correlation (R = 0.527, p = 0.001) on a sub-degree level was obtained between the tree temperature and the disease progress, as presented in Figure 13. This suggests that UAV-borne cameras might be able to detect sub-degree temperature differences induced by a disease onset.
Figure 13. The observed relationship between the raw canopy temperature values and the estimated disease level in one plot.
6. CONCLUSIONS AND FUTURE WORK Stress induced by an invasion of insects or onset of disease leads (among other symptoms) to stomatal closure, and consequently to an increase in leaf and canopy temperature. This temperature rise can often be detected on a leaf level at an early stage
of infection by thermal imaging. However, there has been limited research into the use of thermal remote sensing approaches for tree health monitoring.
This paper investigated the use of a low-cost fixed-wing UAV-borne thermal system for monitoring disease-induced canopy temperature rise. Initially, camera calibration was performed revealing a significant overestimation of the temperature readings and a non-uniformity across the imagery. These effects have been minimised with a two-point calibration technique, using imagery of a blackbody at two distinct and known temperatures. Furthermore, temporal changes in the sensor response have been observed, indicating a need for stabilisation (i.e. 30 minutes waiting time prior to use).
The derived calibration parameters were applied to a test data set of UAV-borne imagery acquired over a Scots pine stand, representing a range of Red Band Needle Blight infection levels. At canopy level, the comparison of tree crown temperature recorded by a UAV-borne infrared camera suggests a small temperature increase related to the disease progress.
The main difficulty in using the thermal imagery for stress detection is that the plant temperature at a canopy level is not only affected by transpiration rates, but also by environmental factors. These include variables such as air temperature, humidity, radiation and wind speed (Leinonen, 2006). In order to determine the influence of timing and atmospheric conditions on the signal, further flights over the survey plots will take place during summer 2015 at different times of the day, and at various atmospheric conditions.
ACKNOWLEDGEMENTS
The research presented was funded by Natural Environment Research Council (NERC) – studentship No. NH/104540921. Airborne data was provided by NERC Airborne Research and Survey Facility (ARSF) grant – GB 14-04; access to specialist equipment was supported by NERC Field Spectroscopy Facility (FSF) loan – 710.114. Assistance provided by Christopher J. MacLellan with camera calibration was greatly appreciated. Substantial field help was given by Elias Berra, Maria Valasia-Peppa, Georgios Xenakis and Mark Danson. Many thanks to Forest Research and Forestry Commission for assistance and access to sample forest plots.
REFERENCES
Bulman, L.S., 2004. Assessment and Control of Dothistroma Needle Blight. Forest Research Bulletin No. 229. New Zealand Forest Research Institute: Rotorua, New Zealand.
Chaerle, L., 1999. Presymptomatic visualization of plant-virus interactions by thermography. Nat Biotech, 17(8), 813 816.
Leinonen, I., 2006. Estimating stomatal conductance with thermal imagery. Plant, Cell & Environment, 29(8), pp. 1508-1518.
Lindenthal, M., 2005. Effect of Downy Mildew Development on Transpiration of Cucumber Leaves Visualized by Digital Infrared Thermography. Phytopathology, 95(3), pp. 233 240.
Moshou, D., 2012. Multisensor Fusion of Remote Sensing Data for Crop Disease Detection. In: Geospatial Techniques for Managing Environmental Resources, Springer Netherlands, pp. 201-219.
Ray, D., 2010 Climate change: impacts and adaptation in England’s woodlands. Forestry Commission Research Note 201. Forest Research: Roslin, United Kingdom.
Rencz, A. N., 1999. Remote Sensing for the Earth Sciences. In: Manual of Remote Sensing, 3rd ed., Vol. 3, John Wiley & Sons, pp. 59-110.
Sturrock, R. N., 2011. Climate change and forest diseases. Plant Pathology 60(1), pp. 133-149.
Wulder, M., 2003. Remote Sensing of Forest Environments: Concepts and Case Studies, Springer US, pp. 447-467.