GLOBAL-SCALE OBJECT DETECTION USING SATELLITE IMAGERY
Raffay Hamid, Stephen O’Hara, Mark Tabb
DigitalGlobe Inc.
12076 Grant Street Thornton, Colorado, USA. {Raffay.Muhammad, Stephen.OHara, mtabb}@digitalglobe.com
Commission VI, WG VI/4
KEY WORDS:Object Detection, Large-Scale Learning, High-Dimensional Image Codes, Crowd-Sourced Training Labels
ABSTRACT:
In recent years, there has been a substantial increase in the availability of high-resolution commercial satellite imagery, enabling a variety of new remote-sensing applications. One of the main challenges for these applications is the accurate and efficient extraction of semantic information from satellite imagery. In this work, we investigate an important instance of this class of challenges which involves automatic detection of multiple objects in satellite images. We present a system for large-scale object training and detection, leveraging recent advances in feature representation and aggregation within the bag-of-words paradigm. Given the scale of the problem, one of the key challenges in learning object detectors is the acquisition and curation of labeled training data. We present a crowd-sourcing based framework that allows efficient acquisition of labeled training data, along with an iterative mechanism to overcome the label noise introduced by the crowd during the labeling process. To show the competence of the presented scheme, we show detection results over several object-classes using training data captured from close to200cities and tested over multiple geographic locations.
1. INTRODUCTION
Over the years, there has been a tremendous increase in both the amount and resolution of satellite imagery (Doe, 2014). This growth has resulted in several novel application opportunities, in-cluding everything from precision agriculture (Yang et al., 2013) to automatic construction of3-D terrain models (Maas, 2005). The key challenge shared among all these applications is the ac-curate and efficient extraction of semantic information from satel-lite imagery. In this work we focus on a particular instance of such semantic information related to the accurate and efficient detection of key objects in a region.
DigitalGlobe operates the world’s largest constellation of com-mercial imaging satellites, which collect over 2.5 million square kilometer of high resolution (better than60cm) imagery each day. In addition, we have a large-scale image archive that we are able to draw upon, with most places on the globe represented with a diversity of seasonal, atmospheric, and environmental condi-tions. We have developed a detection framework which is readily scalable to run on our entire daily imagery take, and also exploits our extensive image archive in constructing training data.
While automatic object detection from satellite imagery has been explored in the past (Yang and Newsam, 2010) (Risojevi´c et al., 2013) (Cheriyadat, 2014) (Drozda et al., 2013), we take on this challenge in a more detailed manner that is different from the pre-vious efforts in several important ways. These include the scale of the problem, the number of object classes (see Figure 1), the use of crowd-sourcing for the acquisition and curation of labeled training data, and a focus on detection as opposed to multi-class classification.
Given the high variance in the chromatic appearance of objects over different geographic locations (see Figure 2), using edge-based characteristics of objects is a natural choice for learning robust classifiers (Yang and Newsam, 2010) (Liu et al., 2011). While previous approaches have focused on using such edge-based characteristics directly in a bag-of-words framework, we
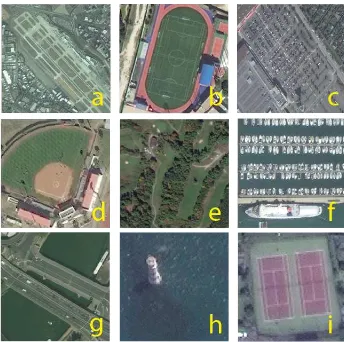
Figure 1: Examples of9of the object classes we consider in our data-set, includinga: Runway,b: Soccer Field,c: Parking Lot,d: Baseball field,e: Golf course,f: Pier,g: Bridge,h: Lighthouse, andi: Tennis court.
use a more sophisticated feature encoding scheme before utiliz-ing the codes in a bag-of-features framework. The use of this improved coding scheme makes the presented framework more robust to variances in object appearance due to varying illumina-tion, climate and terrain conditions.
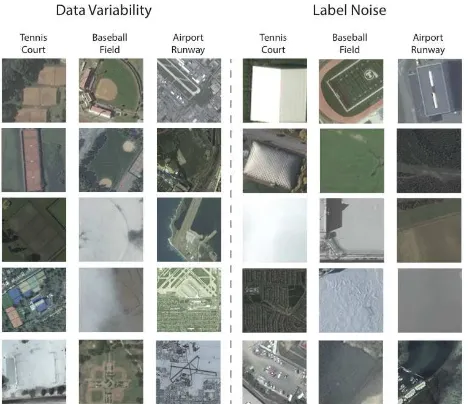
Figure 2: a- Example instances from three of the considered classes are shown to represent the appearance variability present in the training data. b- Example instances of wrongly labeled training points in the OSM database are shown to give a sense of the label-quality of the training data.
finally converge to a sufficiently-accurate detector adapted to the characteristics of a particular geographic area. Note that by boot-strapping the learning process with the labels from OSM, we sig-nificantly reduce the amount of curation required from the crowd during detector adaptation, resulting in an efficient and scalable training framework. Also note that the the labels from OSM can be noisy (see Figure 2), and therefore may require some initial curation to reduce label noise.
2. RELATED WORK
Multi-class image classification (Haralick et al., 1973) (Deng et al., 2009) (Krizhevsky et al., 2012) (Harsanyi and Chang, 1994) and object detection (Papageorgiou and Poggio, 2000) (Viola and Jones, 2001) (Mohan et al., 2001) have generated substantial re-search interest over the last few decades. A similar set of ex-plorations has been done relating to satellite imagery (Yang and Newsam, 2010) (Risojevi´c et al., 2013) (Cheriyadat, 2014) (Drozda et al., 2013). This work is an extension of such previous bodies of work where we focus more on the detection and large-scale aspects of the problem.
An important advancement in image representation has been the development of texture-based image descriptors (Lowe, 1999) (Bay et al., 2006) (Rublee et al., 2011). Given their tolerance to factors such as rotation and illumination changes, these de-scriptors have been successfully used to classify images in a bag-of-visual words representation. One limitation of bag-bag-of-visual words models is that they discard the spatial locations of the features, relying only on the relative frequencies of the visual words in the representation. Spatial pooling has emerged as way to retain much of the important relative positional information of the feature descriptors without overly complicating the repre-sentation (Lazebnik et al., 2006) (Grauman and Darrell, 2005). These approaches have been further improved by schemes that utilize distance based soft-assignments for descriptor quantiza-tion (Wang et al., 2010) (Liu et al., 2011). In this work, we use locally linear codes (LLC) (Wang et al., 2010) and spatial pyra-mids (Lazebnik et al., 2006) for image encoding.
One way to mitigate the large-scale labeling needs of our prob-lem is to rely upon crowd-sourcing to obtain training data. Like several other applications (Yuen et al., 2011), crowd-sourcing has found its use in generating labels in satellite imagery (Fritz et al., 2009) (Heipke, 2010). However, unlike previous works, here we focus on utilizing such data for the purposes of learning and re-fining models for object detection.
3. COMPUTATIONAL FRAMEWORK
Given the scale of the problem at hand, we generate un-curated training data by querying the OSM database to locate objects of interest in a multi-petabyte historical image archive. We learn an initial set of object models from the OSM-derived uncurated training samples, and use the results of these models to bootstrap the creation of curated data. This process dramatically reduces the size of the imagery the crowd needs to observe in order to generate quality training data. Our results demonstrate that a few rounds of bootstrapping in this manner provides significant per-formance gains in terms of Precision-Recall curves.
Training
Figure 3: Block diagram of the computational framework
We now describe the computational framework used to train the detectors for different object classes. The block diagram of our framework is given in Figure 3, and the explanation for each step is given below. The specific details for some of the parameter values are given in§4. Note that the following account is one particular set of framework choices and the corresponding re-sults generated by using these choices. There can be sever differ-ent variants of this framework, with differdiffer-ent feature descriptors, code-book learning mechanisms, coding and pooling strategies.
3.1 Feature Extraction
Our sensors have a number of high-resolution multispectral bands (e.g., WorldView-2has8bands), which we are able to process spectrally to surface reflectance, thereby creating a direct rela-tionship between measured spectral values and surface material properties. In practice, we extract a combination of textural and spectral features. However, for the purposes of this paper all re-sults were produced using a standard dense SIFT (Lowe 1999) descriptor applied only to the panchromatic image channel.
3.2 Dictionary Learning
Using the features extracted from the training images, we usek -means clustering (Hartigan and Wong, 1979) to discover descrip-tor modes in our training data. Following the terminology from Natural Language Processing for document representation, find-ing these modes is equivalent to discoverfind-ing adictionaryofvisual words.
3.3 Locally Constrained Linear Codes
distance based soft-assignment during feature quantization along with locality constrained regularization (Wang et al., 2010). These locally constrained linear codes (LLC) ensure improved feature reconstruction by generating a space that better captures data non-linearities. More specifically, the LLC codes use the following optimization cost-function:
where⊙represents element-wise product, xi ∈ RDis theith feature vector, andB = [b1,b2,·,·,·,bM]∈ RD
×M
is a basis vector codebook. Moreover,di∈RMis the locality adaptor that varies for each basis vector based on its similarity toxi. More concretely,
and dist(xi,bj)is the Euclidean distance betweenxiandbj. Fur-thermore, hereσadjusts the weight decay rate for the locality adaptor.
3.4 Spatial Pooling
A means to incorporate locality constraints in image representa-tion, spatial pooling (Boureau et al., 2011) has emerged as an im-portant step in image classification systems. In particular, spatial pyramids (Lazebnik et al., 2006) have shown to be a useful way to perform spatial pooling for a wide variety of features. For our purposes, we use spatial pooling computed over the dense LLC codes for each of the training images to generate the final feature vector representations.
3.5 Classifier Learning
The space generated by the LLC image codes attempts to capture the non-linearities of the data accurately, using locally-linear ap-proximations. Spatial pooling has the effect of greatly increasing the dimensionality of the feature vector, which can be a bene-fit for finding separating hyperplanes as classification decision boundaries, but also increases the computational and storage re-quirements of the system. Therefore for the sake of efficiency and classifier generalizability, we use a linear SVM (Fan et al., 2008) as our classifier of choice.
3.6 Testing
Given a previously-learned dictionary and a test image, we com-pute the SIFT features using a dense grid, and find the LLC codes for each of the grid locations. Based on the object-class under consideration, we scan the test image using a sliding-window of a specific size. For each of the sliding-windows, we perform spatial pooling, and score the resulting feature vector using the previously-learned classifier for the particular object of interest. A final detection decision is made by applying a threshold to the score for each window.
4. EXPERIMENTS AND RESULTS
Our experimental evaluation employed three data sets: McChord Air Force Base (AFB), where we tested detection of multiple ob-ject classes, and two secondary data sets, one in Corpus Christi,
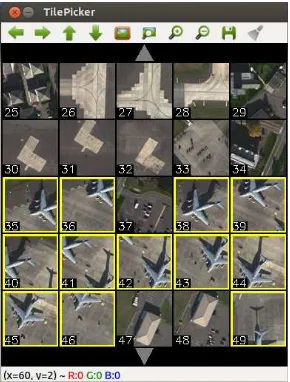
Figure 4: “TilePicker” GUI used to quickly curate detections as part of the bootstrapping process.
Texas, where we evaluated oil storage tank detection, and another in Denver, Colorado, where we evaluated parking lot detection in an urban setting. Details and results for each of the three data sets are provided below.
4.1 Bootstrapping
We improve the detection results by using a training process we call bootstrapping. The idea is that we can fine-tune a model for a given data set by curating the detections (and the miss-detections) to generate additional positive and negative training samples. In general, we do this by using a set of training data to construct an initial detector. We process detections on a validation image, set-ting the detection threshold relatively low, such as to favor false positives over false negatives (i.e. higher recall at the cost of lower precision).
We use a graphical interface we call “TilePicker”, to quickly iden-tify the true positives from among all the detections (see Fig-ure 4). The true positives are used to augment the positive train-ing data, while the false positives augment the negative samples. Similarly, we have another interface that makes it easy for the user to select objects that were missed in the validation image. The regions around a miss are used to augment the positive train-ing samples.
Bootstrapping can be an iterative process. In the data sets de-scribed herein, we found that one or two rounds of bootstrap-ping on the validation image was sufficient to generate an accu-rate model. We use the precision-recall curves on the validation image, through the training stages (initial detection, boostrapping round 1, and bootstrapping round 2), to judge when the model is sufficiently accurate. We use the final model created through this bootstrapping process to perform detections on the withheld test image.
4.2 McChord AFB
The McChord AFB data consists of 15 images of an airplane run-way area taken over a series of months. Another 6 images are from a different part of the base where helicopters are present.
was withheld for testing the model. The same procedure was fol-lowed for helicopters using the 6-image subset. Four images were used to generate training samples, one was used for bootstrapping the model, and the final withheld for testing.
Each of the images was labeled by hand to establish ground truth. For parking lots, we outlined each parking area, creating a set of ground-truth polygons. For the other classes, we selected the center points of the objects. Parking lots and storage tanks are static facilities, so a single ground-truth data file sufficed for all images. For airplanes and helicopters, each image had to be an-notated separately.
We generated positive training samples by extracting a rectangu-lar patch around the center points of each object. For parking lots, we selected a random representative point from within each polygon for use as the center of the training patch. The size of the training patch varied based on the class. For airplanes, we used150×150pixels, for parking lots and storage tanks we used 75×75pixels, and for helicopters,50×50pixels. To augment the positive training samples, we rotated each through 8 directions, in 45◦
increments.
We generated negative training samples for each class by ran-domly selecting 200 patches from each training image and then discarding any of the patches that happen to contain part of the positive class.
Class Initial Bootstrap1 Bootstrap2
Parking Lots 12584 / 2322 14235 / 3561 –
Storage Tanks 1768 / 2587 1801 / 2637 1852 / 2792 Airplanes 1560 / 2578 1626 / 2662 –
Helicopters 1176 / 2193 1237 / 4979 1320 / 5112
Table 1: Summary of training data for McChord AFB. Each en-try provides the number of positive / number of negative training samples, in total, at each stage.
Detections are processed using a sliding window of the given patch size (150×150for planes, e.g.) with an overlap between windows of 13 the window width. The detection score for each
sliding window is compared to a threshold to determine if the ob-ject of interest is present or not within the window region. We do not attempt to further segment the objects, thus multiple slid-ing windows can be considered true-positives for a sslid-ingle large object.
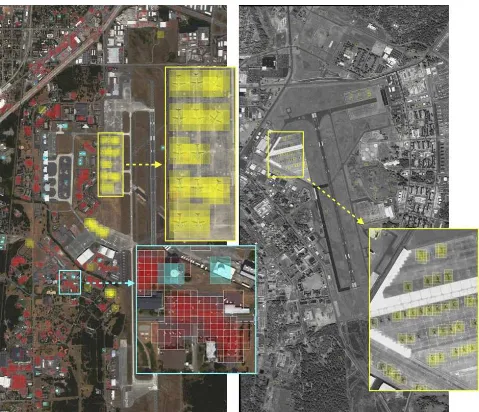
Detection results are shown in Figure 5. These are the results on the respective test images for all classes using the final boot-strapped detectors. An unexpected result occurred for the storage tank class. Using our detector, we discovered a storage tank that was not labeled as such in our ground-truth annotations. In this case, it was a white storage tank sitting atop a white-roofed build-ing, and thus was hard to see by the human eye (shown in the inset of the left image in the figure).
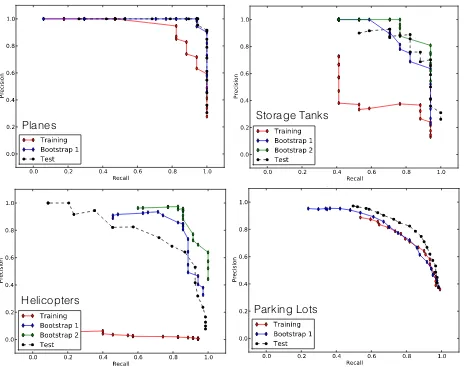
Precision-recall curves for each class are shown in Figure 6. Each graph shows the precision-recall for each training stage (solid lines: red, blue, and green) as well as the curve for the test im-age (dashed black lines). The bootstrapping process significantly improves the accuracy on 3 of the 4 classes, but does not help improve the parking lot detector. This may be due to the fact that the parking lot detector starts with many more positive training samples, and the initial model performs quite well.
4.3 Corpus Christi
The Corpus Christi data consists of nine images of an oil refining region near the coast of Corpus Christi, Texas. There are hun-dreds of oil storage tanks, of a variety of shapes, colors, and sizes
a
b
P
recision
Recall
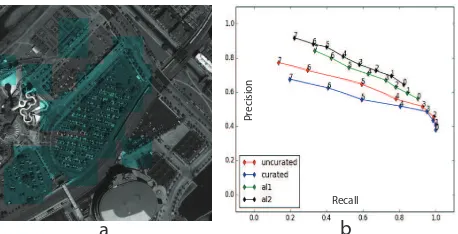
Figure 8: (a) Visualization of the parking lot detection results in Denver area. (b) P-R curves for different types of training-data.
in this imagery. We selected two of the nine Corpus Christi im-ages to use for model validation and bootstrapping, and used the remaining seven images for testing.
We use this data set to evaluate the use of using OpenStreetMap (OSM) to generate an initial detector from globally-distributed training samples, followed by bootstrapping to fine tune the model to perform well on the local images.
Our initial detector was trained using 3,165 samples created by using OSM to provide the locations of storage tanks from the vicinities of 200 metropolitan areas around the world. We further augmented this data by employing known locations of 1,954 oil storage facilities near Cushing, Oklahoma, for a total of 5,119 training samples. Negative samples were created from a clutter class derived by avoiding known storage tank locations, but in the same general vicinities as the positive samples, resulting in 9,651 negative samples.
The details of how we bootstrapped the detector differs in one step from what was described previously. We employed the initial model to detect oil tanks in the first of the two validation images. We used TilePicker to identify the true positives. Where we dif-fered from the previous bootstrapping process was that after the first round of curation, we trained the subsequent model only on the new samples (427 positive, 921 negative). We did this to en-courage quicker convergence on an optimized local model, since the relative fraction of local training samples to global is small. After this step, we iterated the next two rounds of bootstrapping on the second validation image, following the same procedure as was done for the McChord AFB data.
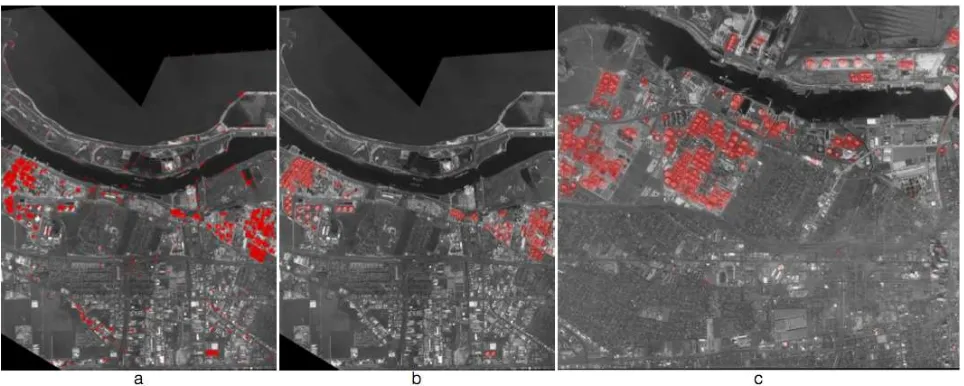
We observe that the results are qualitatively similar in accuracy to those of the McChord data set, where only local training samples were employed (see Figure 7). We also note that the results of the initial model, trained on thousands of diverse samples, generates good results – good enough that there is value in bootstrapping off this global model instead of simply starting from scratch.
4.4 Denver
As a second test employing a globally-trained model, we revisit the detection of parking lots. In this case, unlike the parking lot model for McChord AFB, we use OSM training data to create an initial model, followed by bootstrapping on imagery surrounding Tacoma, Washington, and finally we perform testing using a third set of imagery from Denver, Colorado.
Figure 5: Detections in McChord AFB images. Left image shows detections of parking lots (red), storage tanks (cyan) and airplanes (yellow). Right image shows detections of helicopters (yellow). Inset images show areas of interest enlarged. The top-right storage tank in the inset image was not part of the human annotated ground-truth, and thus our detector helped us discover this human labeling error.
from Tacoma. We curated the results from the Tacoma strip and appended both the positive and negative curated examples of park-ing lots from the Tacoma area to our original trainpark-ing set to re-learn the classifier. We performed another similar round of active learning for one of the strips from the Denver area.
We tested the re-trained classifiers on the Denver area test-strip. The results for the test strip using the original and the actively learned classifiers are shown in Figure 8. The four precision-recall curves in the figure are described as follows. The curve labeled “uncurated” is for the case when we used training data directly obtained from the OSM labels. The curve labeled “cu-rated” is one obtained using OSM training data where additional curation was performed to reduce label noise (examples of OSM label noise are shown in Figure 2). The final two curves, “al1” and “al2” are for the two rounds of active learning (bootstrap-ping) modifying the classifier learned from curated OSM data.
It is interesting to see that the results we achieve using the un-curated data are better than the un-curated ones. One explanation for this observation is that some of the mis-labels in the train-ing data actually help improve the generalizability of the learned classifier. Another possibility as to why curation did not help was
the ambiguity from many of the samples showing just a part of a parking lot amidst a set of buildings or other urban structures. In trying to make the data as clean as possible, we may have dis-carded important boundary cases in the initial OSM curation.
Also note that the test data in Denver is significantly different from the validation/bootstrapping data from Tacoma, as opposed to previous experiments where the test images are from the same AOI as the validation.
5. CONCLUSIONS
Parking Lots
Planes
Helicopters
Storage Tanks
Figure 6: Precision-recall curves for McChord AFB data set. Two rounds of bootstrapping were used with helicopters and storage tanks, and only a single round for planes and parking lots. Bootstrapping does not seem to help parking lots, perhaps because there were many more initial positive training samples (over 12,500 parking lot samples vs. about 2,000 each for the other classes).
the labeling process. We presented detection results over sev-eral object-classes using training data captured from close to200 cities and tested over multiple geographic locations.
In the future, we plan on incorporating multi-spectral data to im-prove the robustness of our framework. We also plan on incor-porating meta-data, such as the terrain-type, weather parameters, and a water mask. Finally, as the amount and variety of training data increases, the need for bootstrapping will be reduced. We observed in the McChord data that where we had significantly more training samples (for the parking lot class), the benefit of bootstrapping were minimal. We also observed that by training on thousands of samples gathered from OSM, we were able to generate relatively good detectors even prior to bootstrapping. While bootstrapping serves to augment the amount of training data and to adapt the classifier to the local imagery, it may be that with sufficient training samples, models trained only on global data will be accurate enough not to require adaptation to local imagery. This is a question we plan to investigate in future work involving significantly more training data.
REFERENCES
Bay, H., Tuytelaars, T. and Van Gool, L., 2006. Surf: Speeded up robust features. In: Computer Vision (ECCV), 2006 European Conference on, Springer, pp. 404–417.
Boureau, Y.-L., Le Roux, N., Bach, F., Ponce, J. and LeCun, Y., 2011. Ask the locals: multi-way local pooling for image recog-nition. In: Computer Vision (ICCV), 2011 IEEE International Conference on, IEEE, pp. 2651–2658.
Cheriyadat, A. M., 2014. Unsupervised feature learning for aerial scene classification. Geoscience and Remote Sensing, IEEE Transactions on 52(1), pp. 439–451.
Deng, J., Dong, W., Socher, R., Li, L.-J., Li, K. and Fei-Fei, L., 2009. Imagenet: A large-scale hierarchical image database. In: Computer Vision and Pattern Recognition (CVPR), 2009 IEEE Conference on, IEEE, pp. 248–255.
Doe, J., 2014. Commercial satellite imaging market - global industry analysis, size, share, growth, trends, and forecast, 2013 -2019. Transparency Market Research.
Drozda, P., Gorecki, P., Sopyla, K. and Artiemjew, P., 2013. Visual words sequence alignment for image classification. In: Cognitive Informatics & Cognitive Computing (ICCI* CC), 12th IEEE International Conference on, IEEE, pp. 397–402.
Fan, R.-E., Chang, K.-W., Hsieh, J., Wang, X.-R. and Lin, C.-J., 2008. Liblinear: A library for large linear classification. The Journal of Machine Learning Research 9, pp. 1871–1874.
Figure 7: Detections in the Corpus Christi data set. Image (a) shows the results of the initial model on the validation image. Image (b) shows the results after the bootstrapping process on the same validation image. Image (c) shows the results of the final model on a withheld test image.
The use of crowdsourcing to improve global land cover. Remote Sensing 1(3), pp. 345–354.
Grauman, K. and Darrell, T., 2005. The pyramid match ker-nel: Discriminative classification with sets of image features. In: Computer Vision (ICCV), Tenth IEEE International Conference on, Vol. 2, IEEE, pp. 1458–1465.
Haklay, M. and Weber, P., 2008. Openstreetmap: User-generated street maps. Pervasive Computing, IEEE 7(4), pp. 12–18.
Haralick, R. M., Shanmugam, K. and Dinstein, I. H., 1973. Tex-tural features for image classification. Systems, Man and Cyber-netics, IEEE Transactions on (6), pp. 610–621.
Harsanyi, J. C. and Chang, C.-I., 1994. Hyperspectral image clas-sification and dimensionality reduction: an orthogonal subspace projection approach. Geoscience and Remote Sensing, IEEE Transactions on 32(4), pp. 779–785.
Hartigan, J. A. and Wong, M. A., 1979. Algorithm as 136: A k-means clustering algorithm. Applied statistics pp. 100–108.
Heipke, C., 2010. Crowdsourcing geospatial data. ISPRS Journal of Photogrammetry and Remote Sensing 65(6), pp. 550–557.
Krizhevsky, A., Sutskever, I. and Hinton, G. E., 2012. Im-agenet classification with deep convolutional neural networks. In: Advances in Neural Information Processing Systems (NIPS), pp. 1097–1105.
Lazebnik, S., Schmid, C. and Ponce, J., 2006. Beyond bags of features: Spatial pyramid matching for recognizing natural scene categories. In: Computer Vision and Pattern Recognition (CVPR), 2006 IEEE Conference on, Vol. 2, IEEE, pp. 2169– 2178.
Liu, L., Wang, L. and Liu, X., 2011. In defense of soft-assignment coding. In: Computer Vision (ICCV), 2011 IEEE International Conference on, IEEE, pp. 2486–2493.
Lowe, D. G., 1999. Object recognition from local scale-invariant features. In: Computer Vision (ICCV), Seventh IEEE Interna-tional Conference on, Vol. 2, Ieee, pp. 1150–1157.
Maas, H.-G., 2005. Akquisition von 3d-gis daten durch flugzeu-glaserscanning. Kartographische Nachrichten 55(1), pp. 3–11.
Mohan, A., Papageorgiou, C. and Poggio, T., 2001. Example-based object detection in images by components. Pattern Anal-ysis and Machine Intelligence, IEEE Transactions on 23(4), pp. 349–361.
Papageorgiou, C. and Poggio, T., 2000. A trainable system for object detection. International Journal of Computer Vision 38(1), pp. 15–33.
Risojevi´c, V., Babi´c, Z., Dobravec, T., Buli´c, P. et al., 2013. A gpu implementation of a structural-similarity-based aerial-image classification. The Journal of Supercomputing 65(2), pp. 978– 996.
Rublee, E., Rabaud, V., Konolige, K. and Bradski, G., 2011. Orb: an efficient alternative to sift or surf. In: Computer Vi-sion (ICCV), 2011 IEEE International Conference on, IEEE, pp. 2564–2571.
Viola, P. and Jones, M., 2001. Rapid object detection using a boosted cascade of simple features. In: Computer Vision and Pattern Recognition (CVPR), 2001 IEEE Conference on, Vol. 1, IEEE, p. 511.
Wang, J., Yang, J., Yu, K., Lv, F., Huang, T. and Gong, Y., 2010. Locality-constrained linear coding for image classification. In: Computer Vision and Pattern Recognition (CVPR), 2010 IEEE Conference on, IEEE, pp. 3360–3367.
Yang, C., Everitt, J. H., Du, Q., Luo, B. and Chanussot, J., 2013. Using high-resolution airborne and satellite imagery to assess crop growth and yield variability for precision agriculture. Pro-ceedings of the IEEE 101(3), pp. 582–592.
Yang, Y. and Newsam, S., 2010. Bag-of-visual-words and spa-tial extensions for land-use classification. In: Advances in Ge-ographic Information Systems, 18th SIGSPATIAL International Conference on, ACM, pp. 270–279.