EFFECTS OF HETEROGENIETY ON SPATIAL PATTERN ANALYSIS OF WILD
PISTACHIO TREES IN ZAGROS WOODLANDS, IRAN
Y. Erfanifard a, *, F. Rezayan a
aDept. of Natural Resources and Environment, College of Agriculture, Shiraz University, Shiraz, Iran - [email protected], [email protected]
KEY WORDS: Heterogeneity, Null model, Ripley's K-function, Spatial pattern analysis, Wild pistachio, Zagros.
ABSTRACT:
Vegetation heterogeneity biases second-order summary statistics, e.g., Ripley's K-function, applied for spatial pattern analysis in ecology. Second-order investigation based on Ripley's K-function and related statistics (i.e., L- and pair correlation function g) is widely used in ecology to develop hypothesis on underlying processes by characterizing spatial patterns of vegetation. The aim of this study was to demonstrate effects of underlying heterogeneity of wild pistachio (Pistacia atlantica Desf.) trees on the second-order summary statistics of point pattern analysis in a part of Zagros woodlands, Iran. The spatial distribution of 431 wild pistachio trees was accurately mapped in a 40 ha stand in the Wild Pistachio & Almond Research Site, Fars province, Iran. Three commonly used second-order summary statistics (i.e., K-, L-, and g-functions) were applied to analyse their spatial pattern. The two-sample Kolmogorov-Smirnov goodness-of-fit test showed that the observed pattern significantly followed an inhomogeneous Poisson process null model in the study region. The results also showed that heterogeneous pattern of wild pistachio trees biased the homogeneous form of K-, L-, and g-functions, demonstrating a stronger aggregation of the trees at the scales of 0-50 m than actually existed and an aggregation at scales of 150-200 m, while regularly distributed. Consequently, we showed that heterogeneity of point patterns may bias the results of homogeneous second-order summary statistics and we also suggested applying inhomogeneous summary statistics with related null models for spatial pattern analysis of heterogeneous vegetations.
* Postal Code: 7144165186, Shiraz, Iran. Tel. +98 71 36138162 1. INTRODUCTION
In general, point pattern analysis (PPA) of geospatial data is an investigation focused on finding patterns of points indicating the locations of individuals in a defined spatial region. The application of PPA in natural systems reflects the underlying ecological processes that cause their pattern in a two-dimensional space, e.g. spatial distribution of trees in forests that discovers meaningful relationships among trees and their environment (Krebs, 1999; Dale et al., 2002; Brown et al., 2011). Spatial distribution of trees in a forest stand reveals intraspecific and interspecific interactions of them and their relationships with environmental conditions, and thus it is not only a spatial property of trees but also basic quantitative characteristics of them. It also can be used to assess whether groups of trees in a forest stand show competitive or facilitative effects (Uuttera et al., 1998; Fan and Hsieh, 2010; Zhang et al., 2010; Alvarez et al., 2011; Wiegand et al., 2012). If competition is the reason of the spatial distribution of trees in a stand, the arrangement of them tends to be dispersed (i.e., uniform distances between trees), and if facilitation is of great importance, the arrangement tends to be clustered, and it is more likely random if neither facilitation nor competition effects are observed (Wiegand and Moloney, 2004).
Investigation of spatial distribution of trees in fragile ecosystems is very important because of their complicated interactions with each other and their environment, e.g., wild pistachio trees grown in Zagros semi-arid woodlands, Iran. Research in these woodlands has largely focused on mapping and quantitative measurements by remotely sensed datasets (Erfanifard et al., 2007; Bayat et al., 2010); however, ecological
relationships of woody species with each other and their environment are still not well studied.
Zagros woodlands, west Iran, cover a vast area of Zagros Mountains stretching from Western Azerbaijan province in the northwest, to the vicinity of Fars province in the southwest of Iran, having an average width and length of 200 and 1,300 km, respectively. Classified as semi-arid, Zagros woodlands cover 5 million hectares and consist 40% of Iran vegetation cover. Wild pistachio (Pistacia atlantica Desf.) trees, as the second most common tree species of these woodlands, are scattered in many parts of the area mostly mixed with Persian oak (Quercus brantii var. persica) and almond (Amygdalus spp.) trees and sometimes, form pure stands (Jazirehi and Ebrahimi Rostaghi, 2003; Pourreza et al., 2008). Despite relatively low net primary production rates, Zagros woodlands are ecologically important due to their effects on conservation of water sources, prevention of soil degradation and desertification.
However, the K-, L-, and g-functions have been developed for homogeneous patterns with uniform intensity across the defined region. If the studied point pattern is not homogeneous, the estimated functions show a systematic bias, so that the investigation of causative ecological processes in natural systems might be impeded. "Virtual aggregation" explained by Wigand and Moloney (2004) has well described the problem. They explained how virtual aggregation may affect the results of point pattern analysis, particularly at smaller scales of PPA.
Since most of the natural systems, e.g. forest stands, are to some extent heterogeneous, a variety of methods has been developed to overcome this problem by the adaptation of summary statistics to the underlying heterogeneity or by the application of homogeneous subareas. These methods generally need a pre-analysis to reveal that the point pattern is heterogeneous and summary statistics that are developed to analyse heterogeneous point patterns would be desirable.
In this work, we primarily analyse the heterogeneity of spatial pattern of wild pistachio trees in a part of Zagros woodlands. We apply suitable summary statistics (K-, L-, and g -functions) depending on the status of the pattern. Finally, we show difficulties of PPA of wild pistachio trees that arise due to the effects of heterogeneity of the pattern on the results of summary statistics.
2. METHODOLOGY
2.1 Study Area
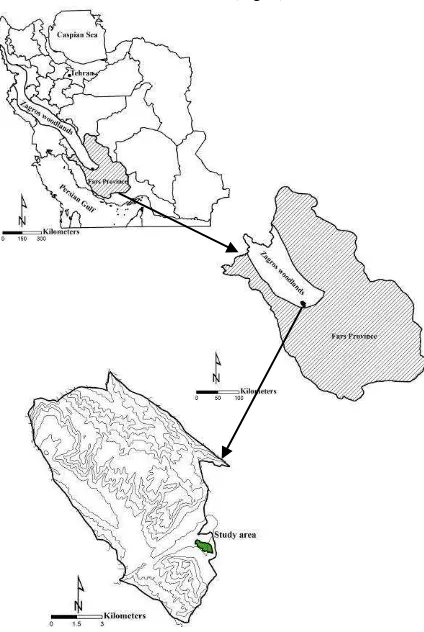
The study was conducted in the Wild Pistachio & Almond Research Site located close to Shiraz city, Fars province, Iran, between 29° 15´ N and 52° 35´ E (Fig. 1).
The minimum and maximum elevations are 1880 and 1900 m, respectively. Mean annual precipitation is 383 mm and mean maximum winter and mean maximum summer temperatures are -12 °C and 42 °C, respectively (from data of 1980-2010 by Iran Meteorological Organization). A 40 ha plot covered dominantly with wild pistachio (Pistacia atlantica
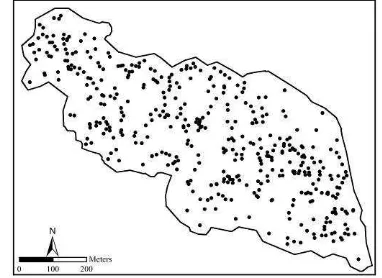
Desf.) trees (Fig. 2) as the second most frequent tree species in Zagros woodlands, was selected for this study (Fig. 3). There were also other species, i.e. two wild species of almond (Amygdalus scoparia and A. orientalis), hawthorn (Crataegus
spp.), and buckthorn (Rhamnus pallasii) in the study area formed a pure wild pistachio stand. The point map of wild pistachio trees was obtained by full calipering method using differential global positioning system (DGPS) and geographic information system (GIS).
Figure 2. The leaves and fruits of wild pistachio trees in the study area.
Figure 3. The study area covered with wild pistachio trees.
2.2 Heterogeneity of wild pistachio trees
Prior to PPA in a natural system, e.g. spatial pattern of trees in a forest stand, a pre-analysis is needed to assess heterogeneity of distribution of the observed individual trees distributed in the study area. The two-sample Kolmogorov-Smirnov test was used in this study served as a goodness-of-fit test to compare the observed and predicted distributions of a point pattern. The spatial distribution of wild pistachio trees was compared to a heterogeneous Poisson process in this research (Berman, 1986; Gelfand et al., 2010).
Inhomogeneous (or heterogeneous) Poisson process is a kind of Poisson process with a rate parameter that is a function Figure 1. Map identifying the location of Fars province
of distance. Intensity of points (i.e., mean number of points per unit area) is also not constant and depends on location (Stoyan and Stoyan, 1994; Dale et al., 2002; Illian et al., 2008).
2.3 Summary statistics of PPA
A large number of summary statistics have been developed for the analysis of point patterns in spatial ecology divided into two main groups, i.e. first- and second-order summary statistics. Second-order methods are based on Ripley's
K-function widely used in vegetation ecology to reveal underlying processes (Diggle, 2003; Illian et al., 2008).
2.3.1 Ripley's K-function: The K-function is the summary statistic commonly used to analyse point patterns in ecological investigations of a wide range of plant species. It is defined as used to analyse the heterogeneous point pattern.
(2)
where e(xi, xj, r) is the suitable method for edge correction of
inhomogeneous point patterns, 1 is used when the distance between two random points is less than r, and �(x) is the intensity of i and j points. For a homogeneous Poisson process (null model of complete spatial randomness called CSR) or the inhomogeneous form, K(r)=�r2 and K(r)<�r2 indicates regularity of the pattern up to distance r, while K(r)>�r2 indicates aggregation of the pattern up to distance r.
2.3.2 The L-function: As it is difficult to visually interpret Ripley's K-function, therefore a transformed form of this summary statistic called L-function (Eq. 3) is widely used in the literature (e.g., Navarro-Cerrillo et al., 2013).
(3)
In an inhomogeneous point pattern that the intensity of points is not constant, the inhomogeneous form of L-function (Eq. 4) has to be used to analyse the heterogeneous point pattern.
(4)
For a null model of CSR or inhomogeneous Poisson process,
L(r)=0 and L(r)<0 demonstrates regularity of the pattern up to
distance r, while L(r)>0 demonstrates aggregation of the pattern
up to distance r (Stoyan and Stoyan, 1994; Diggle, 2003; Illian et al., 2008).
2.3.3 g-function: Similar to Ripley's K-function, the pair correlation function g (Eq. 5) uses the information of all inter-point distances to express information on the scale of the inter-point pattern, although g-function is the expected number of points in a ring of radius r (instead of circles in Ripley's K-function), function and r. If the studied point pattern is not homogeneous, the inhomogeneous form of g-function (Eq. 6) should therefore be used to analyse the point pattern.
2.3.4 Confidence envelopes: Monte Carlo simulations were used to show at which spatial scales the observed patterns significantly depart from the null models (CSR and inhomogeneous Poisson process). At each spatial scale r, the 5th highest and 5th lowest values of 199 replicates of each null goodness-of-fit test indicated that the observed pattern followed the inhomogeneous Poisson process (D=0.029<D0.025=0.069 and p-value=0.859).
As we concluded that wild pistachio trees were heterogeneously scattered in the study area, the inhomogeneous forms of K-, L-, and g-functions were estimated for all 431 trees in the study area.
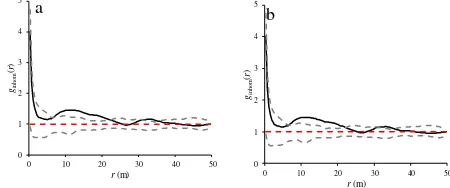
The results of inhomogeneous K-analysis reflected that there was a significant departure from the null hypothesis at scales of 0-50 m (Fig. 5a) and a weak aggregation was observed between wild pistachio trees at these scales. However, at scales of 150-200 m the observed K-function was significantly lower than Monte Carlo envelopes indicating the regularity of wild pistachio trees at these scales (Fig. 5b).
Figure 5. Inhomogeneous K-function at scales of 0-50 m (a) and 150-200 m (b) for heterogeneous pattern of wild pistachio trees.
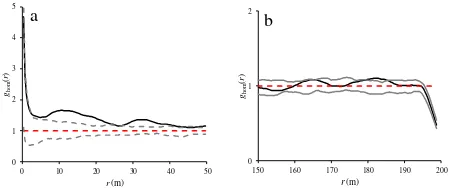
Heterogeneity of point patterns caused a systematic bias in the results of applied summary statistics. To address this bias, the homogeneous K-function was also estimated in the study
(Fig. 6b), while the trees were regularly distributed in the study area at these scales.
Figure 6. Homogeneous K-function at scales of 0-50 m (a) and 150-200 m (b) for heterogeneous pattern of wild pistachio trees.
The estimated L-function was in good accordance with K -function at both scales. The analysis of inhomogeneous L -function indicated a weak aggregation at scales of 10-50 m (Fig. 7a) and a weak regularity at scales of 153-200 m (Fig. 7b). In contrast to K-function, inhomogeneous L-function expressed the randomness of wild pistachio trees at scales of 0-10 m (Fig. 7a) and 150-153 m (Fig. 7b).
Clearly, heterogeneity of the spatial distribution of wild pistachio trees affected the results of homogeneous L-function at any scale. The estimated function revealed the randomness of the pattern at scales of 0-12 m, while it indicated a strong aggregation at scales of 12-50 m (Fig. 8a). Although the trees were regularly distributed in the study area, homogeneous L
-function indicated that they are strongly aggregated at scales of 150-200 m (Fig. 8b).
Figure 7. Inhomogeneous L-function at scales of 0-50 m (a) and 150-200 m (b) for heterogeneous pattern of wild pistachio trees.
Figure 8. Homogeneous L-function at scales of 0-50 m (a) and 150-200 m (b) for heterogeneous pattern of wild pistachio trees.
The results of inhomogeneous g-function were approximately in accordance with the results from previous inhomogeneous functions (K- and L-functions). For the pattern shown in Fig. 4, inhomogeneous g-function indicated aggregation at scales of 5-21 m, and random distribution at all other scales (Fig. 9a). However, this function revealed the regular distribution of tree at scales of 150-162 m, and randomness at all other scales (Fig. 9b).
Figure 9. Inhomogeneous g-function at scales of 0-50 m (a) and 150-200 m (b) for heterogeneous pattern of wild pistachio trees.
Heterogeneity of the pattern of wild pistachio trees biased homogeneous g-function, as was the case for other homogeneous functions (K- and L-function). Homogeneous g -function indicated a strong aggregation at scales of 6-22 m and 28-38 m, and weak aggregation at all other scales (Fig. 10a).
Despite a weak regularity of the trees at scales of 150-162
m (Fig. 9b), homogeneous g-function indicated a weak aggregated distribution at scales of 179-184 m and randomness at all other scales (Fig. 10b).
Figure 10. Homogeneous g-function at scales of 0-50 m (a) and 150-200 m (b) for heterogeneous pattern of wild pistachio trees.
4. CONCLUSION
In this article, we investigated how heterogeneity biases the results of the commonly used summary statistics applied in spatial pattern analysis (i.e., K-, L-, and g-functions) in vegetation ecology. In recent years, a variety of first- and second-order summary statistics have been developed in point pattern analysis by many statisticians that are utilized in ecology (Fortin and Dale, 2005; Getzin et al., 2006; Guo et al., 2013). Although ecologists have not used the full range of summary statistics that is available, Ripley's K-function and related summary statistics (L- and g-functions) have been increasingly applied in the literature (e.g., Longuetaud et al., 2008; Alvarez et al., 2011; Cisz et al., 2013). Methods in PPA based on second-order statistics are developed to analyse homogeneous point patterns with the null model of CSR and their application to heterogeneous point patterns biases the results. Most ecologists have used the simplest form that is the homogeneous ones with the null model of CSR as the mathematical tools, especially parameter fitting and finding a suitable edge correction method can be complicated. It addresses practical problems and pitfalls in PPA of plants in vegetation ecology.
To reveal the difficulties that might happen when using homogeneous summary statistics in heterogeneous patterns to ecologists, we applied homogeneous second-order statistics to the heterogeneous point pattern of wild pistachio trees in Zagros woodlands, Iran. We also reviewed inhomogeneous second-order statistics account for heterogeneity in the study region.
Our application of homogeneous K-, L-, and g-functions to wild pistachio trees clearly showed that the results were biased due to the underlying heterogeneity of the pattern revealed by Kolmogorov-Smirnov goodness-of-fit test. Heterogeneity had also a marked impact on the shape of the summary statistics and on the confidence envelopes (Fig. 6, 8, 10). The K- and L- functions indicated a stronger aggregation at scales of 0-50 m than actually existed (Fig. 6a, 8a). The g -function also indicated no random distribution, observed in the pattern at scales of 0-50 m (Fig. 10a). Although wild pistachio trees were regularly distributed in the study region at scales of 150-200 m, the K- and L- functions showed a significant aggregation at these scales (Fig. 6b, 8b). The pair correlation function g also showed randomness at smaller scales of 150-200
m (Fig. 10b), while regular distribution of the trees was observed at scales of 150-162 m (Fig. 9b).
Heterogeneity of study region detected by suitable tests, i.e. Kolmogorov-Smirnov goodness-of-fit test biased the results of homogeneous summary statistics. To avoid this problem, a null model that acknowledges the heterogeneity (e.g., inhomogeneous Poisson process) has to be applied. Alternatively, homogeneous sub-regions may be examined by
homogeneous statistics in the heterogeneous pattern (Perry et al., 2006; Illian et al., 2008; Guo et al., 2013).
Inhomogeneous Ripley's K-, L-, and g-functions with the null model of inhomogeneous Poisson process were also applied to characterize the spatial pattern of wild pistachio trees in the study region. For the PPA of the trees both, inhomogeneous K- and L-functions, revealed a weak aggregation up to scale 50 m (Fig. 5a, 7a) and an approximate regularity at scales of 150-200 m (Fig. 5b, 7b). The pair correlation function g, also indicated aggregation at scales of 5-21 m (Fig. 9a) and regularity of the pattern at scales of 150-162 (Fig. 9b).
Ripley's K-, L-, and the pair correlation function g
described the characteristics of pattern of wild pistachio trees over a range of spatial scales; however, g-function indicated more detailed changes of the pattern at different scales (Fig. 9). Because of its non-accumulative property, g-function is recommended for exploratory point pattern analysis to recognize specific scales at which deviation from a null model happens (Ripley, 1976; Stoyan and Stoyan, 1994; Diggle, 2003; Illian et al., 2008).
In conclusion, we provided a comprehensive analysis on the effects of heterogeneity of wild pistachio trees on the results of second-order summary statistics. The results showed that spatial variation in the intensity of wild pistachio trees induced a systematic bias in the homogeneous forms of K-, L-, and g -functions, demonstrating a stronger aggregation at the scales of 0-50 m than actually existed and an aggregation at scales of 150-200 m, while they were regularly distributed. This implied the importance of heterogeneity tests prior to PPA in ecology to apply suitable summary statistics and null models.
REFERENCES
Alvarez, L.J., Epstein, H.E., Li, J. and Okin, G.S., 2011. Spatial patterns of grasses and shrubs in an arid grassland environment.
ECOSPHERE, 2(9), pp. 1-30.
Bayat, M., Zobeiri, M., Marvie Mohadjer, M.R. and Yosefi, Y., 2010. Monitoring of Sarsakhti oak reserved forest by aerial photographs and full callipering. Iranian Journal of Forest and Poplar Research, 17(4), pp. 637-649.
Berman, M., 1986. Testing for spatial association between a point process and another stochastic process. Applied Statistics, 35(1), pp. 54-62.
Brown, C., Law, R., Illian, J.B. and Burslem, D.F.R.P., 2011. Linking ecological processes with spatial and non-spatial patterns in plant communities. Ecology, 99, pp. 1402-1414.
Cisz, M.E., Falkowski, M.J. and Orr, B., 2013. Small-scale spatial pattern of Copernicia alba morong near Bahia Negra, Paraguay. Natural Resources, 4, pp. 369-377.
Diggle, P.J. 2003. Statistical Analysis of Point Processes. Academic Press, London, 159 p.
Dale, M.R.T., Dixon, P., Fortin, M., Legendre, P., Myers, D.E. and Rosenberg, M.S., 2002. Conceptual and mathematical relationships among methods for spatial analysis. Ecography, 25, pp. 558-577.
Erfanifard, Y., Zobeiri, M., Feghhi, J. and Namiranian, M., 2007. Estimation of crown cover on aerial photographs using 0
1 2
150 160 170 180 190 200
ghom
(
r
)
r(m) 0
1 2 3 4 5
0 10 20 30 40 50
ghom
(
r
)
r(m)
shadow index (Case study: Zagros forests, Iran). Iranian Journal of Forest and Poplar Research, 15(3), pp. 278-288.
Fan, S.W. and Hsieh, C.F., 2010. Spatial Autocorrelation Patterns of Understory Plant Species in a Subtropical Rainforest at Lanjenchi, Southern Taiwan. Taiwania, 55(2), pp. 160-171.
Fortin, M.J. and Dale, M.R.T., 2005. Spatial analysis. Cambridge University Press, Cambridge, 365 p.
Gelfand, A.E., Diggle, P.J., Fuentes, M. and Guttorp, P., 2010.
Handbook of spatial statistics. CRC Press, Florida, 608 p.
Getzin, S., Dean, C., He, F., Trofymow, J.A., Wiegand, K. and Wiegand, T., 2006. Spatial patterns and competition of tree species in a Douglas-fir chronosequence on Vancouver Island.
Ecography, 29, pp. 671–682.
Goreaud, F. and Pelissier, R., 1999. On explicit formulas of edge effect correction for Ripley's K-function. Vegetation Science, 10, pp. 433-438.
Guo, Y., Lu, J., Franklin, S.B., Wang, Q., Xu, Y., Zhang, K., Bao, D., Qiao, X., Huang, H., Lu, Z. and Jiang, M., 2013. Spatial distribution of tree species in a species-rich subtropical mountain forest in central China. Canadian Journal of Forest Research, 43, pp. 826-835.
Illian, J., Penttinen, A., Stoyan, H. and Stoyan, D., 2008.
Statistical analysis and modelling of spatial point patterns. John Wiley & Sons Inc., Chichester, 534 p.
Jazirehi, M., and Ebrahimi Rostaghi, M., 2003. Zagros silviculture. Tehran University Press, Tehran, 560 p.
Krebs, C.J., 1999. Ecological Methodology. Addison Welsey Educational Publisher Inc., California, 581 p.
Longuetaud, F., Seifert, T., Leban, J.M., and Pretzsch, H., 2008. Analysis of long-term dynamics of crowns of sessile oaks at the stand level by means of spatial statistics. Forest Ecology and Management, 255, pp. 2007-2019.
Navarro-Cerrillo, R.M., Manzanedo, R.D., Bohorque, J., Sanchez, R., Sanchez, J., Miguel, S., Solano, D., Qarro, M., Griffith, D. and Palacios, G., 2013. Structure and spatio-temporal dynamics of cedar forests along a management gradient in the Middle Atlas, Morocco. Forest Ecology and Management, 289, pp. 341-353.
Perry, G.L.W., Miller, B.P. and Enright, N.J., 2006. A comparison of methods for the statistical analysis of spatial point patterns in plant ecology. Plant Ecology, 187, pp. 59-82.
Pourreza, M., Shaw, J.D. and Zangeneh, H., 2008. Sustainability of wild pistachio (Pistacia atlantica Desf.) in Zagros forests, Iran. Forest Ecology and Management, 255, pp. 3667-3671.
Ripley, B.D., 1976. The second-order analysis of stationary point processes. Journal of Applied Probability, 13(2), pp. 255-266.
Ripley, B.D., 2004. Spatial statistics. John Wiley & Sons Inc., New Jersey, 248 p.
Stoyan, D. and Stoyan, H., 1994. Fractals, random shapes and point fields: methods of geometrical statistics. John Wiley & Sons Inc., Chichester, 387 p.
Uuttera, J., Haara, A., Tokola, T. and Maltamo, M., 1998. Determination of the spatial distribution of trees from digital aerial photographs. Forest Ecology and Management, 110, pp. 275-282.
Wiegand, T. and Moloney, K.A., 2004. Rings, circles, and null-models for point pattern analysis in ecology. OIKOS, 104, pp. 209-229.
Wiegand, T., He, F. and Hubbell, S.P., 2012. A systematic comparison of summary characteristics for quantifying point patterns in ecology. Ecography, 35, pp. 1–12.