DERIVED FROM POINT CLOUDS
Sanka Nirodha Perera a,b, *, Hetti Arachchige Nalani b, Danilo Schneider a
a Institute of Photogrammetry and Remote Sensing, Technische Universität Dresden, Helmholtz Straße 10, 01069 Dresden, Germany - [email protected]
b Faculty of Geomatics Sabaragamuwa University of Sri Lanka, Belihuloya, Sri Lanka
Commission III
KEY WORDS: Refinement, projective geometry, roof topology graph, shortest cycles
ABSTRACT:
Geometrically and topologically correct 3D building models are required to satisfy with new demands such as 3D cadastre, map updating, and decision making. More attention on building reconstruction has been paid using Airborne Laser Scanning (ALS) point cloud data. The planimetric accuracy of roof outlines, including step-edges is questionable in building models derived from only point clouds. This paper presents a new approach for the detection of accurate building boundaries by merging point clouds acquired by ALS and aerial photographs. It comprises two major parts: reconstruction of initial roof models from point clouds only, and refinement of their boundaries. A shortest closed circle (graph) analysis method is employed to generate building models in the first step. Having the advantages of high reliability, this method provides reconstruction without prior knowledge of primitive building types even when complex height jumps and various types of building roof are available. The accurate position of boundaries of the initial models is determined by the integration of the edges extracted from aerial photographs. In this process, scene constraints defined based on the initial roof models are introduced as the initial roof models are representing explicit unambiguous geometries about the scene. Experiments were conducted using the ISPRS benchmark test data. Based on test results, we show that the proposed approach can reconstruct 3D building models with higher geometrical (planimetry and vertical) and topological accuracy.
* Corresponding author
1. INTRODUCTION
With the development of sensor technology, Airborne Laser Scanning (ALS) demonstrates the high potential for the acquisi-tion of accurate three dimensional dense point clouds in a rapid manner. Consequently, point clouds are often employed for the reconstruction of complex 3D building models (e.g. Maas and Vosselman, 1999; Brenner et al., 2001; Suveg and Vosselman, 2004; Kim et al., 2006; Sampath and Shan, 2010; Lafarge et al., 2010; Haala and Kada, 2010; Huang et al, 2013; Lin et al., 2013). Although, ALS point clouds enable for highly automated processing workflow, the major drawback of point clouds is its’ sparsely distributed point nature, which still reduces the geo-metric accuracy, more specifically the planigeo-metric accuracy, of model boundaries. In order to enhance the accuracy of building models, refinement processes have been applied in some recon-struction schemes. Due to the difficulty of enhancing accuracy of models by point clouds itself, most practices which deal with refinement have used external data sources. In this regard, im-age data is shown as the most prominent source because it has complementary properties than ALS point clouds. Integration of these two data sources enhances the quality of building models in many ways, for instance LoD, segmentation, planimetric and as well as topological accuracy. Once data is properly integrat-ed, image information can be used to increase the accuracy of roof point segmentation. Khoshelham (2005) use a single image for refining segmentation of point clouds. Rottensteiner (2010) illustrate that the segmentation can further be enhanced by inte-grating multiple images and it solves contrast issues of individ-ual images.
The goal of this paper is to present a new method for enhancing, mainly, the planimetric accuracy of roof models reconstructed from point clouds. The method proposed by Perera and Maas (2014), i.e., closed circle analysis, is used for the reconstruction of initial roof models. Straight lines are
detected using the Burn’s line extraction algorithm (Burns et
al., 1986) from multiple images. The already derived initial roof outlines are primarily used as guides for deriving more precise 3D line segments from image data. For this, model edges are projected to the image space to match with the extracted image line segments. For the construction of boundary line segments in object space from the stereo (and multiple) images, this study follows the geometric relationships of line features at projective geometry as proposed by (Heuel, 2004; Ok et al., 2011). The matching process is further enhanced by defining some constraints.
The performance of the process is evaluated with the ISPRS benchmark test data Results show that a significant improve-ment on planimetric accuracy can be achieved with the pro-posed method.
2. RELATED WORK
urban buildings. In contrast, Ma (2004) proposes a post-refinement approach for the initial building models, which is derived by clustering method from ALS point clouds. Stereo imagery is mainly used in this post-refinement process. Chen et al. (2005) integrate building boundaries extracted from aerial images and roof planes derived from point clouds for reconstructing enhanced building edges with the help of split and merge strategy. Lee et al. (2008) extract initial building regions from the point clouds and merge them with the regions segmented from images to reach coarse roof edges. Precise roof boundaries are then extracted based on the coarse result through line segment matching and perceptual grouping. Cheng et al. (2011) derive the principal building orientation and building roof edges are thus extracted robustly from aerial images. To determine 3D roof boundary segments, they integrate point clouds and 2D boundary segments extracted from multiple images. A strategy to recover boundaries which are lost is also included in their approach. Habib et al. (2010) propose a semi-automated way for enhancing the accuracy of roof patches generated from point clouds by integrating point clouds and stereo imagery.
In ALS and image data integration, co-registration of one data set to another is first needed to achieve. Currently, many data registering schemes have been developed and their applicability associates mainly with the processing workflow. Habib et al. (2001) perform single photo resection to estimate orientation parameters using a modified iterative Hough transformation. Schenk and Csatho (2002) illustrate that the images can be integrated with point clouds through the break lines and surface patches extracted from the point clouds. To this end, linear features need to be first extracted from the images as building roofs can be described by linear features. In linear feature extraction, burns line extractor (Burns et al., 1986) and line growing – Förstner operator (Förstner, 1999) are widely being used. From the extracted linear features, corresponding features can then be searched and matched. As the features extracted from image space are in 2D, matching of corresponding linear feature in stereo or multi-view images would lead to transform them in to 3D object space.
Current practices of line matching procedures can be divided mainly into two groups: (i) matching of individual line segment and (ii) matching of group (mostly pairs) of line segments (Schmid and Zisserman, 1997). In either way, during the matching process, the search space has to be restricted to reduce the complexity. In order to filter out irrelevant candidates, Baltsavias (2000) adapt pair wise searching strategy while Kim and Nevatia (2004) illustrate how to use pair-wise approach for multi-view images based on the epipolar geometry.
3. PROPOSED APPROACH
3.1 Reconstruction of initial roof models
As proposed in Perera and Maas (2014), the reconstruction of roof models from point clouds is done as a modeling of roof corner vertices. Here, first inner roof corners and associated
in-ner skeleton is fixed which is followed the modeling of outer roof corners or roof outer-boundaries.
Describing the process in detail, as can be seen from Figure 1, the convergence of ridge and step-edge lines produce inner roof corners and is represented by the shortest closed cycle (SCC) in a roof topology graph.
To fix such corners, corresponding SCCs should be first ex-tracted. This is done by decomposing the RTG into possible
SCCs using Dijkstra’salgorithm as shown in Figure 1. Graph edges in the SCC relate which feature line to be intersected and which not to be intersected. Based on the attributes of SCCs, relevant features lines are efficiently accessed from databases.
(a) (b) (c)
Figure 1: Subdivision of shortest closed cycles: (a) internal skeleton of the roof model; (b) relevant RTG; and (c) decomposed SCC and their associated inner roof corners (dark thick line –roof outline, red line – ridge lines, solid lines – graph edges).
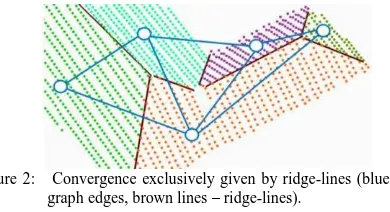
The SCCs with edges labeled as ridge-line are chosen for fixing convergences solely by ridge-lines (Figure 2). Since the con-vergence produces a single intersecting point in 3D, the fixing can be considered a weighted least square process. The weight is assigned as a sinus angle between two roof planes.
Figure 2: Convergence exclusively given by ridge-lines (blue lines – graph edges, brown lines – ridge-lines).
In the RTG, the remaining SCCs (length > 3) refer to the corners associated with mixed-feature lines (Figure 3). These corners generally lie at different height levels because of the available step-edges. Since the convergence of each corner arises at different height level, the SCCs are split into disjointed paths and converted to directed path graphs. The feature lines relevant to each path are fixed separately (Figure 3b). Sample results in Figure 3(d, e) demonstrate that the procedure is more robust and leading to topologically and geometrically valid roof top vertices.
(a) (b) (c) (d)
and (e) examples (red and blue lines are oblique-ridges and step-edges).
3.1.1 Fixing of outer-boundaries via outermost cycle
As shown in figure 4, some of the outer-boundaries meet outer ends of the inner roof skeleton. If one can recover the exact lo-cations, where the inner roof skeleton meets the outer-boundaries, then the outer roof corners can be accomplished. However, location of gutters and eave lines should first be cor-rected in order to establish geometrically correct outer corners at their correct locations. Constraints on gutter symmetries, aligning of outer-boundaries by sweeping and so on can be ap-plied to achieve this. In the process of maintaining the roof ge-ometries, the top hierarchy can be given to preserving the gutter symmetries because of its global look. As such, individual boundary alignments can be performed based on the preserved gutters.
Figure 4: Convergence of outer edges with the inner roof skeleton (red
– inner skeleton, black – outer edges that intersect inner skeleton).
Figure 5 illustrates that the method explained in above sections is able to reconstruct different complex roof models.
Figuere 5. Corrrectly reconstructred roof models.
Figure 6 is an analyzed sample result of reconstructed building models based on the method explained in above sections, which are well fitted with benchmark reference data provided by ISPRS. The green color is because the majority of model planes correspond to low height residuals. This indicates that the verti-cal accuracy of the resulting roof models is adequate even for very high accuracy engineering applications. In contrast to the high vertical accuracy, a comparatively low planimetric accura-cy can be seen from the resulting models. As shown in Figure 6(b), both false positive and negative errors may arise in roof outlines which can hardly be corrected by exploiting only the
point cloud data. This demonstrates the necessity of refinement process.
Blue - false negative, red – false positive, yellow – true positive
Figure 6: Height and planimetric errors of resulting roof models derived from point clouds: (a) height error; and (b) planimetric error.
3.2 Model refinement
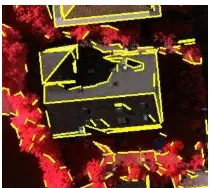
To automatically extract straight line segments from aerial photographs, the Burns line extractor (Burns et al., 1986) is used in this research. Although the line extraction is done at sub-pixel accuracy, the Burns line extractor - as in other line extraction methods - gave many irrelevant line segments related to unwanted objects such as vegetation patches, road features and border of shadow regions (Figure 7).
Figure 7: Extracted line segments using the Burns line extractor
In order to increase the efficiency of the refinement process, first unnecessary extracted lines are dropped out. This is done by projecting the initial models to the image space. Then, based on a buffer range, line segments which come into the buffer area is chosen assuming the ideal boundary line is within the defined buffer. For the easiness, the projected model lines and selected extracted lines (lines that come into buffer range) indi-cate as reference and candidates. In order to construct an object space line segment (3D) for a given reference, it is first neces-sary to find corresponding candidates from the stereo pair im-ages. In the case of multiple images, one way to perform this is to match candidates geometrically, relevant to two successive images at a time. Based on the projective geometry, how the plane intersection can be achieved in a homogeneous vector space is illustrated by (Heuel and Forstner, 2001) and (Heuel, 2004; Ok el al., 2010b). However, in this research, Euclidian coordinate space and the intersection of two or many planes are done to reconstruct object space line segments. Each step of the object space line reconstruction process is described in the fol-lowing sub sections.
3.2.1 Constructing object space line segments
their list of candidates to find other corresponding pairs of can-didates or 3D lines. In case of two images or one image with a roof plane, the constructed 3D line is taken straightaway as the goal is to construct the 3D line segment. But for multiple imag-es, unique candidates are first chosen by removing redundancies in the selected pairs and multiple plane intersection is finally performed based on the least square theories.
Figure 8: Viewing rays coming from end-points of a line segment (same object) in the image space (a, b and a , b represent the same object and in object space it is AB).
3.2.2 Constraints
Sometimes, from the closely located adjacent parallel candi-dates appearing in a pair of images (Figure 9), the chosen can-didate pair could be leading to a faulty result. Besides, the out-come could represent a building ground edge or another edge somewhere in a side wall, or even an arbitrary line in space, in-stead of the respective roof edge (Figure 9c). The perpendicular distance to the roof plane from the midpoint of the constructed 3D line segment is used for accepting the outcome (Figure 9d).
(a) (b) (c) (d)
Figure 9: Perpendicular distance to model plane: (a) and (b) subset of two neighboring images and their extracted line segments; (c) and (d) constructed object space line segment without and with distance to plane constraints (white boxes indicate desired area of interest, yellow lines – extracted edges, red and green lines – without and with the distance to plane constraint).
Although, we obtained 3D line segments from the above meth-od, some of the derived line segments may still contain some defects. One example is directional deviation of line segments due to the shadow effect (Figure 10). Missing line segments can also be seen relevant to some model edges defined by images. For a successful refinement of a building model, these issues should be overcome. With the aim of minimizing such defects and filling missing boundary edges, an additional step next.
3.2.3 Rectification of image line segments
In order to eliminate effect of missing edges, first it is identified whether it is relevant to a gutter or eave lines. If it is a gutter line, then if that boundary edge in the initial model follows rough gutter symmetry, then based on the line segment relevant to opposite gutter and one which is derived from images, the missing edge is re-established.
Figure 10: Defects (distorted convergence) of line segments derived
from mages (solid thick line – obtained edges from images,
grey lines – building outlines).
Similarly if a defective edge is found as shown in (Figure 10), then, by analyzing the adjacent eave derived from images the exact eave for the defective eave edge is rectified.
4. RESULTS & DISCUSSION
The performance of the method is analysed in the context of the ISPRS WG III/4 “Test Project on Urban Classification and 3D
Building Reconstruction”, which allows us to use external
reference data. For the analysis, we use only the test site “area3”
which contains residential area having small detached houses.
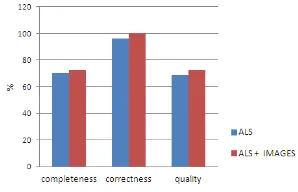
Figure 11 is the average overall evaluation results in terms of roof planes, and it illustrates that the correctness, completeness and quality of refined roof planes are increased slightly by the refinement process. Since the refinement process considers only the available buildings in the initial modelling results, i.e. excluding the missed buildings (FN) caused in the feature extraction, it is impossible to expect significant improvements on the completeness and quality.
Figure 11: Completeness, correctness and quality of model reconstruction before and after refinements – per-roof plane.
Table 1 Illustrates that the planimetric accuracy of roof models is increased, though it is not a substantial number.
Table 1:Planimetric accuracy assessment
Site
RMSd (m) planimetry
Before after
Figure 12 demonstrate the per-pixel evaluation results before and after refining the roof outlines. It is recognisable that false positive (FP) and negative (FN) errors along the roof outlines are now reduced. However, large blue regions are still remained as it is. Actually it is a limitation of the guided line searching process. Label images of the difference of DSMs (see Figure 13) elaborate that the heights errors close to the step-edge locations are restricted to a very narrow area. This is because the planimetric uncertainty of step-edges has decreased.
Figure 12: Per-pixel evaluation of area3 (yellow –true positive, red and blue – false positive and negative).
Figure 13: Difference of DSM as label image: before and after refinement is shown is left and right side respectively.
Figure 14(a) illustrates an effect due to the erroneous recognition of attached vegetation as the roof plane, leading to a FP error. This was successfully avoided based on the
assumption “polygon which doesn’t deliver any line segments
from image data may represent an erroneously reconstructed
roof”. Figure 14(b) illustrates erroneous overhangs caused by under-segmentation. In reality, these were effects due to the merging of close vegetation with the roof planes. All these effects were rectified during the refinement process.
Figure 14: Per-pixel evalaution of some selected buildings (yellow –true positive, red and blue – false positive and negative).
5. CONCLUSION & OUTLOOK
The results show that the refinement process further improves the indices completeness and quality. The correctness has reached to its top having100% value. This tells that now no more false positive roof planes. Since the approach is unable to find boundary lines for the building that are missed in initial roof models, those blue regions can be left out from the analysis. Then, one can say the results are fully improved. Of course, there are still very narrow false positive and negative errors which caused many reasons. Effect due to poor contrast difference extraction of the ideal boundary lines would be problematic. Shadow effect further reduces the positional accuracy of lines. At the time of constructing object space line segments, some errors could occur and sometime, when rectifying the missing and defective boundary edges, prediction could relies on erroneous line segments.
Planimetric accuracy is reached to 0.5 m range and which could hard to accomplish with the point clouds only as this range is roughly equal to the point space of laser scanner data which we used. The uncertainty around step-edge locations are not substantially decreased as their planimetric locations are now acceptable.
However, results can be further improved and further experiments are needed concerning the available false positive and negative narrow regions.
ACKNOWLEDGEMENT
The Vaihingen data set was provided by the German Society for Photogrammetry, Remote Sensing and Geoinformation (DGPF) [Cramer, 2010]: http://www.ifp.uni-stuttgart.de/dgpf/DKEP-Allg.html (in German). The authors wish to thank the organizers of the ISPRS Commission III/4 for providing the data.
REFERENCES
Brenner, C., Haala N., Fritsch D., 2001. Towards fully automated 3D city model generation. In: Workshop on Automatic Extraction of Man-Made Objects from Aerial and Space Images III, Ascona.
Burns, J. B., Hanson, R., Riseman, E.M., 1986. Extracting straight lines. IEEE Transactions on Pattern Recognition and Machine Intelligence 8(4), 425–455.
Cheng, L., Gong, J., Li, M., Liu, Y., 2011. 3D building model
reconstruction from multi-view aerial imagery and LiDAR
data. Photogrammetric Engineering and Remote Sensing, 77(2), 125-139.
Collins, R. T., Jaynes, C. O., Cheng, Y. Q., Wang, X., Stolle, F., Riseman, E. M., Hanson, A. R., 1998. The Ascender System: Automated Site Modeling from Multiple Aerial Images. Computer Vision and Image Understanding, 72(2), 143-162.
Förstner, W., 1999. 3D-city models: automatic and semiautomatic acquisition methods. Proceedings of Photogrammetric week 1999.
Haala, N., Kada, M., 2010. An update on automatic 3D building reconstruction. ISPRS Journal of Photogrammetry and Remote Sensing 65, 570-580.
Habib, A.F., Zhai, R., Kim, C. 2010. Generation of complex polyhedral building models by integrating stereo-aerial imagery and LiDAR data.
Photogrammetric Engineering and Remote Sensing 76 (5), 609–623.
Habib, A., Kelley, D., 2001. Single-photo resection using the modified
Hough transform. Photogrammetric engineering and remote
sensing 67(8), 909-914.
Huang, H., Brenner, C., Sester, M., 2013. A generative statistical approach to automatic 3D building roof reconstruction from laser scanning data. ISPRS Journal of Photogrammetry and Remote Sensing 79, 29-43.
Heuel, S., 2004. Uncertain projective geometry: statistical reasoning for polyhedral object reconstruction. Vol. 3008, Springer, 2004.
Jaw, J. J., Perny, N. H., 2008. Line feature correspondence between object space and image space. Photogrammetric Engineering & Remote Sensing 74(12), 1521-1528.
Lin, H., Gao, J., Zhou, Y., Lu, G., Ye, M., Zhang, C., Liu, L., Yang, R., 2013. Semantic decomposition and reconstruction of residential scenes from lidar data. ACM Transactions on Graphics 32 (4), 66:1-66:10.
Khoshelham, K., 2005. Region refinement and parametric
reconstruction of building roofs by integration of image and height data. International Archives of Photogrammetry, Remote Sensing and Spatial Information Sciences, 36, 3-8.
Kim, C., Ghanma, M., Habib, A., 2006. Integration of Photogrammetric and LIDAR data for realistic 3D model generation. Department of Geomatics Engineering, University of Calgary, Canada.
Kim, Z., Nevatia, R., 2004. Automatic Description of Complex Buildings from Multiple Images. Computer Vision and Image Understanding 96(1), 60-95.
Lee, D. H., Lee, K. M., Lee, S. U., 2008. Fusion of lidar and imagery for reliable building extraction. Photogrammetric Engineering & Remote Sensing 74(2), 215-225.
Lafarge, F., Descombes, X., Zerubia, J., Pierrot‐Deseilligny, M., 2010. Structural approach for building reconstruction from a single DSM. IEEE Transactions on Pattern Analysis and Machine Intelligence 32 (1), 135– 147.
Ma, R., 2004. Building model reconstruction from LiDAR data and aerial photographs. Ph.D. dissertation. Columbus, Ohio, The Ohio State University, 166 p.
Maas, H.G., Vosselman. G., 1999. Two algorithms for extracting building models from raw laser altimetry data. ISPRS Journal of Photogrammetry and Remote Sensing 54 (2-3), 153-163.
Mcintosh, K., Krupnik, A., 2002. Integration of laser-derived DSMs and matched image edges for generating an accurate surface model,
ISPRS Journal of photogrammetry and Remote Sensing, 56(3), 167–
176.
Noronha, S., Nevatia, R., 2001. Detection and Modeling of Buildings from Multiple Aerial Images. IEEE Transactions on Pattern Analysis and Machine Intelligence, 23(5), 501-518.
Ok, A. O., Wegner, J. D., Heipke, C., Rottensteiner, F., Soergel, U., Toprak, V., 2010a. A stereo line matching technique for aerial images based on a pair-wise relation approach. International Archives of Photogrammetry and Remote Sensing, 38(1/W17).
Ok, A. O., Wegner, J., D., Heipke, C., Rottensteiner, F., Soergel, U., Toprak, V., 2011. Accurate matching and reconstruction of line features from ultra high resolution stereo aerial images. In: Proceedings of ISPRS Hannover Workshop, High Resolution Earth Imaging for structure modeling: Concepts and performance. ISPRS Journal of Photogrammetry and Remote Sensing.
Rottensteiner, F., 2010. Roof plane segmentation by combining multiple images and point clouds. International Archives of Photogrammetry Remote Sensing and Spatial Information Sciences 38 (Part 3A), 245-250.
Sampath. A., Shan, J., 2010. Segmentation and reconstruction of polyhedral building roofs from aerial lidar point clouds. IEEE Transactions on Geoscience and Remote Sensing 48 (3), 1554-1567.
Schenk, T., Csatho, B., 2002. Fusion of LIDAR data and aerial imagery for a more complete surface description. International Archives of
Photogrammetry Remote Sensing and Spatial Information
Sciences, 34(3/A), 310-317.
Schmid, C. Zisserman, A., 1997. Automatic Line Matching Across
Views. In: Proceedings of CVPR, pp. 666–671.
Suveg, I., Vosselman, G., 2004. Reconstruction of 3D building models from aerial images and maps. ISPRS Journal of Photogrammetry and remote sensing, 58(3), 202-224.