COMPARATIVE ANALYSIS OF HAAR AND DAUBECHIES WAVELET FOR HYPER
SPECTRAL IMAGE CLASSIFICATION
Imran Sharif*, Sangeeta Khare
,
[email protected]Image Analysis Center, Defence Electronics Application Laboratory, Dehradun, India
KEY WORDS: Wavelet transform, Classification, Support Vector Machine (SVM), Airborne Visible Infrared Imaging Spectrometer(AVIRIS)
ABSTRACT:
With the number of channels in the hundreds instead of in the tens Hyper spectral imagery possesses much richer spectral information than multispectral imagery. The increased dimensionality of such Hyper spectral data provides a challenge to the current technique for analyzing data. Conventional classification methods may not be useful without dimension reduction pre-processing. So dimension reduction has become a significant part of Hyper spectral image processing. This paper presents a comparative analysis of the efficacy of Haar and Daubechies wavelets for dimensionality reduction in achieving image classification. Spectral data reduction using Wavelet Decomposition could be useful because it preserves the distinction among spectral signatures. Daubechies wavelets optimally capture the polynomial trends while Haar wavelet is discontinuous and resembles a step function. The performance of these wavelets are compared in terms of classification accuracy and time complexity. This paper shows that wavelet reduction has more separate classes and yields better or comparable classification accuracy. In the context of the dimensionality reduction algorithm, it is found that the performance of classification of Daubechies wavelets is better as compared to Haar wavelet while Daubechies takes more time compare to Haar wavelet. The experimental results demonstrate the classification system consistently provides over 84% classification accuracy.
1. INTRODUCTION
Remote sensing research focusing of image classification has long attracted the attention of the remote sensing community because classification results are the basis for many environmental and socio economic applications such as land cover classification, agriculture and urban land use(Gallego,2004). Extracting land cover information from remote sensing images is one of the key applications of remote sensing research (Campbell,1996). Hyper spectral remote sensing involves image acquisition and analysis of spectral cubes which are composed of tens and hundreds of narrow spectral bands. This process is used for extracting, identifying and classifying materials. The main assumption is that there are relations between the chemical, biological and physical properties of those materials and phenomena and the characteristics of their reflected radiation distribution. Those relations are the basis of remote sensing analysis(Sellers et al., 1995). The Hyper spectral sensors commonly oversample the spectral signal to ensure that narrow band features are adequately represented.
High dimensional data space generated by the Hyper spectral sensor creates a new challenge for conventional spectral data analysis techniques. The important job here is to eliminate this redundancy while at the same time preserving the high quality features for the classification algorithm. This dimensionality reduction process is referred to as feature selection (Backer,2005). The goal of dimension reduction is to map high dimensional data into a lower dimension while preserving the main features of the original data. Dimensionality reduction using wavelet filters (Haar and Daubechies) allows the separation of classes without significantly loosing the original information.Various applications use the wavelet transform for image compression, edge detection and image fusion particularly for synthetic aperture radar
(Niedermeier et al., 2000) multispectral and panchromatic data (Zeng and Cumming,2001).
Again, in conventional methods of classification, the number of samples required to train the classifiers increase exponentially with the number of bands used for classification. This makes it impossible to obtain reasonable estimates of the class-conditional hyper-dimensional probability density functions used in standard statistical classifiers(Jenson,1996).This is known as Hughes phenomenon (Landgrebe, 2002) or the curse of high dimensionality. In this situation, it is usually required to reduce the dimensionality of the data for hyper spectral image processing analysis and applications.
Several work devoted to the studies on the classification of hyper spectral remote sensing data have been reported in the literature(Tajudin and Landgrebs,1998). Common classifiers include the statistically-based technique such as the Maximum Likelihood (ML) and Support Vector Machine (SVM). SVM aim to maximize the margin between two classes of interest and place a linear separating hyper plane between them. As SVMs can adequately classify data in a higher dimensional feature space with a limited number of training samples, they overcome the Hughes Phenomenon
.
The foci of this paper are on providing a summarization of dimensionality reduction methods and techniques used for improving classification accuracy and compare the results of Hyper spectral classification accuracy and on discussing important issues affecting the success of image classification. In the next section, we briefly introduce the wavelet transform, Support Vector Machine classification algorithms. Then we describe the Hyper spectral dataset and experiments. This is followed by results, discussion and conclusions.
2. WAVELET
Discrete Wavelet Transform (DWT) has been exploited ( Mallat,1999) in order to extract the most discriminative multi scale features. Within the variety of already available techniques for Hyper spectral image reduction, the method of DWT is chosen for analysis because of the wavelet’s inherent multi-resolution properties and it preserves high and low frequency feature therefore preserving peaks and valleys found in typical spectra(Mallat,1989). This paper includes dimensionality reduction of Hyper spectral image using various wavelet filter.
I
n wavelet based approaches, the one dimensional DWT has generally been applied to pixel spectral signatures rather than to the magnitude of the spectral values. DWT separated the fine-scale and large-fine-scale information in the original signal into the wavelet detail and approximation coefficients respectively and the wavelet decomposition coefficients include all information of the original signal. Multi-scale features of the original Hyper spectral signal can be extracted directly from the wavelet decomposition coefficients.In this paper one dimensional discrete Wavelet transform will be used for reducing Hyper spectral data in the spectral domain for each pixel individually. This transform will decompose the Hyper spectral of each pixel into a set of composite bands that are linear, weighted combination of the original spectral bands.
2.1 Haar Wavelet
Haar wavelet is the fast and simplest. The Haar wavelet transform has the advantages of being conceptually simple, fast and memory efficient. Since it can be calculated in place without a temporary array. Haar wavelet is discontinuous, and resembles a step function. The high-pass(G) and low-pass(H) filters is given by
G = [1 wavelet filters (Burrus et al.,1998).
Mother Wavelet (�(�)) = �
2.2 Daubechies Wavelet
Daubechies Wavelet constructed a family of easily implemented and easily invertible wavelet transforms that in sense generalize the Haar transform. Like the Haar transform, the Daubechies wavelet transform is implemented as a succession of
decompositions. The only difference is that the filter length is more than two. So it is more localized and smooth.
Fig. 1.a Haar wavelet Fig. 1.b Daubechies wavelet
3. CLASSIFICATION
Classification is the process of taking an image and breaking it up into specified classes depending on the differences in Hyper spectral signature of each material. Pixels with similar Hyper spectral signatures are generally grouped into the same class. An effective dimension reduction algorithm will retain the information on each material enough that when ran classification, the same material should be grouped into the same class. In (Kempeneers et al., 2004), after applying DWT to Hyper spectral data wavelet coefficients, wavelet energies, and wavelet detail histograms have been used as features for classification. In this paper Support Vector Machine classification is used.
3.1 Support Vector Machine(SVM)
The statistical learning algorithm SVM has some advantage over the well established algorithms neural network and decision tree. It considers the dot product of the feature vectors to construct the optimal hyper plane rather than clustering or interpolation as like other classifiers. So there is less probability of losing important information during the modelling. The SVM approach seeks to find the optimal separating hyper plane between classes by focusing on the training cases that are placed at the edge of the class descriptors. These training cases are called support vectors. Training cases other than support vectors are discarded. This way not only is an optimal Hyper plane fitted but also less training samples are effectively used. Thus high classification accuracy is achieved with small training sets (Foody et al., 2004). This feature is very advantageous especially for remote sensing datasets where training samples tend to be less in number than in pixel based approaches. The SVM method was designed to be applied only for two class problems. For applying SVM to multi-class classifications two main approaches have been suggested one against one and one against all. The basic idea is to reduce the multi-class to a set of binary problems so that the SVM approach can be used. We used one against all approach for multiclass classification.
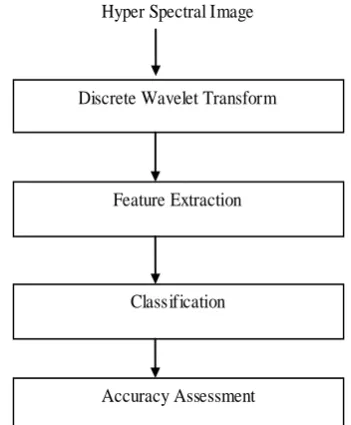
4. METHODOLOGY
SVM . SVM was used for classification because it gives better classification accuracy compare to other classifiers. Then we did accuracy assessment. Accuracy assessment is an important step which gives the true assessment of the result obtained. It gives the accuracy of classified image. validation data has been collected from different parts of the study area. Validation data also known as ground truth data. Here we are comparing wavelet filters in terms of classification accuracy and computational time.
Fig. 2. Block diagram for the wavelet-based classification system
5. EXPERIMENTAL DATASET
Dataset is of the Airborne Visible/Infrared Imaging Spectrometer (AVIRIS) sensor which is Hyper-spectral sensor. This dataset is used to investigate the effectiveness of the classifier to classify high dimensional data. The image is taken over of NW Indiana's Indian Pine test site. Its 224 wavelength-sensitive detectors obtain spectral data to reveal information about the viewed area's composition. From the original 224 spectral channels, 4 bands were discarded at the time of pre processing, so the data has of 220 bands. There are 20 atmospheric absorption bands in this data. This data very popular in research. An advantage of this data is the availability of reference ground truth image which can also be used to extract the training and testing samples required for classification and accuracy assessment. The area appears to be cover 2/3 agriculture and 1/3 forest or other natural perennial vegetation.
The centered spectral range (wavelength) of the data covers from
0.400 μm to 2.498 μm for all 220 bands. The classification algorithms applied to this data for demonstrate the performance of module. The classifications have been performed on a pixel by pixel basis. The image and the reference data is shown in the Fig 3.a and Fig 3.b. The reference data contain 16 different classes. Only 13 classes are considering in the classification, as other classes contain very few pixels. The one against one multi class classification algorithm is used because of its ability to train fast . Approximately half of the pixels from each class are used for training with the remaining 50% forming the test set on which performance is assessed.
6. RESULTS AND DISCUSSION
AVIRIS data set has been used for analysis. The centred spectral range of the data covers from 0.4 µm to 2.4 µm for all 200 bands. Input data, ground truth and classified data are shown in fig 3.a-3.f respectively.
Haar mother wavelet is arguably the simplest of all mother wavelets to implement that is why the Haar mother wavelet is commonly used. However, there exist infinitely many mother wavelets. In this paper commonly used mother wavelets were investigated. These mother wavelets are from the Haar and Daubechies families(Schowengerdt, 1997). Based on the mother wavelet classification accuracy can be greatly affected.
Daubechies are compactly supported orthonormal wavelet and preserves the energy of signals while Haar did compression which involves averaging and differencing. In our experiment it has been found that Daubechies filters provide better classification results than Haar but takes more computational time due to longer support of scaling and wavelet coefficients. However by increasing the filter length of Daubechies filter does not yield significant improvement in classification accuracy as shown in table 1. As we can see in table 1 classification accuracy using daub8 filter gives and daub10 filter is nearly same . Accuracy of classification algorithm mainly based on number of training sample of each class and consistency in classifying the same materials as the same class.
We saw that after dimension reduction certain materials were more distinct therefore they were identified correctly into different categories. Previous studies have shown that dimensionality reduction increases the classification accuracy (Burgers, 2009). DWT features bring not only sharp localization but also sharp frequency (Nunes et al., 2003) which leads to better classification with less number of features.
From a complexity point of a view, the whole algorithm complexity is in the order of O(MN), where M is the number of pixels in the spatial domain and N is the number of bands. We validated the different wavelet-based dimension reduction using supervised classifications(SVM) of Hyper spectral AVIRIS data. The results show that Daubechies wavelet-based dimension reduction method provides a good computational efficiency as well as a better classification.
Table 1. Comparison of Wavelet Filters
Wavelet Filter Computational Time(seconds)
Classification Accuracy(%)
Haar 45 83.8%
Db4 52 85.1%
Db6 54 85.3%
Db8 58 85.5%
Db10 60 85.6%
Hyper Spectral Image
Discrete Wavelet Transform
Feature Extraction
Classification
Fig. 3. AVIRIS Image , Ground Truth and Classification Results after Dimensionality reduction
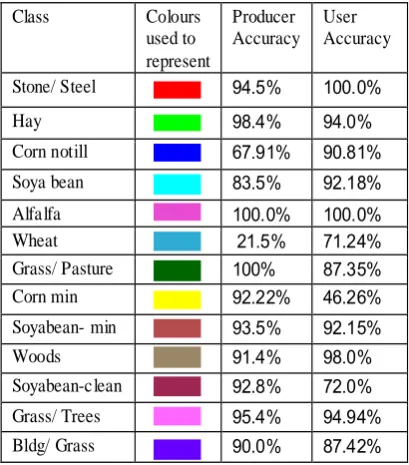
Table 2. Classification accuracy of AVIRIS data using Db10
Class Colours
used to represent
Producer Accuracy
User Accuracy
Stone/ Steel 94.5% 100.0%
Hay 98.4% 94.0%
Corn notill 67.91% 90.81%
Soya bean 83.5% 92.18%
Alfalfa 100.0% 100.0%
Wheat 21.5% 71.24%
Grass/ Pasture 100% 87.35%
Corn min 92.22% 46.26%
Soyabean- min 93.5% 92.15%
Woods 91.4% 98.0%
Soyabean-clean 92.8% 72.0%
Grass/ Trees 95.4% 94.94%
Bldg/ Grass 90.0% 87.42%
Accuracy assessment is performed by calculating the confusion matrix between ground truth data and classified image. The result of SVM classified image are given in Table 2 presents the User
accuracy and Producer accuracy derived from the confusion matrix with the test dataset. while after dimensionality reduction overall accuracy of classifier is 87.7% before dimensionality reduction and after dimensionality reduction it is 85.6% using Db10 wavelet filter. So there is nearly 1% classification accuracy decreases after dimensionality reduction. While table 3 shows number of training and testing sample of each class used in the classification.
Table 3. Number of samples for different classes of the Indian Pine data set used in the experiments
Class Training
Sample
Testing Sample
Stone/ Steel 34 27
Hay 69 77
Corn notill 118 178
Soya bean 152 171
Alfalfa 24 15
Wheat 57 74
Grass /Pasture 61 94
Corn min 132 136
Soyabean- min 177 209
Woods 167 110
Soyabean-clean 128 167
Grass/ Trees 140 93
Bldg/ Grass 45 32
Validation is an essential step for any classification which assess its accuracy by performing validation. One can evaluate the accuracy of the classification performed, whether all the classes in the image are classified correctly or not. For performing validation, we need to have the ground truth data . By using the ground truth data, pixel wise check is performed on the classified image and the accuracy is calculated.
7. CONCLUSION
In this paper we have compared the classification results of Hyper spectral data after dimensionality reduction from the Haar and Daubechies wavelet filter. We have qualitatively and quantitatively assessed the classification results by visual inspection and accuracy assessment respectively. By visual inspection it is clear from the classified images that the results from the Daubechies are better than the results from the Haar wavelet. This conclusion is confirmed by accuracy assessment shown in table 1 which shows that the accuracy in the form of overall accuracy of classification from the Daubechies are significantly higher than that obtained from the Haar wavelet. While Haar wavelet has less computational time than Daubechies wavelets.
DWT method outperformed from other techniques that consider only frequency content of the signal and not localized information such as FFT and DCT based feature extraction. Wavelet-based system is generally more sensitive to the selection of mother
a: A VIRIS Image b: Ground Truth
c: Classified Image Using Haar Wavelet
d: Classified Image Using Daub6 Wavelet Filter
f: Classified Image Using Daub10 Wavelet e: Classified Image Using
wavelet. However, with the appropriate selection of mother wavelet could produce better classification accuracies. When investigating which mother wavelet is best. it is found that the results vary from application to application. DWT is linear time complexity so it could be an appropriate choice as a data dimensionality reduction tool.
We showed that the Wavelet Reduction method yields better classification accuracy. This can be explained by the fact that Wavelet reduced data represent a spectral distribution similar to the original distribution but in a compressed form. Thus the high dimension of Hyper spectral data which is a curse for various conventional classification algorithms can be used very effectively after reducing its dimension using the proposed approach. However this method needs to be verified for some more Hyper spectral data. Further an algorithm for picking up the optimal (nature, range) subset of bands may be considered as future scope of research.
8. REFERENCES
Backer S., 2005. Band selection for hyperspectral remote sensing, IEEE Geo. and Rem. Sens. Lett., vol. 2, no. 3, pp. 319.
Burgers, K., Fessehatsion, Y., Rahmani, S., Seo, J. and Wittman,T., 2009. A comparative analysis of dimension reduction algorithms on hyperspectral data, LAMDA Research Group.
Burrus S., R. Gopinath, and H. Guo, 1998. Introduction to Wavelets and Wavelet Transforms: A Primer, 1/e. Englewood Cliffs, NJ: Prentice- Hall.
Campbell, J. B., 1996. Introduction to remote sensing (2nd ed.). New York: Guilford Press.
Foody, G.M. and Mathur, A., 2004, A relative evaluation of multiclass image classification by support vector machines. IEEE Transactions on Geoscience and Remote Sensing, 42, pp. 1336– 1343.
Gallego, F.J., 2004. Remote sensing and land cover area estimation. International Journal of Remote Sensing, 25, pp. 3019–3047.
Jensen, J. R., 1996. Introductory digital image processing: a remote sensing perspective (2nd ed.). Upper Saddle River, N.J.: Prentice Hall.
Kempeneers P., S. B. De Backer, W. Debruyn, and P. Scheunders, 2004. Wavelet based feature extraction for hyperspectral vegetation monitoring,” Image and Sig. Proc. for Rem. Sens., vol. 5238, pp. 297–305.
Landgrebe, D., 2002. Hyper spectral image data analysis. IEEE Signal Process. Mag., 19, pp. 17-28.
Mallat, S.G., 1999. A wavelet tour of signal processing, Academic Press, 2nd edition, San Diego.
Mallat, S.G., 1989. A theory for multiresolution signal decomposition : the wavelet representation, IEEE transactions on Pattern Analysis and Machine Intelligence, 11(7), pp. 674-693.
Niedermeier A., E. Romaneeßen, and S. Lenher, 2000. Detection of coastlines in SAR images using wavelet methods, IEEE Trans. Geosci. Remote Sensing, vol. 38, pp. 2270–2281.
Nunes J.C., Y. Bouaoune, E. Delechelle, O. Niang, and P. Bunel, 2003. Image analysis by bidimensional empirical mode decomposition, Image and Vision Computing, vol. 21, no. 12, pp. 1019 – 1026.
Nunez J., X. Otazu, O. Fors, A. Prades,V. Pala, and R. Arbiol, 1999. Multiresolution- based image fusion with additive wavelet decomposition, IEEE Trans. Geosci. Remote Sensing, vol. 37, pp. 1204–1211.
Richards, J. A., & X. Jia, 1999. Remote sensing digital image analysis: an introduction (3rd ed.) Berlin; New York: Springer.
Schowengerdt R.A., 1997. Remote Sensing: Models and Methods for Image Processing. Orlando, FL: Academic Press.
Sellers, P. J., B. W. Meeson, F. G. Hall, G. Asrar, R. E. Murphy, R. A. Schiffer, F. P. Bretherton, R. E. Dickinson, R. G. Ellingson, C. B. Field, K. F. Huemmrich, C. O. Justice, J. M. Melack, N. T. Roulet, D. S. Schimel, & P. D. Try., 1995. Remote sensing of the land surface for studies of global change: Models - algorithms - experiments. Remote Sensing of Environment, 51, pp. 3-26.
Tajudin S. and D. Landgrebs, 1998. Classification of high dimensional data with limited training samples, PhD thesis school of electrical and computer engineering, West Lafayette, Indiana.