Risk factors in stock returns of Canadian
oil and gas companies
Perry Sadorsky
Schulich School of Business, York Uni¨ersity, 4700 Keele Street, Toronto, Ontario, Canada M3J 1P3
Abstract
This paper uses a multifactor market model to estimate the expected returns to Canadian oil and gas industry stock prices. Results are presented to show that exchange rates, crude oil prices and interest rates each have large and significant impacts on stock price returns in the Canadian oil and gas industry. In particular, an increase in the market or oil price factor increases the return to Canadian oil and gas stock prices while an increase in exchange rates or the term premium decreases the return to Canadian oil and gas stock prices. Further-more, the oil and gas sector is less risky than the market and its moves are pro-cyclical. This suggests that Canadian oil and gas stocks may not be a good hedge against inflation.Q2001
Elsevier Science B.V. All rights reserved.
JEL classifications:G12; L71; Q40
Keywords:Asset pricing; Oil prices; Risk factors
1. Introduction
The trade off between risk and return is one of the central issues faced by individuals who trade equities, manage portfolios, or engage in capital budgeting. This concern is particularly relevant in volatile industry sectors like the natural resource sector. The natural resource business is a complex business for at least three reasons. First, it is capital intensive. New mining projects and pulp mills can
Ž .
E-mail address:[email protected] P. Sadorsky .
0140-9883r01r$ - see front matterQ2001 Elsevier Science B.V. All rights reserved. Ž .
cost billions of dollars to build. Second, natural resource companies are dealing with a depleting resource base. In order to remain in business natural resource extraction companies are continuously searching for low cost natural resource deposits to exploit in order to replace their depleting asset base. Third, natural
Ž .
resource companies produce a product e.g. copper, gold, nickel, oil, pulp which is fairly homogeneous. Since product differentiation is not possible with raw
com-Ž
modities, the best performing natural resource companies in terms of return on
.
investment and stock price appreciation are generally those companies that are the lowest cost producers.
The last decade has been particularly turbulent for the energy industry. Various
Ž . Ž .
political the 1990 Gulf War , economic the 1997 Asia crisis , and financial crises
ŽRussia, and Long Term Capital Management all in 1998 have impacted global.
petroleum demand and supply. There are two channels through which these recent economic and financial crises have impacted the world petroleum markets. First, there is a direct impact stemming from the reduced demand for energy in Asia. The Asian countries are big users of petroleum products and falling demand in these countries led to reduced worldwide demand and consequently lower oil prices. Lower oil prices in turn generate less government revenue, and budget deficits, for big oil exporters like Russia and Venezuela. Nearly half of Russia’s hard currency comes from oil exports, while close to 80% of Venezuela’s hard
Ž .
currency comes from oil exports The Economist, 1999 . In the case of Russia, lower oil prices were at least partly responsible for the August 1998 devaluation in its currency and the defaulting on its debt.
The second channel through which recent economic and financial crises have impacted the world petroleum markets is through consumer confidence. Investors fleeing risky investments move money into safe havens like US treasury bonds. This had severe consequences for hedge funds, most notably Long Term Capital
Ž .
Management LTCM . By the middle of 1998, LTCM was operating as a macro hedge fund. That is, LTCM was speculating on financial markets on the basis of their analysis of financial and macroeconomic conditions. For example, LTCM was betting on exchange rate movements, changes in macroeconomic policies, interest rate movements and other speculative opportunities. Most macro funds are highly leveraged with the amount of money invested in portfolios greatly larger than the
Ž .
share capital. This allows highly leveraged funds to make or lose vast sums of money. International financial conditions were weak throughout the summer of 1998. Then in August of 1998, the Russian government devalued the ruble and suspended debt payments. This led to a reduction in credit-worthiness in many emerging market bonds and large increases in the spreads between the prices of Western government and emerging market bonds. These spread increases were very bad for LTCM because the fund had bet heavily on the spreads narrowing. By
Ž
the end of August 1998, LTCM had a capital base of $2.3 billion compared to an
.
ŽDowd, 1999 . Shortly afterwards, the Federal Reserve organized a rescue of.
LTCM.
Ž
Economic and financial crises lead to a strong US dollar as international
.
investors look for a safe haven for their investments which, in turn, leads to consumers outside the US reducing their purchases of US dollar denominated
Ž .
petroleum products Bloomberg and Harris, 1995; Sadorsky, 2000 . Petroleum product demand is hard to predict but is generally highly correlated with worldwide industrial production. Petroleum product supply, in the absence of supply disrup-tions, is slightly easier to predict because three quarters of world oil production
Ž
and 90% of oil reserves is controlled by state owned oil companies United States
.1
Energy Information Administration, 1999 .
The importance of the energy sector is particularly evident in a country like
Ž
Canada, which is the world’s fifth largest energy producer after the United States,
.
Russia, China and Saudi Arabia . In 1996, natural gas accounted for 34.6% of
Ž .
Canada’s primary energy production, followed by petroleum 27.6% , electricity
Ž26.8%, of which 21.0% was from hydroelectricity 5.8% from nuclear and 0.01%
. Ž .
from other , and coal 11.0% . In 1998 energy production contributed approxi-mately 8% to Canada’s GDP. The energy sector is the second largest sector after manufacturing. The significance of the energy sector in Canada is also evident in stock market capitalization. In Canada, the energy sector accounts for approxi-mately 8.3% of stock market capitalization, while in the United States the energy
Ž
sector accounts for approximately 5.6% of stock market capitalization The Globe
.
and Mail, 1999 .
The Canadian petroleum products industry is extremely capital intensive, and consequently requires continued high levels of capital investment to renew its technology base.2 The capital intensiveness of an industry can be measured by
calculating the ratio of the capital invested relative to that industry’s contribution to GDP. In 1993 there was $8.0 of capital in the Canadian petroleum products industry for every dollar of value added GDP. This figure is much higher than the manufacturing industry average of $2.6. Consequently, the Canadian petroleum products industry is very sensitive to interest rate conditions. The refining portion of the Canadian petroleum industry is also very productive. In 1993 value added
1
Rough calculations can be obtained from Table 2.2, World Oil Supply, 1995]1999, and Table 8.1, World Crude Oil and Natural Gas Reserves. These tables are located in the international petroleum
Ž
data section of the web site www.eia.doe.govremeuripsrrt22.txt, www.eia.doe.govremeur
.
ieartable81.html . From Table 2.2, total state production is assumed to be total world supply less total
wŽ . U x
OECD supply 73.65y19.87r73.65 100 . From Table 8.1, state owned reserves are assumed to be
w Ž
total world reserves less North American and Western Europe reserves 1033.2y 73.8q
.x U 4
18.9 r1033.2 100 .
2
per refinery employee was approximately $196 000 compared to $55 000 per worker
Ž .
for the manufacturing industry as a whole Industry Canada, 1999 .
The energy sector is important to Canada’s trade sector. Approximately 10% of Canada’s exports are energy exports, with approximately 90% of all energy exports
Ž
going to the United States United States Energy Information Administration,
.3
1999 . This suggests that the petroleum products industry is sensitive to the exchange rate between the Canadian and US dollar.
Canadian oil and gas companies, like many other petroleum products companies in the world, are price takers in the global market for crude oil. This means that oil
Ž
and gas companies that do not pursue risk management via hedging or other
.
financial engineering activities can experience erratic or significant energy price
Ž .
volatility which in turn could impact their cash flows Fusaro, 1998 . Lower oil prices mean lower profit margins and reduced capital expenditures while higher oil prices mean higher profit margins and, possibly, increased capital expenditures. Annualized price volatility for crude oil is approximately 25% per year while
Ž .
natural gas volatility is approximately 40% per year Fusaro, 1998 . Consequently, the price of crude oil is likely to be a source of risk for stock returns.
Given that interest rate, oil price, and exchange rate factors are important to the Canadian oil and gas industry, it is somewhat surprising that more research has not been done on the interaction between these factors and the returns to Canadian oil and gas industry stock returns. This is the area where this paper makes a contribution.
This paper studies Canadian oil and gas industry stock returns using a multifac-tor market model which allows for several risk premiums. Results are presented to show that exchange rates, crude oil prices and interest rates each have large and significant impacts on stock returns in the Canadian oil and gas industry.
This paper is organized as follows. Section 2 presents the model and the econometric methodology used. Section 3 discusses the data while Section 4 reports the empirical results. Section 5 concludes the paper.
2. The model and econometric methodology
A model for relating oil company share price exposure to various risk factors can
Ž
be constructed using a multifactor market model Jorion, 1990; Khoo, 1994; Faff
.
and Chan, 1998; Faff and Brailsford, 1999 . An oil beta can be calculated by estimating the following multifactor market model.
Ž .
RitsaqboRotqbmRmtq«t 1
Ž .
In Eq. 1 ,Rit is the monthly excess equity returns on the oil and gas stock index, Rmt is the monthly excess return on the market index, and Rot is the monthly return to oil prices. The parameters,bm andbo are the market beta and oil beta,
3 Ž .
Ž . Ž .
respectively. Eq. 1 is estimated using ordinary least squares OLS and model adequacy is checked using various regression diagnostic tests.
Ž .
Model 1 may be underspecified in that interest rate factors and exchange rate
Ž . Ž
factors are not included. Consequently model 2 which adds an interest rate term
. Ž .
premium factor, Rtpt and exchange rate factor, Ret to model 1 , may be more appropriate.
Ž .
RitsaqboRotqbmRmtqbrRtptqbeRetq«t 2
Ž .
Model 2 is estimated by OLS and model adequacy is tested using regression diagnostic tests. Recursive estimation techniques are used to assess the structural stability of the model.
3. Data
The data are monthly and cover the period 1983:4]1999:4. All economic data come from the Statistics Canada economic database. Oil price shares are measured
Ž .
using the Toronto Stock Exchange TSE oil and gas index. Let Rit denote the oil and gas share portfolio excess return which is the return to the TSE oil and gas share price index in excess of the 1-month T-bill rate.
Oil prices are measured using oil futures prices on West Texas Intermediate crude oil. Futures prices are used rather than spot prices because spot prices are more affected by short-run price fluctuations due to temporary shortages or surpluses. The oil futures price data are from the Prophet Information Services,
Ž . Ž .
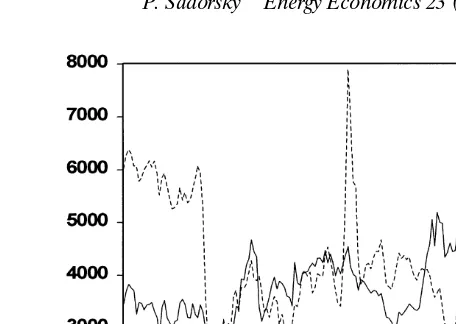
Inc. 1999 data bank. Following Fama and French 1987 continuous series is constructed using the nearby futures contract with at least 1 month to maturity on the first trading day of each month. An inspection of Fig. 1, which shows a plot of the TSE oil and gas share price index and oil futures prices, indicates that in most cases the oil and gas share price index moves with the price of crude oil. The variable Rot denotes the monthly growth rate in West Texas Intermediate crude oil
Ž . Ž . Ž .
futures prices. Huang et al. 1996 , Jones and Kaul 1996 and Sadorsky 1999 investigate the link between oil price shocks and US stock market returns. Faff and
Ž .
Brailsford 1999 detect oil price risk across several industry sectors of the Aus-tralian economy.
Rtpt is the interest rate variable calculated as the premium between the annual yield on the 90-day Canadian Treasury bill and the yield on the 30-day Canadian
Ž .
Treasury bill Harvey, 1989 . This variable represents the risk free short-term discount rate. The T-bill premium, which is an indicator of the present state of the economy, tends to be lower during economic downturns and higher during periods of strong growth. The T-bill rate is negatively correlated with real economic output
Ž .
growth for up to 1 year ahead Fama and French, 1989; Chen, 1991 . Interest rate
Ž .
risk has been studied in the gold mining industry by Stone 1974 , Martin and
Ž . Ž .
Fig. 1. TSE oil and gas index and crude oil prices.
Rmt is the market portfolio excess return which is the return to the TSE 300 value weighted common stock price index in excess of the 1-month T-bill rate. The market return is a proxy for changes in aggregate economic wealth that affects risk
Ž .
premia and expected returns Fama and French, 1989; Ferson and Harvey, 1991 . The variable Ret is the monthly growth rate of the Canada]US exchange rate
Ž$USr$C . This is the exchange rate $C. Ž r$US most relevant to Canadian compa-.
nies. The exchange rate variable is a proxy for foreign exchange risk. Exchange rate
Ž .
risk may be particularly important for multinationals Jorion, 1990 or natural
Ž . Ž .
resource companies Louden, 1993; Khoo, 1994 . For example, Louden 1993 and
Ž .
Khoo 1994 both found that Australian gold stock movements were related to exchange rate movements. Overall there has been little work done on the impact of foreign exchange risk exposure to oil and gas companies.
A priori, it is expected that oil price and exchange rate factors each have a positive impact on oil and gas stock returns, while the term premium has a negative impact on oil and gas stock returns. If oil and gas stocks are useful for hedging
Ž .
inflation then the market beta should be negative Pring, 1991 .
4. Empirical results
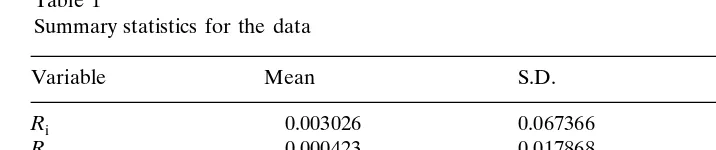
Summary statistics for the data are presented in Table 1. Thet-statistics indicate that oil and gas share price returns, market returns, crude oil price returns, and exchange rate returns do not have significant means while the term premium does have a significant mean.
Table 1
Ri 1.000 0.207 0.439 y0.083 y0.207
Rm 1.000 0.023 y0.069 y0.019
Ro 1.000 0.103 y0.062
Rtp 1.000 0.146
Re 1.000
exchange rate returns and the term premium are each negatively correlated with
Ž .
oil and gas share price returns Table 2 . Multicollinearity is not present among the explanatory variables.
Visual inspection of the data indicates none of the series exhibit trends. Consequently, all unit root test regressions were run with a constant but no trend
Ž .
term. Table 3 reports the results from Dickey and Fuller 1979 and Phillips and
Ž .
Perron 1988 unit root tests. Both the Dickey and Fuller test results and the
Ž .
Phillips and Perron 1988 test results indicate that each variable is stationary in first differences at the 1% level of significance.
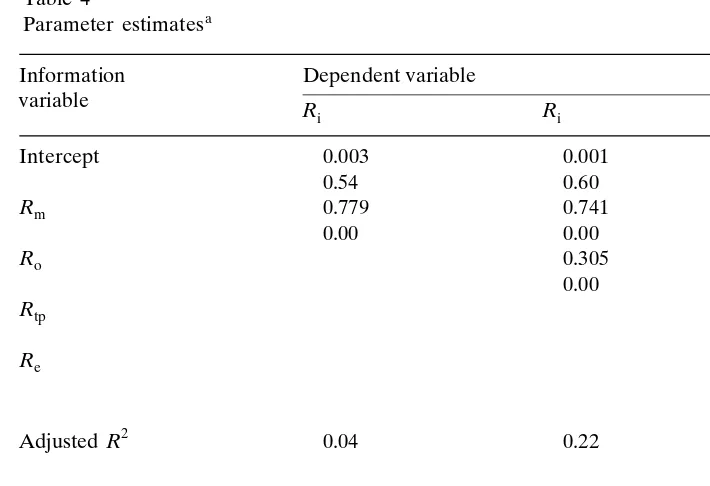
Table 4 presents regression equation results for the single factor model and the
Ž . Ž .
multifactor models 1 and 2 . Standard errors for the parameter estimates are
Table 3
Critical values from Hamilton 1994 . , , denotes a statistic is significant at the 1%, 5% and 10% level of significance, respectively. The parameter, l, is a truncated lag parameter used in the non-parametric correction for serial correlation and is set according to the sample size. The parameter
Table 4
Residual diagnostic tests Pvalues are reported
Ž .
Newey and West 1987 HAC standard errors are used to compute estimated coefficient P-values.
Ž . Ž .
P values are shown below coefficient estimates. AR 1 and AR 6 are Breusch and Godfrey lagrange
Ž . Ž .
multiplier test statistics for residual serial correlation at lags 1 and 6 Greene, 1990 . ARCH 1 and
Ž . Ž .
ARCH 6 are Engle 1982 lagrange multiplier test statistics for residual ARCH effects at lags 1 and 6.
Ž .
RESET is a Ramsey 1969 miss-specification test with degrees of freedom in parentheses.
Ž .
computed using the Newey and West 1987 heteroskedasticity and autocorrelation coefficient consistent covariance matrix. Results for the single factor model indi-cate that the estimated coefficient on the market return is statistically significant. This is not too surprising given the large literature on the capital asset pricing
Ž .
model CAPM . The estimated beta of 0.78 indicates that the oil and gas industry has been less risky than the market.4 The positive market beta indicates that oil
and gas stocks were not a good hedging tool over the period 1983:05]1999:04. The adjusted R2 value is low and the regression diagnostic tests indicate evidence of
Ž .
autoregressive conditional heteroskedasticity ARCH effects and miss-specified
w Ž . x
functional form as measured by Ramsey 1969 RESET tests .
Ž .
Results for model 1 indicate a market beta of 0.74 and an oil beta of 0.31. Both of these coefficients are positive and statistically significant. The adjusted R2 value
4
indicates that 22% of the variation in oil and gas share price returns can be
Ž .
explained by market returns and oil price returns. Model 1 has considerably higher explanatory power than the single factor market model. The residual diagnostic test statistics, however, indicate the presence of ARCH effects.
Ž .
Estimation results for model 2 are presented in the fourth column of Table 4. The general finding is that each of the multifactor variables is individually
statisti-Ž .
cally significant. The multifactor market return beta 0.71 is numerically similar to the market return betas estimated in the other two regressions. This provides some
Ž .
support for the robustness of the market return beta. The oil price beta 0.31 is positive and statistically significant. This result provides evidence to support the conjecture that oil price movements impact oil and gas stock returns. The esti-mated coefficients on the term premium variable and the exchange rate variable are each negative and statistically significant. A higher term premium increases borrowing costs thereby lowering oil and gas stock returns. The negative coefficient on the exchange rate variable, measured as $Cr$US, is somewhat unexpected given that a lower Canadian dollar helps Canadian energy exports. To obtain a negative sign on the exchange rate variable, a depreciation of the domestic currency must increase firm costs by more than it increases firm revenues. The
Ž .
overall effect, which has been observed in the gold mining industry by Khoo 1994 , is a deterioration of a firm’s financial position. For example, Canadian companies importing machinery and equipment from the United States and borrowing money outside of Canada would all be financially worse off with a falling Canadian dollar.
Ž .
The multifactor market model represented by Eq. 2 in the fourth column of
2 Ž .
Table 4 has the highest adjusted R value 0.25 . The joint F-test constraining all slope coefficients equal to zero is rejected at the 0.00 probability value. This indicates the significance of having all four of these variables in the regression model. The regression diagnostic tests indicate that at the 5% level of significance, there is no evidence of serial correlation, ARCH effects or miss-specified functio-nal form. Consequently, this model appears to be adequately specified.
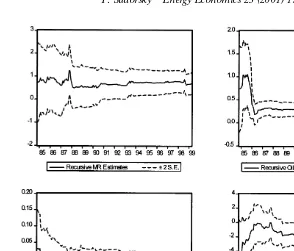
The estimation period covers the somewhat turbulent time of the late 1980s and the early 1990s. Consequently it is important to test the multifactor model in Eq.
Ž .2 for structural breaks. This is accomplished by recursively estimating regression
Ž .
Eq. 2 over the sample period. One way of checking parameter stability is to estimate the multifactor market model recursively and plot the recursively esti-mated coefficients with associated standard error bands. The plots shown in Fig. 2 suggest that a structural stability problem probably does not exist since, for each factor, the size of the estimated coefficient is fairly similar over the entire sample period.
5. Concluding remarks
Fig. 2. Recursive coefficient estimates.
market, oil price, term premium and exchange rate factors. In particular, an increase in the market or oil price factor increases the return to Canadian oil and gas stock prices while an increase in exchange rates or the term premium decreases the return to Canadian oil and gas stock prices. Furthermore, the oil and gas sector is less risky than the market and moves pro-cyclically. This suggests that Canadian oil and gas stocks are not a good hedge against inflation. These results demonstrate the factors that are important to energy risk management at a time when financial engineering in the energy business is becoming more important. A number of current developments in the energy sector highlight the importance that these factors will play in the future.
sour crude and large volumes of non-conventional crude. For various political reasons, Canadian refineries did not invest in heavy, sour crude upgrading tech-nology in the 1980s. As a result Canadian refineries are now expected to make significant upgrades over the next 10 years. Increased exposure to interest rate risk is likely to be a major concern in the energy industry.
These capital improvements come at a time when the Canadian industry expects little or no growth in overall demand for petroleum products over the next several years. In comparison, Canada’s net exports of petroleum products are expected to increase over the next 10 years. Consequently, Canadian oil and gas companies will be exposed to increasing risk in exchange rates.
The cyclical nature of the oil and gas industry suggests that uncertainty about oil price volatility is a constant concern. Oil price hedging is one means of dealing with this uncertainty. Many oil and gas companies, however, have not realized the benefits of energy risk management. Hedging oil price, interest rate, and exchange rate risk will allow the oil and gas industry more flexibility through better management of cash flow.
Acknowledgements
I would like to thank an anonymous reviewer, the editor, and Irene Henriques for helpful comments.
References
Bloomberg, S.B., Harris, K.S., 1995. The commodity-consumer price connection fact or fable? Federal Reserve Board of New York. Econ. Policy Rev. October, 21]38.
Chen, N., 1991. Financial investment opportunities and the macroeconomy. J. Finance 46, 529]554. Dickey, D.A., Fuller, W.A., 1979. Distribution of the estimators for autoregressive time series with a
unit root. J. Am. Stat. Assoc. 74, 427]431.
Dowd, K., 1999. Too Big to Fail? Long-Term Capital Management and the Federal Reserve. Cato Institute, Briefing Papers, No. 52.
Engle, R.F., 1982. Autoregressive conditional heteroskedasticity with estimates of the variance of UK inflation. Econometrica 50, 987]1008.
Faff, R., Brailsford, T., 1999. Oil price risk and the Australian stock market. J. Energy Finance Dev. 4, 69]87.
Faff, R., Chan, H., 1998. A multifactor model of gold industry stock returns: evidence from the Australian equity market. Appl. Financ. Econ. 8, 21]28.
Fama, E., French, K., 1987. Commodity futures prices: some evidence on forecast power, premiums, and the theory of storage. J. Bus. 60, 55]73.
Fama, E., French, K., 1989. Business conditions and expected returns on stocks and bonds. J. Financ. Econ. 25, 23]49.
Ferson, W., Harvey, C., 1991. The variation of economic risk premiums. J. Polit. Economy 99, 385]415. Fusaro, P.C., 1998. Energy Risk Management: Hedging Strategies and Instruments for the International
Energy Markets. McGraw Hill, New York.
Harvey, C.R., 1989. Time-varying conditional covariances in tests of asset pricing models. J. Financ. Econ. 24, 289]317.
Huang, R.D., Masulis, R.W., Stoll, H.R., 1996. Energy shocks and financial markets. J. Futures Mark. 16, 1]27.
Industry Canada, 1999. http:rrstrategis.ic.gc.carSSGrpo0119e.html Jones, C., Kaul, G., 1996. Oil and the stock markets. J. Finance 51, 463]491.
Jorion, P., 1990. The exchange-rate exposure of US multinationals. J. Bus. 63, 331]345.
Khoo, A., 1994. Estimation of foreign exchange exposure: an application to mining companies in Australia. J. Int. Money Finance 13, 342]363.
Louden, G., 1993. The foreign exchange operating exposure of Australian stocks. Acc. Finance 32, 19]32.
Martin, J.D., Keown, A.J., 1977. Interest rate sensitivity and portfolio risk. J. Financ. Quant. Anal. 12, 181]195.
Newey, W., West, K., 1987. A simple, positive semi-definite, heteroskedasticity and autocorrelation consistent covariance matrix. Econometrica 55, 703]708.
Perron, P., 1997. Further evidence on breaking trend functions in macroeconomic variables. J. Econometr. 80, 355]385.
Phillips, P.C.B., Perron, P., 1988. Testing for a unit root in time series regression. Biometrika 75, 335]346.
Pring, M.J., 1991. Technical Analysis Explained, 3rd ed McGraw Hill.
Prophet Information Services, Inc., 1999. Commodity Data Bank, Mountain View, California. Ramsey, J.B., 1969. Tests for specification errors in classical linear least squares regression analysis. J.
R. Stat. Soc. Ser. B 31, 350]371.
Sadorsky, P., 1999. Oil price shocks and stock market activity. Energy Econ. 21, 449]469.
Sadorsky, P., 2000. The empirical relationship between energy futures prices and exchange rates. Energy Econ. 22, 253]266.
Stone, B.K., 1974. Systematic interest-rate risk in a two-index model of returns. J. Financ. Quant. Anal. 9, 709]725.
The Economist, 6]12 March 1999, p. 25. The Globe and Mail, 19 March 1999, p. B11.