*'
&
':,.:.nVolume
18
'
Number
I
.
2015.
ISSN
1328-1143
SPECIAT
ISSUE
ConterenEe
in
Mernory
ol
Poul
tVliller
Introduction
Phil
LewisCorference in Memory of Paul
Miller
- opening address by Barry ChiswickBarry
R. ChiswickNegative and Positive Assimilation by Prices and by Quanrities
'Barcy
R. Chiswick andPaulW,
Miller
Skills Deepening or Credentialism? Education Qualifications and Occupational Outcomes, 1996 -201 |
Tam
Karmel
Externalities and the Social Return to Education
in
Indonesia LosinaPurnastuti
andRuhul Saliru
Does School Socio-economic Status Influence University Outcomes?
Ian
W.Li
and A.Michael
DockeryOccupational Attainment and Earnings among Immigrant Groups: Evidence
from
New ZealandShaleh A. Maani, Mengyu
Dai
andKerr Inkson
The Employment and Occupational Outcomes of Indian Male Migrants in the Australian Labour MarketBilalRafi
The Determinants of Academic Achievement Among Primary School Students:
A
Case Study of the Australian Capital TerritoryJenny Chesters and Anne
Daly
ffiffi#LqBoUR
ECONOMIICS
AJOURNff.
or
{ABqJp
EcoNoM}sAND
iIABouRiREIAT.IONS
rssN
tr328_1143 ,Official fournalof
the Australian Societyof
'L*bour EconomistsMonoging
EtfifiorPhil Lewis" Uaiven$y olCanberra
Co-eclilrorc
Siobhan Aus{ea, Carrla {Jniwrsitv
flne
Daly. Univcrcity ofCanturia Alan Durrcan, Cunin tJiivenityBoyd ttuntrr, Th€Aastrrrlirra
isrional
lJniversity Sholelr Maani, Tkc liniversity
"7 ar.W"
ri'
-'
"'
Book Review Editror
Mark Cully, Deparr* eat o{ lndusrry and Science
Editoriot Asaietonl ond"Subecriplidns
Monoger
Fat Madden, Curtin {fniversity
Ediloriot Boord
Garry Earre[ ,The liniwrsity of Sydney Bruce Bradbury,The
uniruixy
ojiei
SouthWatet
William Brown, Cambridge
Uil*rriiy
John Burgess, Cartin {}niiersity
Bruce Chapm an, The Australian Narional
tJnivers iry
Phfh
Cobb-Clark, The Uniuersiy-qM;i;;;,
Peter Dawkin s, Vicroria lJniversity Yichael Docke ry, C*rtin llnivenity
Denise Doi ron" The {-lnivenit y of fiew Sowl. Wales
Bob c-regorg The Au s*atian-wi
u*"tiii *rri*
Ann Harding. University o! Canberia
Rqia Junankar, tJnivedry
of
New South WolesJohn King, LaTtobe
univ*sity
Kostas Mavromaras. Flinders'Uniwrsity
Wi I I iam M itchel t, The I) n ive rs ir y oy
i.'*"o,
tl"
Karen Mumford, lJniversity
ojyod
Margaret Nowak, C urt in t iailersityDavid Peetz. Griffith lJniversiry
Jacques Poot, lJniversity of Wiikato
Russell Ross, Ihe Universiry ofsydney
El i zabeth Sava ge, ll n ive
n
iiy iy f"" *nangy, Syd n e y
Peter Siminski, tJniversity of WoUoogoof'
f-enryth Wif ron, iy'arioa &
n"riritJiii"a"rion
( rJA E) Mark Wooden,The llnive*iry ofMelbourne
' Marie Claire Villevat,Un*eiiiy
afLyin
'-Grophic
DesignYelena Mehan,Screen ldyl!
Subscriplions
ond
poyrnentPat Madden
Subscriptions Manager
Australian Journal of labour Economics Bankwest Curtin,Economics Centre Curtin Business School, Curtin Universit5 CPO Box U1987 penh WA 6845 erstraii^
2015
$ubscfption
rotes* Includes CST
Conlocl
deloits:Telephone
6l
BgZffi l-?J1Email patricia.madden@ct,s.ci:;:::.1;:
;u':
W:!.p"g
hnp:i.'business.cunrr :- - ;-
-jirjrch
publications,journals a-ile lnje r. ;: -:Within Aust
*tliet*
lnternatianallyear
tndividua!
ffi
Students
$65
AS90Institutions Sl35
ASl6iStudents
Sl:,i
ASI9S
lnstirutions
Sj-j0
ASi50Contents
AUSTRALIAN
JOURNAL
OF
LABOUR ECONOMICS
Volume
18
'
Number'l
'
2015
SPECIAL
ISSUEGonference in Memory
ol
Poul
Miller
I
IntroductionPhil Lewis
3
Conference in Memory of PaulMiller
-opening address bY BarrY ChiswickBarrY R.Chiswick
5
Negative and Positive Assimilation by Prices and by Quantities Barry R.Chiswickand PaulW'Miller
29
Skills Deepening or credentialism? Education Qualifications and Occupational Outcomes' 1996-201I
75
Tom Karmel
ExternalitiesandtheSocialReturntoEducationinlndonesia
fl*#
twq$-t:fid
Ruhul SalimDoes School Socio-economic Status Influence University
Outcomes?
Ian'W.
Li
and A. Michael DockerYOccupational Attainment and Earnings among Immigrant Groups: Evidence irom New Zealand
Shoteh A. Maani, Mengyu Dai and Kerr lnkson
The Employment and Occupational Outcomes of Indian Male Migrants in the Australian Labour Market
Bilal
RafiThe Determinants of Academic Achievement Among Primary School Students: A Case Study of the Australian capital Territory
JennY Chesters and Anne DalY
*
O 2015 THE CENTRE FOR LABOUR.MARKET RESEARCH
rssN 1328-1143 95
113
131
Also ovoiloble from INFORMIT LIBRARY qt: http://seorch'informit'com'ou
-
53
AUSTRALIAN JOURNAL OF LABOUR ECONOMICS
Votume lO . Number ,l . 20lS . pp 53 _ 74
ond
the
Sociol
Return
to
in lndonesio
Yogyakarta State University
Grrtin
Universityb n*bly
known
that
educationprovides
economic benefitsto
individuals.', cducation also has the potential to generate significant externalities. These
clfects of education,
in
Indonesia, are the focus of the current paper. Theyimatigated
usinga
local
labour
rnarket (the province) approach. Significantffiufities,as
highas, or even muchhiglrcr than,the private return to schooling, are*rynted,
using both OLS andIV
estimations. Sensitivity tests involving separate?q
sfor
skill groups along the linesof Moretti
(2004a) and Muratryev (20O8),zte
that thisfinding
is
robust. The results thus strongly support the view tlruthrrr:ng
in education is more itnportantlor
aggregate economic outcomes thanit
iskfu
individuals who doso.It
appears that there is a clearrolefor
the governntentfuering lurther
exparusion af education opportunities in Indonesia.Iqpwords: Externality, Earnings, Experience, Returns to schooling, Instrumental
ruiables
JEL Classification: I2lO,l22O, J24O, J3lO
l.
lntroduction
Studies
of
the returnto
educationin
Indonesia have shown thatthis
is much lower thanin
comparator countries.r For example,Duflo
(2001) reported that the return to! The Indonesian economy shifted from a controlled €conomy to a market driven economy in 1fti6
(Ananta and Arifin,2008). Refening to the general pattern of the return to schooling in economic transition countries, the low return to schooling in Indonesia in the late 2000s invites a question.
At this period, where the economic reform process had already reached the market driven economy
stage, the return to schooling is expected to be higher than the estimates described in this section. Address
for
correspondence:Dr
Losina Purnastuti, Facultyof
Economics, Yogyakarta State University, Kampus Karangmalang Yogyakarta Indonesia 55281. Email: [email protected] Acknowledgement: Purnastuti,Miller
and Salim acknowledge financial assistanee from the Australian Government through the Australian Development Research Awards Scheme (ADRAS).Helpful comments from two anonymous referees are gratefully acknowledged. However, authors
remiin responsible for any error. Miller passed away while the paper was under revision. We dedicate this paper in honour of Professor Paul Miller.
AUSTRALIAN JOURNAT OF LAEOUR ECONOMICS
VOLUME IS. NUMBER I . 2OI5
education ranged
from
6.8to
10.6 per cent, based on data from the 1995 inter-census surveyof
Indonesia. Similarly, Comola andMello
(2010), using datafrom
the 2004 Indonesian labour market survey, foundthat the return
to
education estimated by ordinary least squares rangedfrom
9.49 per centto
7O.32 per cent.It
wassimilar
to these figures when sample selectivity correction methods of estimation were employed.Both Duflo
(2001) and Comola andMello
(2010) have a focuson a
single average return to yearsof
education. Other studies have examined variationsin
the return to education according to the level of schooling. Thus, Deolalikar (1993), based on data from the 1987 round of the National Socioeconomic Survey and the Village Potential module ofthe
1986 Economic Census, reported that the returnsto
schooling rangedfrom
around 10 per cent for workerswith
some primary schooling, to close to 2O per cent for workerswith
secondary or higher education.In
comparison, Psacharopoulos (1981, 1985 and 1994) reported that the returns to schooling for Asian countries are 31to 39 per cent, 15
to
18.9 per cent and L8to
19.9 per cent for primary, secondary, andtertiary
education, respectively. Hence, notonly is
the returnto
schooling relatively low in Indonesia, but it also exhibits a pattern across levels ofeducation that is different from that in most other comparator countries.Moreover, there
is
evidence that the returnsto
schoolingin
Indonesia havefallen
in
recent years. Thus,Puriustuti,
Miller
and Salim (2013a) reported that the payoffto
schoolingin
Indonesia Ln 2OO7|2OO8 was several percentage points lower thanin
1987. They argue that this may belinked
to the large-scale expansionof
the education sector in that country.Investment
in
educationby
the governmentis
in
part dueto
the benefits to the economyof
ahighly
educated workforce. The main measureof
these benefits is the private return discussed above. Indeed, for Indonesia, this appears to be the only measure of the benefits of education. From this perspective, the picture of relatively low rates of return, rates of return that are relatively modest at the primary and secondary level, andof falling
rates of return, mightcall
into question the recent, and planned, rapid expansionofthe
education sector in Indonesia.However,
the
private
monetary gains associatedwith
additional
yearsof
schooling are only one part of the potential benefits of education. Another potentially important componentof
the benefitsto
society as a whole is the external effectsof
education. These external effects are the focus of the current paper.The rest
of
the paper proceeds as follows. Section 2 outlines the conceptual framework and related empirical evidence for this study. This framework is based on the idea that education. can have external effectsin
local labour markets. Section 3outlines the data sets used.
Empirical
results are presented and discussedin
section 4. Both ordinary least squares and instrumental variables methodsof
estimation are used. Some sensitivity analyses are presentedin
section 5, and these are followed bya conclusion
in
section 6.2.
Conceptuol
Fromework
ond
Empiricol Evidence
55
LOSINA PURNASTUTI AND RUHUT SALIM
Externolitles ond the Soclol Relurn to Educotion ln lndonesio
channels,they can learn fromothers,andhence enhancetheirproductivity andearnings,
without
cost, Education externalities need not belimited to
market externalitiesof
this
type.A
wide rangeof
other potential externalities have been discussedin
the literature (see,for
example, McMahon, 2OO7), such as more informedvoting
and better parenting practices. However, most empirical research has focussed on local labour market monetary externalities using the Mincerian equation.z Acemoglu (1997) and Acemoglu andAngrist
(2000) develop theories about monetary externalitiesof
education, whereas Jacobs (1970) discuss nonmonetary externalities of education.Recently
Fu
(2007)
proposesthat
human capital
externalities penetrate through four channels. Workers can learn from their occupational and industrial peers, who arein
the same local labour market, through the depth (quality)of
the human capital stockin
the local labour market; Marshallian labour market externalities, or specialisation and peer competition effects; Jacobs labour market externalities or the diversityof
the local labour marketin
termsof
occupations and industries; and the thickness (density) of the local labour market, or labour market pooling effects. The depth of human capital stock captures the vertical difference of knowledge i.e. workers with better human capital in their fields can learn more and faster than those with lower human capital levels in their fields. Marshallian labour market externalities emphasize technological spillovers. According to this phenomenon workers can learnfrom
the local concentration of same-occupation and same-industry peers. While Jacobs labour market externalities consider the benefit from urban diversity which resultsfrom
thevariety
and diversityof
geographical proximate industries that promote innovation and growth. The thickness of a labour market considers how workers benefit from the thickness or density of a local labour market. The higher the thickness of a local labour market the higher the possibility that worker can socialize more frequently and build social networks more easily to exchange information.Acemoglu
and
Angrist
(2000) and Rudd
(2000)
study
human
capital externalitiesin
the US atthe
state level, whereas Rauch (1993) andMorreti
(1998,2OO4a) investigate human capital externalities in that country at the metropolitan area
(cities) level.
A
study for Canada by Rakova and Vaillancourt (2005) also has a focus on metropolitan area-level data. Similarly, two studies of less developed countries are based on disaggregated data, namely Kenya (district level), and China (city level).Acemoglu and Angrist's (2000) research was based on a panel
of
US states, and accounted for state-fixed effects as well as for the endogeneity of the average andindividual
schooling variables. The focus was on white men aged 40-49, using datafrom
the 1960-1980 US Censuses. Acemoglu and Angrist (2000) measured aggregate human capital by the average years of schooling at the state level. The main findingsof
this research suggest that a small external return, of about one per cent (mostly ranging from one to three per cent), is possible, though the effect was statistically insignificant in the
IV
estimations.2 Moretti
QOO4a) argues that there are two separate reasons why an increase in the share of
educated workers may increase total wages over and above the private return to schooling. First,
if educated workers and uneducated workers are imperfect substitutes, an increase in the share of
57
LOSINA PURNASTUTI AND RUHUL SALIM
Externollties ond the Soclol R€turn to Educollon in lndoneslo
3.
Empiricol
Conceptuolisotion ond
The
augmentedMincerian
earnings equationin
Indonesian labour market can be written as:Ln(E,) = frs+ P,S, + Z Br+ X Br+ e,
Doto
the
current application
to
theWhere ln(E
i
is natural logarithm of monthly earningsof
individual j. These monthly earnings include the value of all benefits secured by an individual in their job. The variablesfor
individual characteristics employedin
the estimations are yearsof
schooling (S,),job experience and its square,job tenure and its square, marital status, urban areaof
residence, and gender (X,). These are standard control variablesin
anestimation of this type.
The external effect
of
human capital(Z)
can be internalisedwithin
a small group, such as a firm, or a bigger group, such as a city, province, or state. consequently, two approximations for the aggregate-level human capital measure are used. Thefirst
aggregate-level human capital measureis
based on the provinceof
residence. The second aggregate-level human capital measureis
based on theindustrial
sectorof
employmentwithin
the province.Within
each of these aggregate-level human capitalmeasures twotypes ofvariables are constructed,basedonthe average years of schooling
of
workers and on the percentageof
workerswith
higher education qualifications.Thus, the
aggregate-level humancapital
measuresfor
each pr<rvinceare:
(i)
the average yearsof
schooling amongall
the workersin
the province (AveSchool);(ii)
the province-specific average years of schooling
in
the industrial sectorin
which the worker is employed {Aveschool-lnd); (1iiJ the percentage of college or higher-degree holders among all the workers in the prcvince (PerHE); and (iv) the province-specific percentageof
college or higher-degree holdersin
the industrial sectorin
which the worker is employed (PerHE-Ind).3Estimating external returns to schooling using the OLS approach invites the question
of
whether the estimation resultswill
sufferfrom omitted
variablesbias-As
notedby
Acemoglu andAngrist
(2000) andMoretti
Qao4a), among others, the unobserved characteristics of individuals and provinces could be correlatedwith
the average yearsof
schooling or the percentageof
higher education graduates, and thiscould
raiseindividuals'
earnings, biasingthe
coefficienton the
aggregate human capital me asure.An
IV
approach is used to address this potential source of bias. Two instruments are considered, namely the ratio of higher education institution per 1,000 people (HE1000), and the percentage of household use clean water (CW).While
both
the HEIOOO andelectricity
variables are availablefor
use asinstruments
for
the province-level variables, suitable variables are not availablefor
their
industry-level counterparts. However,we are
instrumenting AveSchool-Intl andPerHE-Ind
rusing internal instrumentsfollowing Lewbel
eo12).4This
approachis
basedon the
useof
the
productof
heteroscedastic residualsfrom a
first-stage3 The externalities
estimated using these variables are those which Choi 1ZOtt1 OescriUes as static externalities, as distinct from the learning externalities examined in his calibrated (using US data) growth model.
4 We are_grateful to Christol-he1
n
Baum and Mark E, Schaffer for access to their Ivreg2h Stata module that implements Lewbel's (2012) heteroskedasticty-based procedure.
56
AUSTRALIAN JOURNAT OF LABOUR ECONOMICS
VOLUME 18. NUMBER I . 2ot5
Tirrning to developing countries, Kimenyi et
al.(2oo6)
applied the augmented Mincer equation to analyse returns to education and the social externality of educationat the district level in Kenya. The data used were derived from the Welfaie Monitoring Survey
of
1994 undertaken by the Central Bureau of Statistics in Kenya. The resultsoi
this study provided evidence of significant human capital externalities in urban areas.
Liu
(2007) investigated the external returnsto
education associatedwith
ameasure
of city
average educationin
China.This
study was based on thelggg
and 1995 waves of the Chinese Household lncome Project. Several approaches to estimate the impactof
human capital externalities were employed, such asOLS
estimation using city average education for city-level education, OLS estimation using the fraction of college-educated workers for city-level education,IV
estimation, and estimationof
the external returns by education group. The OLS estimates indicate that a one-year increasein
city
average education could raise the earningsof
individuals by 4.9 per cent to 6i7 pet cent. TheIV
estimates of the external returns rangefrom 1l
per"r11i to 13 per cent.
As
such the social returns to education, which"o.rii.t
of
thejrivate
and external returns, were as high as 16 per cent in the mid-l99os in urbanchina.
Turning to the case of Indonesia, McMahon, Jung and Boediono (1992), and Behrman and Deolalikar (1993) analysed the rate
of
return to education. McMahon, Jung and Boediono (1992) compared the social return between general and vocational schools in major regions of Indonesia and foundthat
rate of returnvaries from
fiveto22pet
cent on average forall
regions but narrows to nineto
14 per cent in caseof
the most densely populated areaof
Central Java. Considering the gender difference on the rate of return to schooling, Behrman and Deolalikar (1993) found that private rates of return to schooling investments in females are higher than are those to rnales. Sohn (2013) analysed both the monetary and nonmoneiary returnsto
educationin
Indonesia using Mincerian specification andquintile
regression approach. He found that monetary rateof
return is lowerfor
self-employment thanfoi
paid employment for person- and- sector specif,c reasons. He also found positive, substantial and robust non-monetary effects of returns to education above and beyond absolute and rolatiyg level of monetary returns to education.Thus, the literature indicates that the importance of human capital externalities depends
on
the
levelof
disaggregation.significant
results are obtained when the aggregate human capital is measured at thecity
or district level.In
studies where the levelof
analysis is extended to a wider geographical area, such as the state level, the human capital externalities are generally not significant. The literature also has two other features. First, the measuresof
human capital that are comrnonly utilised are the averageof
the yearsof
schooling, and the proportionof
workerswith
collegeor
higher degrees, However, the studies indicate that where human capital externaiities are important they are important regardlessof
the aggregate human capital measure employed. Second, mostof
the studies suggest that when estimating human capital externalities there should be consideration of a potential endogenity problem.tI
$li
[li
HI
flll
58
AUSTRALIAN JOURNAL OF LABOUR ECONOMICS
VOLUME I8. NUMBER I . 2OI5
equation explaining variation
in
the endogenous regressor and each of the exogenous regrossors as generatedor internal
instruments.In
general,the
greater the degree ofheteroscedasticityin
the first-stage regression the better (thatis,
the higher the correlation of the generated instruments with the endogenous variable) the instruments. The data used are taken from four sources. Individual-level data are takenfrom
the IndonesianFamily
Life
Survey4
(IFLS4).IFLS4
is
a nationally representative sample comprising 13,536 households and 50,580 individuals, spread across provinces o1 tfu" islands of Java, Sumatra, Bali, West Nusa Tenggara, Kalimantan, and Sulawesi' Together these provinces encompass approximately83
per centof
the Indonesian poputation and muchof
its heterogeneity.IFLS4 was fieldedin
late 2007 and early ZObS.It
was a collaborativeeffort by RAND,
the Centerfor
Population and Policy Studies of the University of Ga-djah Mada, and Survey Meter. Average provincial-level data are taken from the BPS - Statistics Indonesia and theMinistry
of Manpower and Transmigration(MoMT).
The variables to instrument the average years of schooling and thef"t""rrt"g"
of workers with higher education variables are based on datafrom
the BPS - Statistics Indonesia and theMinistry
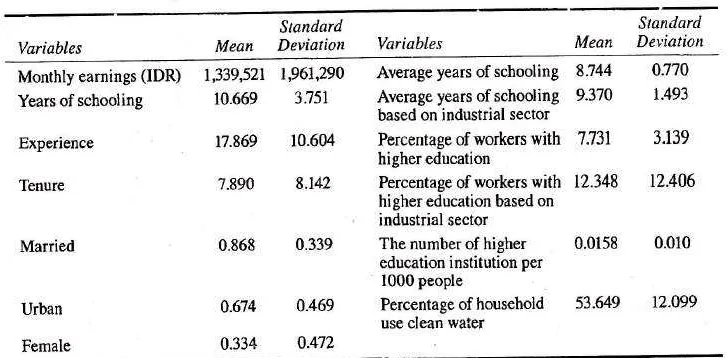
of National Education (MoNE)'Table 1 shows the summary statistics for the variables. The mean total monthly earnings
in
logform
are 5.908 across the workers. The mean yearsof
schooling is relativety low, specifically 10.67 years, and so exceeds the nine yearsof
compulsory studyby
slightly
less thantwo
years. The workersin
the sample have mean work experienceof
approximately 17.87 years. The tnean iength of job tenure is 7'89years-Toble
I
-Summory Stotistics
of Voriobles
a
{
F
!
IJ
,r
T
ft
T
i
t
T
I
i
t
!
I
Variables
Standard
Mean
Deviation VariablesStandard
Mean
Deviatiott Monthly earnings (IDR)Years of schooling Experience Tenure
Married
Urban Female
r,339,s2t 1961,290
10.669
3:15117.869
10.6047.890
8.1420.868
0.339a.674
0.4690.334
0.4'12Average years of schooling Average years of schooling based on industrial sector Percentage of workers with
higher education
Percentage of workers
with
12.348
12.406 higher education based onindustrial sector
The number of
higher
0.0158
0.010 education institution per1000 people
Percentage of
household
53.649
12-099 use clean water8344
0:I'109.370
1.4937:t31
3.139Source: Authors' calculation based on IFLS4, BPS's, MoMT's and MoNE's databases.
Table
2
presents some characteristicsof
the provincial-level data.[t
shows asubstantial variation in the number of people - between 1.1 and 40.6 million
-
across the provinces. There are four provinces in the samplewith
a population of over 10million.
ihree
of
these provinces are locatedin
Java Island, namely Jawa Barat, Jawa Tengah,i
I
i
I
illl
[image:9.595.117.481.390.569.2]59
LOSINA PURNASTUTI AND RUHUL SALIM
Externolltl€s ond the Soclol Reiurn to Educotion ln lndoneslo
and Jawa Timur. Jawa Barat is the most populated province among these (populatiou
of
40.6 million), followed by Jawa Timur, Jawa Tengah, and Sumatera Utara, which have populationsof
37million,
32.5million,
and 129million,
respectively. The province*iit,
ttr" smallest population is Kepulauan Bangka Belitung,with
1.1 million inhabitants.In terms ofthe average years ofschooling for workers in each province, Daerah Istimewa Yogyakarta
(DIY)
has the highest average yearsof
schooling,with
12'22 years of schooling. However, this figure is just equal to an individual who completed senior high school (grade 12). The province with the lowest average years of schooling for its workers is Riau, 9.42 years of schooling, and this is just equal to an individual who completed basic education (grade9)-Toble
2 -Chorocteristics of
Provinciol-Level
Doto
Province
2007t2008 population (thousands)
Per cent of workers with higher education
The number of
higher education institution per
1,000 people
Per cent HH use
clean water Sumatera Utara
Sumatera Barat Lampung Kepulauan Riau Riau
DKI
Jawa Barat
Jawa Tengah
DIY
Jawa Timur
Banten Bali NTB
Kalimantan Selatan Sulawesi Selatan
12938.3s 4:t30.45
7,289.8
1,423.00
5,130.10
9,105.40 40,623:t0 32,503.35 3,451.50 36995.20
9,512.90 3491.90 4,328.15 3*21.65 3121.6s
6.38 8.46
10.71
7:15 16.20
7:31
s.68 r033 5.49
'1.89
8.64 5.04 5.50 7.80
0.0026 0.0096 0.037
0.011
0.0084 0,039
0.011 0.012
0.012 0.012 0.012
0-021
47.82
46.29
40.11 69.33
3490
8C-36 41.97
5071
66,93 57.63 45.05
6336
46:12
53.89 48.26
0.018
0.023 0.0026
Source: Authors' calculation based on IFLS4, BPS's, MoMT's and MoNE's databases.
The
percentageof
the
workerswith
higher
educationis
low.
Only
three provinces in the sample have a percentageof
their workerswith
highff
educationof
more than 10 per cent, namely Daerah Khusus Ibukota
(DKI)'
Kepulauan Riau, and DIY,with
l6.2O,LO3l and 10.43 per cent, respectively. Nusa Tenggara Barat(NTB)
is70
AUSTRALIAN JOURNAL OF LABOUR ECONOMICS
VOLUME 18. NUMBER I . 2ols
The main
set
of
analyses suggeststhat
human capital
externalities areeconomically important in Indonesia. The OLS estimate
of
these istypically
as large as the private return to schooling, which means that the social return is about doub'iethe private return to schooling. The
IV
estirnates are associated witheven higher values of the externalities, of over two times the magnitude of the private return to education. These sizeable externalities are also a feature of the labou; market outcomes
of
both males and females.The results of the study of imperfect substitutability between low-skilled and high-skilled workers strengthen our conclusion that human capital spillovers exist
in
Indonesia. Hence, the resultsof
this study strongly support the view that investingin
education is even more importantfor
aggregate"corro-i"
outcomes thanit
isfor
theindividuals who do so'
This
study also provides evidenceof
the existenceof
human capital externalities as high as, or even much higher than,the private rcturn to schooling. Thus, there would appear to be a clear rolefor
the public,""to,
fostering educatio]t and human capital development in order to seize the benefit of these externalities.Appendix
Toble
AI
-
lVwith
Externol lnstruments plus Lewbel,s
Generoted
lnstruments (AveSchoot
osAggregote
Humon
Copitotj
Standard IV lV with Generated Instrumenls
IV with Generateil
htsfiunents and
Ex!ernal lnstuments
Variable
Nutnber ol higher education
institution per 1,000 people
Per cent househokl
use clean water
Number of.hrghgt educalrcn
inslitution per 1,000 people
Per rent
household
use clean
waler
Number
o{hish!
educal0n insilntion per 1,000 people
Per cenl household
use clean
water
Constant
Years of schooling Experienc Experiencd/100 Tenure Tenure'/100
Marital status
Urban
Female
AveSchool
F test (weak identification est)
Observations
4.8109 ***
(00737)
0.0409 ***
(0.0016)
0.0060 x**
0.0020
-0.0001 ** (0.0045)
0.0171 **+
(0.0020) -0.0302 r'** (0.006s)
-.0008
(0.0180) 0.1042 *** (0.0126)
0.1893 *r*
(0.0ue)
0.0595 ***
(0.0080) 5,t47311 4,528
4'1990***
(0.0733)
0.0409 x**
(0.0016)
0.0060 **x
(0.0021)
-0.0001 **x (0.0045).
0.0171 *x,I
(0.0020)
_0.0302 *xr' (0.006s)
_.0009 *** (0.0180)
0.1039 *x* (0.0126)
_0.1893 x** (0.0r19)
0.059 ***
(0.0080) 1.1e+M 4,528
4.8i54 ***
(0.2e70)
0.0410 x*x (0,0016)
0.0061 **,r (0.0021)
-0.0104 *x
(0.0046)
0.0171 **'*
(0.0020) -0.0302 *** (0.0065)
..0008
(0.0180) 0.1043 *'r* (0.014e)
-0.1893 *r,r'
(0.0119) 0.0580 * (0.0349)
25310
4,528
4.9154 *x*
(0.2e70)
0.0410 ***
(0.0016)
0.0061 ***
(0.0021) -0.0104 x* (0.0046)
0{}171 *Ef (0.0020)
-0n302 ***
(0.0065) -.0008
(0.0180) 0.1043 *** (0.014e)
-0.1993 ***
(03ll9)
0.0580 x (0.034e)
25110
4,5?8
4.9140 *** (0.0733)
0.M10 +**
(0.00i6)
0.0061 ***
(0.0m1)
-0.0104 x*
(0.0045)
0,0171 ***
(0.0020) -0.0302 *** (0.0065)
-,0008 (0.0r80)
0.1043 *x* (0.0126)
-0.1893 *** (0.0119)
0,0582 *** (0CI080)
2,?47.346
4528
4.8023 ***
(0.0730)
0.0409 r** (0.0016)
0.0060 x** (03021)
-0.0104 ** (0,004s)
0.0171 ***
(0.0020 -0.0302 +x* (0.0065)
-.0008
(0.0180)
0.1040 ***
(0.0126) _0.1893 *** (0.0119)
0.0595 *** (0.007e) 2,395.848
4,528
N.oles: Clustered (a!]evel ofprq,rnce) standard errors in parentheses. *, +* and *** denote statistical
69
LOSINA PURNASTUTI ANO RUHUL SALIM
Externolitles ond the Sociol Return to Educoflon ln Indonesto
Toble
6 - Estimotesof
Externol
Returnto schooling
when
lndividuol
qnd
Averoge
Schooling
ore
treoted
osEndogenous Voriobles
Externality Measure
Years of schooling Percentage with higher educationofworkers
Type of Instrument
Parental education and numb.er of HE
,nstfiutton per
(ii)
(i)
Parental education and number ofHE
institution per 1,000 people Variable
Constant
Years of schooliag Experience
Experience2/100 Tenure
Tenure2/100
Marital status
Urban Female
AveSchool
PerHE Observations F-test of exogeneity
4.0075 *** (0.2667)
0 .0'147 *,F*
(0.0045)
0.0111 **r,
(0.0023) -0.0099 ** (0.0047)
0.0128 *+* (0.0021)
_0.0251 *** (0.0067)
-0.0302 (0.0186)
0.0334 ** (0.0159)
_0.1908 *** (0.0r215)
0.1084 *** (0.0320)
4528 26-5235 'kt6*
4.8007 *** (0.0se3)
0.0759 *** (0.0044)
0.0118 *** (0.0022)
-0.0109 ** (0.0046)
0.0123
***
(0.0021)-0.0247 i,** (0.0067)
-0.0316 * (0 .0187)
0.0296 * (0.0164)
-0.7924.*** (0.0122)
0.0182 r<{"<
(0.0054) 4528 27.6469 *** I,000
Noles.' Clustered (at level of province) standard errors in parentheses. *, ** and *** denote statistical significance al the 10 per cent, five per cent and one per cent levels, respectively.
6.
Conclusion
Using
IFLS4
data, this paper has analysed whether a relationship exists between the aggregate-level ofhuman capital and individual earnings in Indonesian provinces, and also whether this relationship reflects the presence of human capital externalities. The estimations are based on Mincerian earnings regression augmented with measuresof
the aggregate-level human capital in each province and in the industrial sectorwithin
each province. Specifically, four alternative measures of aggregate-level human capital
are used, namely the average years of schooling, the percentage of workers with higher education, the average years
of
schooling based on the industrial sectorwithin
each68
AUSTRALIAN JOURNAL OF LABOUR ECONOMICS VOLUME 18 . NUMBER I . 20]5
(i)
Endogeneity
ot
tndividuot
ond
Average
Schooting
Following Acemoglu and
Angrist
(2000), wefurther
address the endogeneityof
both the individual and average schooling variables. The levels ofeducationofpaients
and the numberof
higher education institution perlO00
people are used as instruments. The variationin
the parental education variables,"-.,
individualsin
a given age grouP aPpears to provide a superior basisfor
theIV
framework than variables that haveminimal
variation across groups (see, purnastuti,Miller
and Salim,20r3b).The results from the first-stage estimation reveal that father's years of schooling and mother's years of schooling both have highly significant positive influences on the individuals' years of schooling.
At
the aggregate level,it
is ipparent that father,s and mother's yearsof
schooling do not impact the average s"trootirrg variable, measured using either Aveschoolor
PerHE.The
numberof
higher educ-ationinstitution
perl00o
people continues to have a marked impact on the provincial-Ievel human capitalmeasures- An F-test' robust to the clustering in the data, of the null hypothesis that Loth variables are exogenous was rejected, suggesting that an
IV
approach to accommodate endogeneity is appropriate.The results reported in table 6 are distinguished. by an increase in the private return to schooling of about three percentage points compared to the estimations where the worker's individual years of schooling was treated as exogenous. Nevertheless, the
estimated external returns are as least as large as the private rJurns, and typically much larger for the model using Aveschoor. For example, in the column (i) specification, the private return to schooling is 7.47 , and the externality effect is close to 10.g4 per cent. These results support the conclusion
of
the analysesin
the previous sub-sections, to the effect that the educafion externalities in Indonesia are sizeable, andas such warrant consideration in public decision making over expenditure levels on education.
Thus our results suggest that the most obvious outcome of the private returns
to
schooling is higher earnings. However, an additional yearof
schooiing raises the levelof
economicactivity
more thanits
private return. The resultsof
tfre studyof
imperfect substitutability between
low-skilled
andhigh-skilled
workers strengthen reveals that human capital spillovers exist in Indonesia. Provinces with higherrriou.rt
high-skilled workers have higher human capital externalities.
This
finding supports the Marshallian propositions of labour market externalities. This canu"
"*pt"in"a
uy67
LOSINA PURNASTUTI AND RUHUL SALIM
Externollties ond the Soclot Return io Educoflon in lndonesio
skilled workers than they have on the earnings
of
low-skilled workers. Hence, rhesefindings appear
to confirm
the presenceof
human capital externalities, since bothof
the aggregate-level human capital variables are associatedwith
increasesin
the earnings of high-skilled workers. This result is similar toMoretti
(2004a), thoughin
Moretti's analyses forthe US an increase in the proportion of high-skilled workers had a larger positive effect on the wagesof
low-skilled workers thanit
had on the wages of the high-skilled workers. The relativity in the current paper between the effectsfor
high-skilled and low-skilled workers is, however, consistentwith
Heuermann's (2011) recent findings forGermany-The coefficient
of
the PerHE variablefor
workers without higher education is O.OO88, whereas the coefficientof
this variablefor
workerswith
higher educationis
0.0170. These estimatesfor
thePerHE
variable indicatethat a
one percentage point increasein
the percentageof
workerswith
higher educationin
each provinceis
associatedwith
increasesin
the earningsof
low-skilled workersof
0.88 per cent, and increasesin
the earningsof
high-skilled workersof
170 per cent. These results support the finding discussed earlier in this sub-section.In conclusion, these estimates on the samples disaggregated by
skill
level give further assurance in relation to the existence of human capital externalities.Toble
5 - Testfor
lmperfect
Substitutcbility
of
Workerswith ond
without
Higher
Educofion
(OLSEstimotion)
Skill level
Variable Low Levels of Education Higher Education (iv)
(iii) (ii)
(i)
Constant
Years ofschooling
Experience
Experiencez/100
Tenure
Tenure2/100
Marital Status
Urban
Female AveSchool
PerHE
Adjusted R'?
Observations
4.8505 *** (0.t720)
0.0379 *** (0.004) 0.0046 (0.003) -0.0091 (0.007)
0.0156 **,F
(0.003) -0.0272*** (0.00e) -0.0019 (0.016) 0.0955 *++ (0.024)
-0.2168 **'*
(0.024) 0.0577 ***
(0.018)
0.21t2 3680
5.2830 **:r (0.073)
0.0391 *** (0.004)
0.00s1 (0.003) -0.0099 (0.007)
0.0155 *** (0.003)
-0.0n4***
(0.010) -0.0031 (0.016) 0.0953 rx* (0.023)
-0.2172>N**
(0.026) 0.0740 *** (0.026) 0.0088 * (0.005) 0.2043 3680
3.6941 *** (0.318) 0.1002 *** (0.014) 0.0201 *{,+ (0.007) _0.0/t2g **
(0.018) 0.0157 *r<* (0.003) -0.0270 *x*
(0.010) -0.0336 (0.053)
0.\424 *** (0.02s) -o.l2g7 **r1
(0.0r6)
0.2115
848
4.2123 ***! (0.211) 0.1004
***
(0.014) 0.0202 t'*'k (0.007) -a-0432**(0.0r8) 0.0142 **x (0.004) -0.0215 *
(0.011) -0.0310 (0.0s5)
0.1358 *x* (0.022) -0.1293 {.x*
(0.015)
0.0170 x** (0.00s)
0.2101
66
AUSTRALIAN JOURNAL OF LABOUR ECONOMICS VOLUME 18. NUMBER I . 2ol5
5.
Sensitivily
Anolyses
In this section the results of two extensions of the above set of analyses are presented.ro
First,
resultsfrom
estimations undertakenfor
samples disaggregatedby
level
of
education are presented.This
approach provides a testof
the substitution hypothesis ofMoretti
(2004b) and Muravyev (2008). Second, the variable for each worker's yearsof
schooling, which captures the private returnto
education,is
instrumented at the same time that the aggregate-level measureis
instrumented. Acemoglu andAngrist
(2000) argue that this is an important consideration. Parents' educational attainments are used as instruments for the individual-level schooling variable.(i)
Human
Capital
Spillovers
vs.Subst?utobility
Moretti
(2OO4b,2O04a) argued that the correlation between aggregate-level human capital and earnings is not always associatedwith
human capital externalities. Rather,it
could
arise
from
imperfect
substitution betweenlow-skilled
and high-skilled
workers.rr Specifically,in
a conventional demand and supply modelwith
imperfect substitution between high-skilled and low-skilled workers, an increase in the number of high-skilled workerswill
tend to decrease the earnings ofthtihigh-skilled
workers and, at the same time, the earningsof low-skilled
workerswill
tendto
increase.In
other words, although there are no human capital externalities,low-skilled
workers receive benefit from an increase in the number of high-skilled workers under imperfect substitution between these types of workers. However, at the same time, human capital externalities may increase the earnings of both low- and high-skilled workers. Putting these two effects together, an increasein
the ratioof
workerswith
higher education should have a positive effect on the earningsof low-skilled
workers. The effectfor
high-skilled workerswill
be positiveonly
where the spillover effectis
sufficient to offset the supply effect. Hence, externalities can be said to be present when an increasein
the average-levelof
education translatesinto
an increasein
the earningsof
high-skilled workers.To examine
which
of
these explanationsis
more crediblefor
Indonesia wefollow Moretti
(2oo4b,2ao4a)
andMuravyev
(2008), and estimatethe
education spillover effect separately for low-skilled and high-skilled workers.r2 Table 5 shows the results for the OLS estimations, separately for workers who obtained higher education (columns(iii)
and (iv)) andfor all
other (1ess-skilled) workers (columns(i)
and (ii)). These equations were also estimated using anIV
approach, and with the industry-level variables as well (results are availablefrom
the authors upon request).The results reported
in
table5
show that the coefficientof
the AveSchool variablefor
workerswithout
higher educationis
0.058, whereasthe
coefficientof
this variable for workers
with
higher education is 0.074. Each of these coefficients is statistically signiflcant. These results thus show that the average yearsof
schoolingin
each province has a two percentage points larger effect on the earningsof
high-r0 As an additional test of robustness the models were estimated
separately by gender. Broadly similar results were obtained for males and females.
rr See, for example, the theoretical exposition in Heuermann (2011).
12 Low-skilled workers are defined as workers with
i
65
- LOSINA PURNASIUTI AND RUHULSALIM
Externoilties ond the Soctol Return to Educoiio;';'rn-ol]iesro
The
identifying
instrumentis
statistically significant, and has the expected signin
each estimation. The F-testof
the endogeneityof
the aggregate_levelhuman capital measure rejects the
null
hypothesisof
exogeneityin
allli'e
moaek. Attempts to instrument using both the external instruments and generated instruments,in line
with Lewbel's (2012) approach, was not associated with any quantitative improvementin
the
results. Henceonly
thefndings
basedon
the exiernal instruments, andin
particular the estimations using the HE1,000 variable as the instrument, are discussed.There are
no
material changesto
the results presentedin
table4
for
the variablesother than
the
aggregate-level human"upitul
measures.Each
of
the aggregate-level human capital measures is associated with the same positive impact on individual's wages that characterised theoLS
esrimates. However, there are importaot changesin
magnitude.Applying
theIV
approach leadsto
much higher(by
a factorof
four)
estimated external returnsto
schooling comparedto
those obtained using the
oLS
approach. Thus, according to the column(i)
results, an increaseby
one
ii
the average yearsof
schoolingin
the provinceis
associatedwith
an increasein
the individual's monthly earnings by about 13 per cent. These results are lower than the study using 1990 canadian data conducted by Rakova and vaillancourt (2o05). They found that an increase by a yearin
their average education variable had an effect on labour productivity of 23 per cent.when
the
Aveschoor variableis
repracedby perHE
theIV
findings
are consistent with those obtained usingoLS,
in that the use of this alternative measureof
aggregate-level human capital is associated with a much lower estimate of the human capital externality-In
particular, the estimated coefficient on theperIIE
variable iso'o222
in
the column(iii)
results. I{owever, even this lower estimateof
the external return to schooling exceeds the estimated private return to schooling.Summing up the patterns
of
theseIV
estimates results, there are two points that needto
be highlighted.First,
the findingsfrom
theIV
analyses are sensitiveto
the choiceof
instrument, including whether externalor
internal instruments areemployed' This is consistent with research on the
IV
estimation of the private returnto
schooling, such asLevin
and Plug (1999). Second, the estimated external returns to schooling associatedwith
both the average yearsof
schooling and the percentage of workers with higher education obtained using theIV
approacil are larger than that obtained usingoLS.
Hence,it
appears that education exiernalities are an important issue for public policy makers to consider in Indonesia.;
jI*i:.113""J*:1':.YI:tl"tJh"
i
t'
**""Y1T:::I,j"J?:.'11"-jnsjr.uTe.nts.Te
i,t..d;;;J.
ri;
t;l;ffiftffi,i'iif,l",#i,rlX'ill
ll,,"jl*'il1*1"-*j:'^:::jf
r:,J,:lq:in"i1"rih;p;;;;l^;',*;;Ji,;ti"i*I#ffi:
.rEuuvaur ur urE rcupEcLtye tnsrrument Sets rn lequation has been undertaken. The seiond criterion is re^levance.
it
"
."irr*..
or,of the instrume-ntis to answer the most essential question, whether instrumenting tne
Jooiirf
ifiir):'-l>.
lrd
t.=
Its
IO lo.ta
ta
aat9
lo le IE lo lo lr to la. lo IE loIr
tclq
lc to lo lp lolr
lot>
I '*r
c o o k o o ,q d o o (! o GI oo € o d o o o E
*
+*
E 6 @ I o E o da
o o .o 6 E rt 6, U):
u, ***
+
€
i6r !n$Itr*
I*
*f
*
*****
BgEgE3E5E$$3H3sg$g
EE
fi*$$
fiEsEgES$gHgHg$gE3Eg
fi*i***rr
******ji.n
H
gEgBg=5E
3$5Hg5gB
g
**s*r*
$
s=
3E
gHSe gB
gEgE
5Bg
fi$tr**
$**
g
t=
gs 3B3=
gB
3H
3=
gH
g=
g
It**** .i9iflt+*** *+*****x*
H
SS
EEgEgEgES=$$sx
m'*
5=,5-
5"
E" 5c E-
E-
3+
3
i_t * *
+
* * *
*
$
5E
g3gE
5E
gg
gH
gE
sE 3E
3
la
**xt
**x*
sfEtEgsSEgESFSEnNS
"dEd5-Eq3+3+=E3-3+E
gB
€
6A0:*f
I
€
=;EE=64
8o.9.9-9t=-E
EfBBEEEgEg
*
*
tGm-- €
9E
S
o=
t
ee;
*
*s
**
$g
$n
**
*
gas
GE
!!
r; ol
os,
**
O\€+N
6l h
\q*
.+
*
H- 6
€ !a\ 6!
oo
-*
+ <)6
cA 6l cl 16
6$
vi
*
\o-. @
fiE
il
@9 +
r\:
>r o tr o bOa odr.E
a
.r, i6 rrl o 9>ETEUE.o
64
AUSTRALIAN JOURNAL OF LABOUR ECONOMICS
VOLUME,IS. NUMBER I . 2015
-I
$ OO qs
9b
ES
€
E
sr
o$u3
a.bEs
BES
ESS
bs8
€'c--ES
S.=s i<
SE
E*
b3
a_b-Se
EES
'b.s
S
ss=
SS
S.63
LOSINA PURNASTUTI AND RUHUL SALIM
Exlernolilies ond the Sociol Return to Educotion ln lndonesio
Percentage of workers with higher educatiou (columns
(iii)
and (iv)) exceed the private returns by a factor of at least 1.2. This is lower than that recorded on the basisof
the specifications listed in columns (i) and(ii).
Summing up, these
oLS
estimates revealfour
pointsof
interest. First, the estimatesof
the private
returnsto
schoolingare
stable acrossall
specifications. Second,all
estimates of the external returns to schooling are positive and statistically significant, bothfor
the overalllevel
andfor
theindustrial
sector level variables. Third, the externalities associated with education in Indonesia appear to be associated mainlywith
expansion of schooling at the pre-tertiary level. Fourth, the social return to schooling could be more than double the conventionally estimated private return.If
this is the case the policy implications in relation to the potential for further expansion of the education sector would be altered considerably. Before pursuing these policy implications, however, theIV
estimateswill
be discussed.(ii)
lV
Approoch
In
this
sub-section anIV
approachis
adopted to address the issueof
potential bias thatmay
arise becauseof
unobserved factors being correlatedwith
the provincial level human capital. Tables 4 reports the results. The column (i) and(ii)
of
this table are based on the useof
the AveSchool variables as the measureof
aggregate-level human capital. Of these columns of results, the first is for where the Number of higher education institution per 1000 people is employed as an instrumerfi(HEl)\o),
and the second covers the resultsfrom
theIV
estimations using the percentageof
household use clean water as an instrument (CW). The results contained in the final two columns are based on the PerHE variable as the aggregate-level human capital measure,with
the HE1O00 and CW as instruments.62
AUSTRATIAN JOURNAL OF LABOUR ECONOMICS VOLUME l8 . NUMBER I . 2ol5
overall human capital depth, though both sources of externality are important. This is
in
agreement with Fu's QOOT) finding using Boston metropolitan data.The social returnT to schooling consists ofboth the private and external returns to schooling. Thus, social return to schooling in this article is measured as (Years
of
schooling + Average Schooling)/Private Return to school. Then, based on the results in column (i) of table 3, it can be seen that the social return exceeds the private return by a factor of (0.0492 + 0.0580y0.0492,orby about2.2. This figure is higher than the finding of Rauch (1993), based on US data. Rauch (1993) found that the social return exceeded the private return by a factorof
1.7.To check the robustness of the OLS estimates considered above, the models
of
columns (i) and(ii)
were re-estimated using the alternative measure for the provincial level education, namely the percentage of workerswith
higher education. The results are reportedin
columns(iii)
and(iv) of
table3.It
is apparent that the resultsfor
the variables other than the aggregate-level variables are unaffected by this change to the specification.Including an aggregate-level human capital measure based on the percentage
of
workerswith
higher education leads to lower estimated coefficients compared to those obtained usingthe
average yearsof
schooling. Usingthis
new variable, the estimated coefficientis
around 0.01in
each specification,implying
that an increasein
the percentageof
workerswith
higher educationby
one percentage point can be expectedto
increase an individual's monthly earnings by about one per cent. These results are very similar to the OLS estimatesof
1.02 per centto
1.42 per cent reported byMorreti
QOO4a) based on US data, the 1.10 per centto
1.45 per cent reported byLiu
(2007) based on Chinese data, and thc recent estimates of 0.6 per centto
1.8 per cent for Germany by Heuermann (2011). Comparisonwith
the estimates presented in the first two columns of table 3 suggest the externalities associatedwith
educationin
Indonesia seem to derive morefrom
expansion of the pre-tertiary levelsof
schooling rather than from the higher education sector.8The
estimates basedon the
variables constructed usingthe
percentageof
workers
with
higher education based on the industrial sectorwithin
each province are consistentwith
the
above conclusion. These results showthat an
increasein
the
percentageof
workerswith
higher educationin
eachindustrial
sectorby
one percentage point is associated with an increase in an individual's monthly earnings by approximately 0.2 per cent. Similar to the resultsin
columns(i)
and(ii),
the external returnsto
schooling associatedwith
the aggregate-level human capitalin
the sameindustrial
sectorwithin
the province are lower than thosefrom
the overall-levelof
human capitalwithin
the province. The social returns to education associated with the7 Private and social returns to education may differ in the presence ofexternalities.
E Note that the PerHE and PerHE-Ind variables are measured as a per cent whereas AveSchool,
AveSchool-Ind and years of schooling are in years. Comparisons of estimated impacts might be more useful
if
undertaken using an elasticity measure. In the semi-logarithmic specification of the earnings equation, the elasticity is found by multiplying the regression coefficient by the mean of the variable of interest. However, as the means are comparable (for example, the mean ofAveSchool is 874 and the mean of PerHE is 7 !73), the regression coefficients provide a good basis
for comparisons from this perspective. For this reason also, the discussion of the social return using the PerHE vaiables is based simply on the summation of the estimated coefficients.
F
I
q
G
3
d
r
t
I
d o 7I
I
t
I
a
t
6t
LOSINA PURNASTUTI AND RUHUL SALIM
Exiernolitles ond the Sociol Return to Educolion in lndoneslo
year led to an increase
in individual
earnings by 49O to 6.67 per cent. The external effect associated with an expansion of the education sector in Indonesia is almost one percentage point higher than the internalised effect associatedwith
the individual's years of schooling variable.Toble
3 - OLS Estimotesof
Augmented
Mincerion
EorningsEquotion
Externality measure
Average years of schooling
Percentage of workers with higher education
(iii) (ii)
(i) (iv)
Variable Constant
Years of schooling
Experience
Experience2/100
Tenure
Tenure2/100
Marital status
Urban
Female
AveSchool AveSchool-Ind
PerHE
PerHE-Ind Adj-R, Observations
47ll8
r.**
4.4942*rr*(0.137)
(0.148)0.0492
'<**
0.0439 ***-0.0283
***
-0.0284 *** (0.003)0.0076 ** (0.003) -0.0129* (0.007)
0.0162 r.** (0.003)
(0.003) 0,0074 ** (0.003) -0.0128 *
(0.007)
0.0161 ***
(0.003)
5.1434:.i** (0.068)
0.0491 **r. (0.003) 0.0078 ** (0.003) -0.0135 * (0.007)
0.0150 *r,,k
(0.003) -0.0281 *x*
(0.00e -0.0076 (0.0re) 0.0942 ,r.{,* (0.021)
_0.1917 *r* (0.019)
5.1545 *** (0.068) 0.0460
***
(0.003) 4.0077**
(0.003) -0.0134 * (0.007)0.0158
***
(0.003) -0.0281 ***(0.009) -0.0053 (0.020) 0.0904 *r<+
(0.021) -0.1961 *,*r: (0,020)
0.0096 x* (0.004) 0.0024 *** (0.001) a.2829 4528 0.0950
***
0.0760 ***(0.022) (0.023)
_0.1909
***
_0.2008 *** (0.018) (0.01e) 0.0580***
0.0524 *** (0.014) (0.012)0.0361 *** (0.009) (0.008)
-0.0073 (0.01e)
0.2847 4528
(0.008) .0.0018 (0.020)
0.2965 4528
0.0098 +* (0.005)
0.2791 4528
Noies.' Heteroscedasticity-consistent standard errors in parentheses; *, ** atrd **+ denote statistical significance at the 10 per cent, five per cent and one per cent levels, respectively.
The model of column
(ii)
is distinguished by the addition of the depth of the same industrial sector human capital stock. The inclusion of this variable is associatedwith
a small reductionin
the coefficient on the overall human capital stock variable,60
AUSTRALIAN JOURNAL OF LABOUR ECONOMICS VOTUME 18 . NUMBER I '20]5
4.
Stotisticol
AnolYses
The
discussionin
this
section corunenceswith the
analysis basedon the
OLS approach. Following this theIV
analyses are considered'(i)
OLSAnalYses
Table 3 shows the results from the estimation of the augmented Mincerian model' The findings
in
the two left-hand columns are for when the avelage years of schooling and the avlrage yearsof
schooling based on the industrial sectorwithin
each province are utilised as the aggregate-level human capital measules. The findingsin
thefinal
two columns are based on the percentage of workers with higher education as the aggregate-level human capital*"urrr"..
In
each instance the first mOdel presented contains only the aggregate-level variable that is based solely on the province of residence' while the,""ona *LO"t
contains this variable together with the corresponding variable based on the worker's industryof
employmentwithin
the province. This sequential approach to estimationwill
inform
on whether there are collinearities between the two measuresof
external effects.It
also provides a tractable approachfor
theIV
estimations that follow. Two setsof
standard errors ale listed for each variable. The first standard error is the conventional robust one. The second reflects the clustering of the measures of the external effects at the provincial level. The presentation ofboth types of standard errors follows Hyytinen, Ilrnakunnas and Toivanen (2013). It is noted that variables which are statisticaliy significant have this status in this instance regardless of the standard error used.In
subsequent presentatiOns, only clustered standard errors ale listed'The results reported
in
table 3 can be considered satisfactory, as closeto
3O per centofthe
varianc. in earnings is explained. The findings associated with the non-education variables conforrn to conventional wisdom, andwill
not be discussed here (see, Purnastuti,Miller
and Salim (2013a) for relevant analysis). Rather the discussionwill
focus on the individual and aggregate-level education variables'The estimares
of
the private returns to education are compefeblefof
the two setsof
results. Each additional yearof
schoolingis
expectedto
increase individual earnings by between four and five per cent.sThe estimates of the human capital externalities are all positive and statistically significant at the flve per cent level
of
significance or better.In
the model of column (i), where only the provincial average years of schooling is included in the estimating equation, the estimated effect indicates that an increase by onein
the average yearsof
schoolingin
the
provinceis
expectedto
be
associatedvrith
an increasein
theindividual
worker's wageof
5.8 per cent.6 This findingis
in linewith
those reportedby
Liu
(2oo7)in
China, where an increasein
the average yearsof
schooling by one ooling using levels of educatio.n show thar the payoff to,.h;;iiili;;r""r"r
urhigt"rlevels of education are considered.As
notel*:1"r._".Llllit
fi:"
I
C
I
I
I
which is the same
"t
."piit"a
by Deolalikar (1993), contrasts with the Pattern typically found in developing countries (Piacharopoulo-s, 1981' 1985 and 1994)'i
Sl-iiu.
Estimates"f
tfr"-"ii"r'nul effects are obtained when variables for the level of education for the individual or"ut"i'i"
tt e estimations. This contrasts with Rudd's (2000) finding' Rudd iibOOl i"p".t"a tnat ttr"re *us rro "viaence of human capital spillovers w1ren a years' of s.chooling i,uiiut',f"*".
used in the estimation, while such spilloveis weri evident when dummy variables for71
LOSINA PURNASTUTI AND RUHUL SALIM
Exlernollties ond the Soclol Reiutn to Educoilon ln lncroneslo
Toble
42
- lVwith
Externol lnstruments plus Lewbel's
Generoted
lnstruments
(PerHE osAggregote
Humon
Copiiol)
Standard IY IV with Generated Instruments
N with Generated Inslruments and
Exlernal lnstrumenls
Yariable
Number
of higher education institution per 1,000 people Per cent household
use clean
\tater
Number
oJ higher education
inslitution
per 1,000
'people
Per cenl household
use cban
water Nutnber
of higher
Percent
educationhousehold institution
use
clean
per 1,000\ratq
' peopleConstant Years of schooling
Expricnce
Expuic,ncd/100
Tenure
Tenurd/100
Marital strtus Urban
Female
PerHE
F test (weak
identification tes0
0bservations
5.26?0 ***
(0.m13) 0.040q ***
(0.0016)
0.0064 ***
(0.0021) -0.0112 *:F*
(0.004s)
0.0170 *8!r
(0.0020)
-0{Rg2 *t'*
(0.0066) -0.0002
(0.0181) 0.1082 **rF (0.0129)
-0.1902 ** (0.0120)
0.0066 *** (0.0022)
5,147:il\
4,528
5.2628 *** (0.0312)
0.0409 ***
(0.0016) 0.0064 xx* (0.002r)
-00112 ** (0.0{)4s)
001?0{'**
(0.0020) -0.03(D *** (0.0066)
-0.0004
(0.0r80)
0.1073 *** (0.012e)
-0j902 *t'|* (0CII20)
0.0073 ***
(0.0022)
5,577.561
4528
57U19tF**
(0.0363)
0.0407 ***
(0.0016) 01.0061
*tt
0.0m1)
-0.0105 **
(0.0046)
0.01?0 t**
(0.0020)
-0n299 ***
(0.0066) *** -0.0023
(0.0181) 0.0943 *** (0.0136)
-0.1899 **/f
(0.0120)
0.0164 ***
(0.0037)
t16193 4,528
52A19*!r*
(0.0363)
0.0407 ***
(0.0016) 01.0061 *** (0.0021)
-0.0105 ** (0.004.6)
0.0170 ***
(0.0020)
-0.0299,r**
(0.0066) -0.0023
(0.0181) 0{1941 *** (0,0136)
_0.1899 ***
(0.0r20)
0.0164 x** (0CI037)
176:193
4528
5.2587 *** (0.0310)
0.0409 *** (0.0016)
0.0064 ***
(0.0021)
-00111 **
(0.004,
0.0170 ***
(0.0020)
-0.0301 ***
(0.0066) -0.0005
(0.0180) 0.1063 (0.012e)
-0.1902 *** (o.or20)
c.0080,***
(0.0021 1,427.088
4528
5.2579 *** (0.0310)
0.0409 **r
(0.0016)
0.m64 **r'.
(0.0021) -0.0111 **
(0.0045)
0.0170 ***
(0n020)
-0.0301 *** (0.0066)
-0,0006
(0.0180)
0.1061 *'F* (0.0r29)
-0.190[ **+
(0.0120) 0.0081 *** (0.0021)
31s4.474
4528
Notes: Clustered (at level of province) standard errors in parentkses. *, ** and **t denote statistical
72
03?lil$.,.-'#-'f,y,l}f,l
il
10f,"'- Eco No MrcsTobre A3
-
Firststooe
Regressionof
The Estimoresof
Externor Returnto schooring
when-rndiv'i-ouJ
onJ
ar"-rog*
schooring ore treoted
osEndogenous Voriobles
(iil
Externality Measure
Years of schooling
Per cent workerswith
higher education
Type of Instrument Parental education and
number of HE institution per 1,000 people
Parental education and
nunber of HE institution per 1,000 people Variable Partial Aggregatel
Provincial Partial AggregatelProvincial Constaat
Experience Experience2/I00
Tenure Tenure2/100
Marital status
Urban Female
Father's education Mother's education H81000
Observations
F tcst (weak identifcarion TEST) F-test of exogeneity
'l.4yl4***
(0.21487)
_0.1063 *** (0.0160)
-0.0011 *** (0.0347)
0.1187 *** (0.01s4)
-0.0847 * (0.0s04)
0.6'ln */d
(0.i38r)
1.3175 ***
(0.0968) -0.0856
(0.0918)
0.2894 ***
(4.0fl2) 0.17a*** (0.0198) 0.33y2 (4.2e4s) 4528 83i97
26.5235 ***
9.1745 ***