• Tidak ada hasil yang ditemukan

Model Pertumbuhan dan Hasil Tegakan Suren (Toona sureni Merr.) di Hutan Rakyat Sipolha Horisan Kecamatan Pematang Sidamanik Kabupaten Simalungun Sumatera Utara

N/A
N/A
Protected

Academic year: 2017

Membagikan "Model Pertumbuhan dan Hasil Tegakan Suren (Toona sureni Merr.) di Hutan Rakyat Sipolha Horisan Kecamatan Pematang Sidamanik Kabupaten Simalungun Sumatera Utara"

Copied!
27
0
0

Teks penuh

(1)

LAMPIRAN

(2)
(3)
(4)
(5)
(6)
(7)
(8)
(9)
(10)
(11)
(12)
(13)

Lampiran 2. Data Crosssection untuk diameter, tinggi dan volume tegakan

suren

Umur (Tahun)

Rata-rata diameter

(cm)

rata-rata tinggi (m)

rata2 volume

3

7,570689655

4,824137931

0,013023014

4

13,94157303

8,885393258

0,081343175

5

16,93877551

12,57959184

0,170001002

6

19,67678571

17,69107143

0,322614108

7

21,872

21,816

0,491556028

8

24,16615385

24,13384615

0,663838627

9

25,34927536

26,52173913

0,80270137

10

25,63684211

28,56315789

0,884211553

Lampiran 2. Nilai Riap Pendugaan

umur

Rata-rata diameter (cm)

rata-rata tinggi (m)

rata2 volume

3

7.956

4.710

0.019

4

13.100

8.883

0.066

5

17.074

13.175

0.176

6

20.063

17.356

0.326

7

22.254

21.192

0.495

8

23.831

24.454

0.659

9

24.980

26.910

0.798

10

25.887

28.329

0.887

(14)

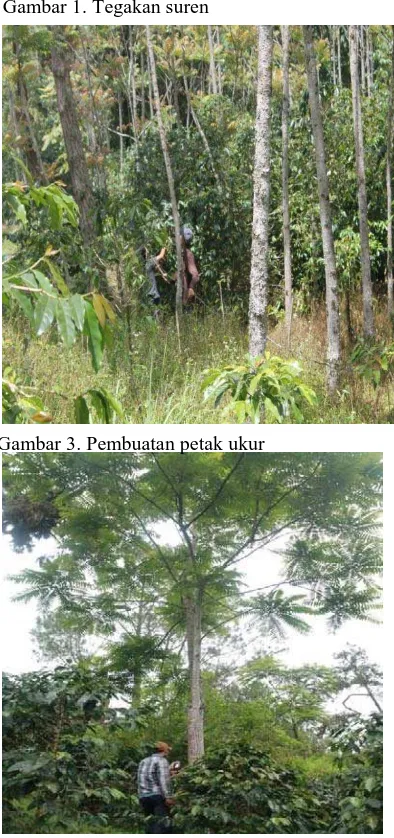
Gambar 1. Tegakan suren Gambar 2. Suren umur 20 tahun

Gambar 3. Pembuatan petak ukur Gambar 4. Agroforestri suren dengan kopi

(15)

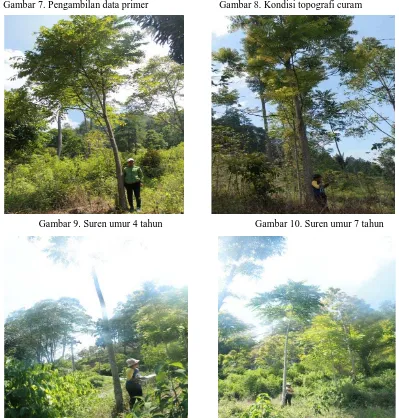
Gambar 7. Pengambilan data primer Gambar 8. Kondisi topografi curam

Gambar 9. Suren umur 4 tahun Gambar 10. Suren umur 7 tahun

Gambar 11. Suren umur 6 tahun gambar 12. Suren umur 9 tahun

DIAMETER SUREN

Exponential

Model Summary

R

R Square

Adjusted R

Square

Std. Error of

the Estimate

(16)

Model Summary

R

R Square

Adjusted R

Square

Std. Error of

the Estimate

.897

.805

.772

.197

The independent variable is UMUR.

ANOVA

The independent variable is UMUR.

Coefficients

Unstandardized Coefficients

Standardized

The dependent variable is ln(DIAMETER).

Power

Model Summary

R

R Square

Adjusted R

Square

Std. Error of

the Estimate

.956

.914

.900

.131

The independent variable is UMUR.

(17)

ANOVA

Sum of

Squares

df

Mean Square

F

Sig.

Regression

1.091

1

1.091

63.900

.000

Residual

.102

6

.017

The independent variable is UMUR.

Coefficients

Unstandardized Coefficients

Standardized

The dependent variable is ln(DIAMETER).

Cubic

Model Summary

R

R Square

Adjusted R

Square

Std. Error of

the Estimate

.997

.995

.991

.609

The independent variable is UMUR.

ANOVA

The independent variable is UMUR.

Coefficients

Unstandardized Coefficients

Standardized

Coefficients

t

Sig.

B

Std. Error

Beta

(18)

UMUR ** 2

-.956

.489

-4.880

-1.955

.122

UMUR ** 3

.031

.025

1.698

1.239

.283

(Constant)

-16.351

5.668

-2.885

.045

Logarithmic

Model Summary

R

R Square

Adjusted R

Square

Std. Error of

the Estimate

.992

.983

.980

.884

The independent variable is UMUR.

ANOVA

The independent variable is UMUR.

Coefficients

Unstandardized Coefficients

Standardized

Model Summary

R

R Square

Adjusted R

Square

Std. Error of

the Estimate

.958

.918

.904

1.958

The independent variable is UMUR.

(19)

Sum of

Squares

df

Mean Square

F

Sig.

Regression

255.988

1

255.988

66.803

.000

Residual

22.992

6

3.832

Total

278.980

7

The independent variable is UMUR.

Coefficients

Unstandardized Coefficients

Standardized

Coefficients

t

Sig.

B

Std. Error

Beta

UMUR

2.469

.302

.958

8.173

.000

(Constant)

3.347

2.082

1.608

.159

(20)

Exponential

Model Summary

R

R Square

Adjusted R

Square

Std. Error of

the Estimate

.942

.887

.868

.226

The independent variable is UMUR.

ANOVA

The independent variable is UMUR.

Coefficients

Unstandardized Coefficients

Standardized

The dependent variable is ln(TINGGI).

Power

Model Summary

R

R Square

Adjusted R

Square

Std. Error of

the Estimate

.985

.970

.965

.116

The independent variable is UMUR.

(21)

Sum of

Squares

df

Mean Square

F

Sig.

Regression

2.625

1

2.625

194.131

.000

Residual

.081

6

.014

Total

2.706

7

The independent variable is UMUR.

Coefficients

Unstandardized Coefficients

Standardized

The dependent variable is ln(TINGGI).

Cubic

Model Summary

R

R Square

Adjusted R

Square

Std. Error of

the Estimate

.999

.998

.996

.543

The independent variable is UMUR.

ANOVA

The independent variable is UMUR.

Coefficients

Unstandardized Coefficients

Standardized

Coefficients

(22)

UMUR

1.945

2.674

.551

.727

.507

UMUR ** 2

.522

.436

1.947

1.197

.297

UMUR ** 3

-.039

.022

-1.547

-1.731

.159

(Constant)

-4.781

5.054

-.946

.398

Logarithmic

Model Summary

R

R Square

Adjusted R

Square

Std. Error of

the Estimate

.995

.990

.989

.922

The independent variable is UMUR.

ANOVA

The independent variable is UMUR.

Coefficients

Unstandardized Coefficients

Standardized

Model Summary

R

R Square

Adjusted R

Square

Std. Error of

the Estimate

.990

.979

.976

1.348

(23)

ANOVA

Sum of

Squares

df

Mean Square

F

Sig.

Regression

511.503

1

511.503

281.308

.000

Residual

10.910

6

1.818

Total

522.413

7

The independent variable is UMUR.

Coefficients

Unstandardized Coefficients

Standardized

Coefficients

t

Sig.

B

Std. Error

Beta

UMUR

3.490

.208

.990

16.772

.000

(24)

VOLUME SUREN

Exponential

Model Summary

R

R Square

Adjusted R

Square

Std. Error of

the Estimate

.919

.845

.819

.613

The independent variable is UMUR.

ANOVA

The independent variable is UMUR.

Coefficients

Unstandardized Coefficients

Standardized

The dependent variable is ln(VOLUME).

Power

Model Summary

R

R Square

Adjusted R

Square

Std. Error of

the Estimate

.972

.944

.935

.369

(25)

ANOVA

Sum of

Squares

df

Mean Square

F

Sig.

Regression

13.755

1

13.755

101.189

.000

Residual

.816

6

.136

Total

14.570

7

The independent variable is UMUR.

Coefficients

Unstandardized Coefficients

Standardized

Coefficients

t

Sig.

B

Std. Error

Beta

ln(UMUR)

3.373

.335

.972

10.059

.000

(Constant)

.001

.000

1.618

.157

The dependent variable is ln(VOLUME).

Cubic

Model Summary

R

R Square

Adjusted R

Square

Std. Error of

the Estimate

1.000

1.000

.999

.010

The independent variable is UMUR.

ANOVA

Sum of

Squares

df

Mean Square

F

Sig.

Regression

.778

3

.259

2.716E3

.000

Residual

.000

4

.000

Total

.778

7

(26)

Coefficients

Unstandardized Coefficients

Standardized

Model Summary

R

R Square

Adjusted R

Square

Std. Error of

the Estimate

.967

.935

.924

.092

The independent variable is UMUR.

ANOVA

The independent variable is UMUR.

Coefficients

Unstandardized Coefficients

(27)

Linear

Model Summary

R

R Square

Adjusted R

Square

Std. Error of

the Estimate

.993

.986

.984

.042

The independent variable is UMUR.

ANOVA

Sum of

Squares

df

Mean Square

F

Sig.

Regression

.768

1

.768

431.227

.000

Residual

.011

6

.002

Total

.778

7

The independent variable is UMUR.

Coefficients

Unstandardized Coefficients

Standardized

Coefficients

t

Sig.

B

Std. Error

Beta

UMUR

.135

.007

.993

20.766

.000

Gambar

Gambar 3. Pembuatan petak ukur
Gambar 8. Kondisi topografi curam

Referensi

Dokumen terkait

Pemeriksaan trigliserida pada ibu hamil sebagai skrining preeklampsia di Puskesmas Cukir Jombang didapatkan hasil sebagian besar dari responden kadar

ncsie pada unumnya dan kes-enlan claerah pada khususoya... cli perr-.. guruan tin:fl, usaha nenlnX'katan kualltas ticlak mungt<in t

tertentu yang berasal dari prajurit Tentara Nasional Indonesia dan anggota Kepolisian Negara Republik Indonesia dan tata cara pengisian jabatan ASN sebagaimana

RPL SORE 41122144 Sugeng Subakti Penentuan Karyawan terbaik melalui penerapan sistem pendukung keputusan dengan metode SAW.. Nana Suarna, M.Kom Andi Setiawan,

[r]

bahwa berdasarkan pertimbangan sebagaimana dimaksud dalam huruf a, perlu menetapkan Keputusan Bupati Bantul tentang Pembentukan Tim Pembina Kepariwisataan Kabupaten

[r]

[r]