Climate change and variability in the palembang city: Long-term trends and
variability of palembang rainfall
Iskhaq Iskandar, Azhar K. Affandi, Dedi Setibudidaya, and Fadli Syamsuddin
Citation: AIP Conf. Proc. 1554, 226 (2013); doi: 10.1063/1.4820326
View online: http://dx.doi.org/10.1063/1.4820326
View Table of Contents: http://proceedings.aip.org/dbt/dbt.jsp?KEY=APCPCS&Volume=1554&Issue=1
Published by the AIP Publishing LLC.
Additional information on AIP Conf. Proc.
Journal Homepage: http://proceedings.aip.org/
Journal Information: http://proceedings.aip.org/about/about_the_proceedings
Top downloads: http://proceedings.aip.org/dbt/most_downloaded.jsp?KEY=APCPCS
Climate Change and Variability in the Palembang City:
Long-term Trends and Variability of Palembang Rainfall
Iskhaq Iskandar
1,3,*, Azhar K. Affandi
1, Dedi Setibudidaya
1and Fadli Syamsuddin
21
Jurusan Fisika, FMIPA Universitas Sriwijaya, Jl. Raya Palembang-Prabumulih, Km. 32, Inderalaya, Ogan Ilir (OI), Sumatra Selatan, Indonesia – 30662
2
Badan Pengkajian dan Penerapan Teknologi (BPPT), Jl. M.H. Thamrin 8, Jakarta, Indonesia – 10340
3
Pusat Studi Geo-hazard dan Perubahan Iklim, Universitas Sriwijaya
Abstract. Long-term trends of Palembang rainfall are used to evaluate the climate change signal. The result shows that the long-term trend in Palembang rainfall is seasonally dependent. It indicates two distinct characteristics: a wetting trend during the southeast monsoon season (June–August) and a drying trend during the northwest monsoon season (December–February). This implies that there are a wetting-trend during dry-season and a drying-trend during rainy-season. Furthermore, a drying-trend is also observed during the monsoon break season in March–May and September– November. A positive-trend in rainfall during June–August is 4.57 mm/year, while the strongest negative-trend in rainfall observed during December – February is -16.02 mm/year. The variability of Palembang rainfall is linked to a coupled ocean-atmosphere mode in the tropical Indian and Pacific oceans. The connection between the seasonal rainfall variations and Indo-Pacific climate variability is demonstrated by the simultaneous correlations between the sea surface temperature (SST) and the Palembang rainfall. The SST anomaly in the tropical regions affects the climate and general circulation through change in the Walker circulation (e.g. Indian Ocean Dipole and ENSO events).
Keywords: climate change, El Niño, Indian Ocean Dipole, La Niña, Palembang rainfall.
PACS: 92.70.Aa
INTRODUCTION
A possible linkage between the increase in global temperature and the recent extreme climate events has received much attention of the society for its possible impact on human life. Earlier studies have shown that the global warming is making an intensification of rainfall and flooding in some part of the world as well as causing droughts more severe in other part of the world. Accurate temporal knowledge of global precipitation is essential for understanding the multi-scale interactions among weather, climate and ecological systems. In addition a better knowledge on multi-scale climate variations is useful for predicting the impact of extreme weather events such as floods, droughts and landslides [1].
Indonesia, located in between the Pacific Ocean and Indian Ocean, is strongly influenced by coupled ocean-atmosphere modes in both ocean, namely the El Niño–Southern Oscillation (ENSO) and the Indian Ocean Dipole (IOD) dynamics. In particular, warm events (El Niño) in the Pacific Ocean and positive Indian Ocean dipole episodes cause drought conditions
in Indonesia [2-4]. This condition has significant consequences for agricultural output, rural incomes, and staple food prices. In contrast, the cold phase of ENSO cycle (La Niña) and negative IOD events bring a lot of rain to the Indonesian region and the surrounding countries [5].
Previous studies have demonstrated that the local sea surface temperature (SST) anomalies over Indonesia play important role affecting the Indonesian rainfall variability [6,5]. Their studies suggested that the local SST variation accounts for 10–16% of the rainfall variability.
The goal of this study is to evaluate the temporal variation of the rainfall in the Palembang city and to examine its relation to the warming trend of the Indo-Pacific region.
DATA AND METHOD
Data
Monthly rainfall data recorded at two rain gauge stations located in the Sultan Mahmud Badaruddin II
airport and the Kenten district, Palembang were used in this study. The data were made available by the Meteorological, Geophysical and Climatological Agency, Indonesia. The data span for period of January 1965 to December 2000. An index of Palembang rainfall was created by a simple averaging of all data from those two stations (hereafter
Palembang rainfall).
In order to evaluate the relation between the Palembang rainfall variations and the occurrence of the ENSO and the IOD events, we used monthly SST data from Extended Reconstructed Sea Surface Temperature (ERSST) from NOAA's Historical Merged Land-Ocean Surface Temperature Analysis [7]. The data are available from January 1854 to present with horizontal resolution of 2qu 2q. Here, we only used the data from January 1965 to December 2000 when the rainfall data available.
Method
In order to evaluate a sole influence of the IOD or ENSO on the Palembang rainfall, a cross correlation analysis will be used here [8]. The correlation is calculated between the rainfall time series and SST anomalies in the Indo-Pacific region. It is defined by Eq (1).
r12 1 N1
(x1ix 1).(x2i x 2) s1.s2
i 1
N
¦
, (1)where s1 and s2 are the standard deviation of variable 1 (x1) and variable 2 (x2), respectively, and it is defined as Eq (2).
s2 1
N (
xi x )2.
i 1
N
¦
(2)RESULTS
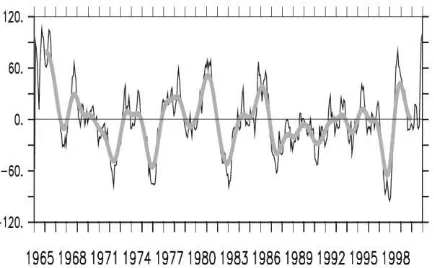
Fig 1 shows rainfall anomaly for a period of January 1965 to December 2000. The anomaly was calculated as deviation from mean rainfall averaged over the two stations in the Sultan Mahmud Badaruddin II airport and the Kenten district, Palembang. We found that most of the positive anomaly is observed over the period of May – October, while the negative anomaly occurs mostly from December to March. The data also shows a small variation over a period of 1984 – 1995.
FIGURE 1. Anomaly of the Palembang rainfall (mm) over the period of January 1965 to December 2000 (thin-black
curve). 13-month running averaged of the rainfall anomaly is indicated by a thick-gray curve. Note that the 13-month running averaged was applied to eliminate the variability less than 1 year.
Monthly climatology of the Palembang rainfall is shown in Fig 2. The climatology was calculated over the period of January 1965 to December 2000. It is shown that much rainfall is observed in the period from April to November. In particular, the data indicates two peaks of rainfall in the period of May to June and September to October. These two peaks are occurring during the monsoon breaks [9].
FIGURE 2. Monthly climatology of the Palembang rainfall (mm) created over period of January 1965 – December 2000.
FIGURE 3. Time series of the 13-months running-averaged Palembang rainfall from January 1965 – December 2000. The straight line is obtained by a linear regression over a period of 1965 – 2000.
It was shown that the monthly climatology of the Palembang rainfall indicates a seasonal variation (Fig 2). Thus, we analyze long-term trend and variations in four seasons, namely the December–February (DJF) season, March–May (MAM) season, June–August (JJA) season and September–November (SON) season. The division of the season is following the Asia-Australia monsoon season where the DJF, MAM, JJA and SON seasons are associated with the northwest monsoon, spring transition of the monsoon, southeast monsoon and the fall transition of the monsoon, respectively.
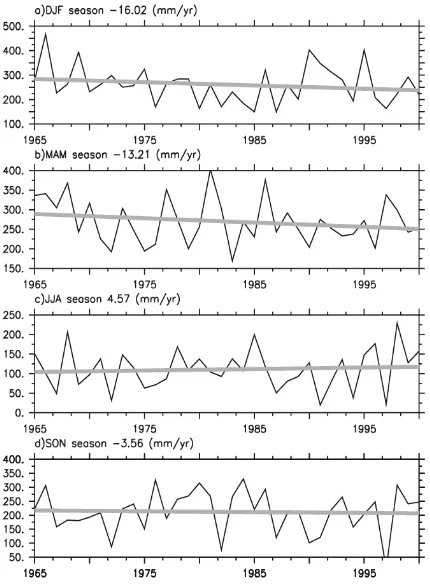
FIGURE 4. Same as in Fig 3 except for seasonal long-term trend during (a) December – February, (b) March – May, (c) June – August and (d) September – November. The straight
line is obtained by a linear regression over a period of 1965 – 2000.
Fig 4 show that the precipitation has a decreasing trend (negative trend) during all seasons, except during JJA season, which shows an increasing trend (positive trend) up to 4.57 mm/year. Remarkable decreasing trend at a rate of -16.02 mm/year (the largest trend) was observed during DJF season (Fig 4a), while the smallest decreasing trend of -3.56 mm/year occurred during SON season (Fig 4d). These results suggest that the Palembang rainfall tends to be dry during wet-season (SON and DJF) and wet during dry-wet-season (JJA).
In order to evaluate the influence of IOD and ENSO on Palembang rainfall variability, a correlation analysis between Palembang rainfall and the SST in the Indo-Pacific region was applied in the analysis. The correlation for each season was calculated to evaluate the seasonal influences of the IOD and ENSO events on the Palembang rainfall variations.
During the DJF season, the Palembang rainfall shows positive correlation with SST in the central Pacific Ocean (e.g. the Niño3.4 region) (Fig 5a). On the other hand, during JJA season positive correlation is observed between the Palembang rainfall and the SST in the central Indian Ocean (Fig 5c). Large negative correlation is observed between the Palembang rainfall and the SST in the Indonesian seas and the surrounding ocean during the SON season (Fig 5d). The correlation does not show significant value during the MAM season (Fig 5b).
The results may suggest that the seasonal variation of Palembang rainfall is connected to a coupled ocean-atmosphere phenomenon in the Indo-Pacific sector, namely the IOD and ENSO. The IOD, which develops in boreal summer (JJA) and peaks during boreal fall (SON), influences the seasonal variation of Palembang rainfall during JJA and SON seasons. Meanwhile, the ENSO event modulates the seasonal variation of Palembang rainfall during DJF season as the ENSO matured during this season. Further analysis, however, is required to clarify the mechanism underlying the correlation between SST in the Indo-Pacific region and the rainfall over Palembang.
SUMMARY
Long-term climate variation in the Palembang City has been evaluated using a long-term rainfall record. The results show that there is a long-term climate variation over Palembang City indicated by a decreasing trend in rainfall (drying trend), with a strong seasonal variation. Remarkable decreasing trend at a rate of -16.02 mm/year (the largest trend) was observed during the DJF season. On the other hand, during the JJA season, the Palembang rainfall indicates an increasing trend at a rate of 4.57 mm/year. These results suggest that the Palembang experienced a drying trend during the wet season (DJF). During dry season (JJA), on the other hand, it experienced a wetting trend.
The seasonal variation of Palembang rainfall is connected to a coupled ocean-atmosphere mode in the Indo-Pacific sector, namely the IOD and ENSO events. Both IOD and ENSO events affect the Palembang rainfall. However, the mechanism underlying the influences of IOD and ENSO rainfall trend over Palembang is required further analysis and will be the topic of the future study.
ACKNOWLEDGMENTS
This study was supported by the Directorate General for Higher Education through an International Collaboration and Publication Research Grant 2013. The authors thank to the member of Tropical Climate Variability Research Program, JAMSTEC, Japan for helpful discussion. This is CGCCS contribution number 1301.
REFERENCES
1. P. J. Webster, Nature, 493, 17-19 (2013).
2. N. H. Saji, B. N. Goswami, P. N. Vinayachandran, and T. Yamagata, Nature, 401, 360363 (1999).
3. P. J. Webster, A. M. Moore, J. P. Loschnigg, and R. R. Leben, Nature, 401, 356359 (1999).
4. R. G. Murtugudde, J. P. McCreary, and A. J. Busalacchi,
Journal of Geophysical Research, 105, 3295-3306 (2000).
5. Aldrian, E., and R. D. Susanto (2003), International Journal of Climatology, 23, 14351452 (2003). 6. H. H. Hendon, Journal of Climate, 16, 17751790
(2003).
7. T. M. Smith, R. W. Reynolds, T. C. Peterson, and J. Lawrimore, Journal of Climate, 21, 2283-2296 (2008). 8. W. J. Emery and R. E. Thomson, Data Analysis Methods
in Physical Oceanography, Elsevier, Amsterdam (2004). 9. K. Wyrtki, Physical oceanographic of the Southeast