Conquering
EQ
By Eddie Ba z il, Sa m ple cr a z e .com
Con t e n t s
i. How t o use t his book
1. I nt roduct ion t o Equalisat ion
2. Sound
3. Com ponent s of Sound
4. Midi and Frequency Chart
5. Fundam ent als and Harm onics
6. To Cut or t o Boost
7. Term inology and definit ions- Filt ers
8. Type of EQ
9. Phase t he bi- product
1 0. Let it begin – Drum s – Kick
1 1. Snare
1 2. Drum Loops
1 3. Voice
1 4. Prim ary and Secondary EQ
1 5. Voice Exam ples – Double Tracking
1 6. Voice EQ Addit ional Exam ples
1 7. Mixing EQ – Gospel
1 8. Mixing EQ – Exam ples
i. H ow To Use Th is Book
Pr e fa ce – H ow t o Use Th is Book
Tut orial Files
Many of t he t ut orials in t his book have associat ed files t hat are used t o explain t he concept s
m ore clearly t o you. All t ut orial files ar e included in t he ‘sounds’ folder t hat cam e wit h t his book and
Make sure you ext ract all t he files correct ly wit hin a program such as Winzip (w w w .w in z ip.com) .
Searching
The beaut y of a PDF is t hat you can sear ch it s cont ent s very easily fr om w it hin t he fr ee Abode Acrobat reader. I recom m end you inst all t he full version ( it ’s st ill fr ee) which is available fr om Her e
h t t p:/ / w w w .a dobe .com / pr odu ct s/ a cr oba t / r e a dst e p2 .h t m l
1 . I n t r odu ct ion t o Equ a lisa t ion
Alm ost every forum I visit , or every 1 in 5 em ails I receive, t he subj ect m at t er t hat is m ost discussed is EQ ( equalisat ion) .
What it is, how t o use it and when t o use, which one t o use and which is t he best for t he given t ask and, m ost im port ant ly, what frequencies cover cert ain sounds. Everyone is aft er a quick form ula.
What m ost people do not realise is t hat EQ is one of t he m ost powerful t ools available t o a producer, and m ast ering house, and t o m ast er t his t ool one needs t o underst and frequencies.
When t he t er m 'EQ' ( equalisat ion) is m ent ioned, people invariably t hink of t he t one cont rols on
This whole headache began in t he broadcast ing field. Blam e t hose guys.
Act ually t he first ever inst ances of equalisat ion was in t he com m unicat ions indust ry. EQ was used t o count eract som e of t he problem s in t elephone syst em s.
Tone cont rols were creat ed and used t o com pensat e t echnical inaccuracies in t he recording chain, m ore not ably, com pensat ing for m icrophone colourat ion and room acoust ics. EQ was used as a m eans of cont rolling t he gain of a range of frequencies.
However, before I get int o t his deeper, I need you t o underst and ‘sound’ and ‘frequencies’. Those t hat have read m y t ut orials on m y websit e ht t p: / / ww w.sam plecraze.com will know t hat I have covered t he subj ect of sound in det ail. For t hose who cannot be bot hered t o read t hose t ut orials, here is t he condensed version:
To underst and any part of EQ you need t o underst and sound, w hat it is, how it m oves, how w e perceive it and why we perceive it t he w ay w e do.
Ta ggin g rem em bering what a sun looks like. The big house in t he cent re of t he drawing will always st ay in your m ind. The cow is always alone and st rongly accent uat ed and is always t ot ally out of size in com parison t o t he house. The ground is always green grass and t he sky always blue and if t here is a cloud t hen it is always one big round cloud.
These im ages are st rong and always st ay in m em ory. The sam e t echnique is used in t agging. We creat e an im age rich in as m any of t he senses as possible and t hat will always st ay in our m inds, far st ronger t han having t o learn t hings in parrot fashion.
2 . Sou n d
Sound is t he displacem ent of air around t he source and how we perceive t hat displacem ent . Right , w hat does t hat m ean?
Our eardrum s pick up t he displaced air and our brains t hen process t he dat a as sound. I could go int o t he det ails about t he ear m uscle vibrat ing and t he eardr um being a cham ber and on and on and on…but t hat is not w hat you w ant t o know .
The t agging im age here is t he r ipple.
Has it ever occurred t o you t hat when a pict ure is drawn of a guit ar am plifier, wit h a guit arist playing loudly, you always see a few arced lines draw n com ing out of t he am plifier?
3 . Com pon e n t s of Sou n d
The result is m easured as cycles/ second and t his unit of frequency is called a Hert z and t he abbreviat ion is Hz.
I put very lit t le im port ance on frequency chart s for inst rum ent s. Alm ost every websit e you
I will, of course, give exam ples of cert ain sound frequency ranges and what happens when you apply cert ain EQ param et ers t o t hem .
So w e now know t hat higher frequency sounds are higher in pit ch as t here are m ore cycles per second and lower frequency sounds have few er cycles per second. Easy.
Right now I t hink it is im port ant t o show you a frequency chart for all t he not es on a keyboard Engineers live by t hem as do producer s and Sound Font developers.
I f t here is one piece of inform at ion t hat overrides any ot her in t erm s of im port ance it is t he underst anding of frequencies.
How oft en have you t ried t o m ix your t rack only t o be m yst ified by t he result ?
Term s like ‘m uddy’ or ‘t hin’ spring t o m ind and t hese are all because t he m ixer or producer does not have an underst anding of frequencies and t heir effect on ot her frequencies in a m ix.
Underst and t his basic concept and you will be arm ed wit h t he m ost pot ent weapon.
Waveform s and frequencies go hand in hand.
Underst and t hese t wo and t he rest is all about using t he t ools.
4 . M idi a n d Fr e qu e n cy Ch a r t
M idi N o N ot e Ke yboa r d Fr e q
As you can see from t he funky chart t hat for every oct ave you go up you double t he frequency
and it is t he sam e in reverse, for every oct ave t hat you go down, you halve t he frequency.
Exam ple: C4 is 261.63 Hz. To get t o C5 we double t he frequency so it is now 523.25 Hz. And if we want ed t o go from C4 t o C3, it would be 130.81 Hz. There, a few secret s t o t hrow about .
Now let us creat e t he t ag for t his whole sound t hing.
like orange or deep red and t he whole im age is nice and slow. For higher frequencies I use sm aller and fast er w aves and in harder colours like bright yellow or st riking blue. This im age is t hen enhanced furt her by having a person st anding in front of t he w aves, usually m e, but m y 2 cycles and I have arrowed in t he second cycle, no difference which cycle I arrow as t hey are bot h repeat s. Anyway I had t o arrow t he second cycle so as not t o int rude on t he am plit ude earlier and all w av eform s are represent ed lik e t his, as a graph, and how each cycle behaves or how a num ber of cycles behave in relat ion t o each ot her.
This is m eant t o be fun so let ’s keep it t hat w ay
This is t he m ain reason why one sound at a cert ain frequency will sound com plet ely different t o anot her sound at t he sam e frequency.
When you com e t o use EQ you will underst and why we do not have one overall frequency chart for all sounds.
A fem ale voice at C3 w ill sound com plet ely different t o a m ale voice at C3 so t he EQ propert ies w ill have t o be different as t he t im bres of t he t wo sounds are dist inct ly different .
The first challenge when EQing m usical sounds is in deciding which area of t he frequency spect rum cor responds t o which elem ent of a sound's t im bre. I f you want t o em phasize t he at t ack of a bass drum , where should you boost ? Alt ernat ively, if your vocals sound boxy, where can you cut or boost m ost effect ively?
This area is called t he ba n dw idt h, t he area at w hich you w ant t o boost or cut .
I t is also im port ant t o not e t hat we hum ans have a hearing range of bet ween 20 Hz t o 20 kHz. To be honest , anyt hing at t he 20 Hz level is felt m ore t han heard. This is w hy producer s
5 . Fu n da m e n t a ls a n d H a r m on ics
One t hing t hat can help a lit t le in deciding t his is t o know w hat frequencies correspond t o t he
fu n da m e n t a ls of each m usical pit ch. For a st art , t his allow s you t o define t he low er lim it of t he range of frequencies generat ed by pit ched sounds.
Let ’s t alk a lit t le about H a r m on ics.
First , t he em ot ional definit ion or descript ion:
All m usical t ones have a com plex waveform , m ade up from loads of different frequencies.
All sounds ar e form ed using a com binat ion of sine waves at varying frequencies and am plit udes.
Now it get s a t ouch m ore involved. I f we look at t he frequencies of a com plex w aveform , t hen t he lowest frequency is called t he fu n da m e n t a l fr e qu e n cy.
The fundam ent al frequency det erm ines t he pit ch of t he sound. The higher frequencies are called ove r t on e s. I f t he overt ones ar e m ult iples of ( x1, x2, x3 et c) t he fundam ent al
frequency t hen t hey are called h a r m on ics. The overt ones or u ppe r pa r t ia ls as som e people like t o refer t o t hem as, m ust be m ult iples of t he fundam ent al t o be know n as harm onics. These frequencies and t heir am plit udes det erm ine t he t im bre of a sound.
Now, t he sim pler explanat ion:
I f you have a waveform t hat has a fundam ent al frequency of 100 kHz, t hen t he second harm onic will be 200 kHz and t he t hird harm onic will be 300 kHz and so on……
I f you t hink about t he irregular waveform of noise t hen you will underst and t hat it has no harm onics. Noise cont ains a wide band of frequencies and it is generally accept ed t hat , at w aveform level, t here are no harm onics as t he w aveform is non- repeat ing.
Below is a list wit h approxim at e figures for inst rum ent frequency ranges and t heir
fundam ent als. As I said earlier, I do not like list s t hat purport t o be an accurat e frequency range t able for varying inst rum ent s, due t o t heir inaccuracy. However, t his list is sim ply t o help you underst and t he fundam ent al and harm onic frequencies of a select ion of inst rum ent s.
I n st r u m e n t Fu n da m e n t a ls H a r m on ic
Kick Drum 30- 145 Hz 1- 6 kHz
Snare Drum 100- 200 Hz 1- 20 kHz
Cym bal 300- 580 Hz 1- 15 kHz
Acoust ic Bass 40- 295 Hz 1- 5 kHz
Elect ric Bass 40- 300 Hz 1- 7 kHz
Acoust ic Guit ar 82- 988 Hz 1- 15 kHz
Elect ric Guit ar 82- 1319 Hz 1- 15 kHz
Piano 28- 4196 Hz 5- 8 kHz
Bass Voice 87- 392 Hz 1- 12 kHz
Alt o Voice 175- 698 Hz 2- 12 kHz
Soprano Voice 247- 1175 Hz 2- 12 kHz
6 . To Cu t or t o Boost
Anot her com m on problem t hat beginners m ake is t o boost frequencies in a m ix t o t ry t o m ake it st and out m ore. This is t rue part icularly for drum sounds. The problem here is t hat noise is also boost ed so what you end up wit h is a noisy sound in t he m ix, which st ands out even m ore t han int ended. So t he beginner t ries t o com pensat e by boost ing ot her sounds t o at t ain an even balance. Yep, you guessed it , m ore noise.
The t rue art of EQ is t o cut , not boost . always helps t o cut cert ain frequencies wit h t he aim of accent uat ing ot her frequencies. This is t he Art.
Why?
Because t he individual sounds sound clear and balanced, inst ead of m uddy and biased. By t aking away, we give. By boost ing t oo m any frequencies and channels, we com prom ise t he headroom of t he dynam ic range of t he audio. Whet her it is in a m ixer or DAW syst em , boost
individual sounds can be so m uch m ore effect ive t han choosing an overall frequency range for a num ber of sounds and alt ering t hat.
The sam e is t rue of t he whole m ix it self. EQ can be used t o alt er t he apparent loudness of a m ix, a t echnique com m only used by m ast ering houses.
Our hearing syst em 's frequency response changes w it h loudness. I t is im port ant t o m onit or at a realist ic and sensible volum e w hen applying EQ, because t he perceived effect m ay be quit e different at higher or low er list ening levels.
However, t he fact t hat t he ear get s m ore sensit ive t o high and low frequencies t he higher t he int ensit y of t he sound, m eans t hat t he brain t ends t o int erpret any sound which is
com parat ively rich in t hese frequencies as loud.
Therefore, if you want m usic t o sound louder at low list ening levels, t hen it m akes sense t o boost at t he ext rem es of t he frequency range. This is what som e hi- fi syst em s do when t he Boost or Loudness but t on is used.
I n m ost playback syst em s, you will see what is referred t o as t he ‘sm ile’ curve on graphic EQs.
I t is also t rue t o st at e t hat at low list ening levels, t he hum an hearing syst em encount ers alongside anot her sound, get s swallowed up by t he second sound?
This happens because t he t wo sounds have very sim ilar frequencies, so one ‘m asks’, or hides, t he ot her sound. This result s in t he m asked sound sounding dull, or j ust sim ply unheard. EQ is a very good t ool t o use in t hese inst ances. By cut t ing away cert ain frequencies from one of t he sounds, you will invariably expose and boost t he frequencies of t he ot her sound, t hus
accom plishing separat ion and dist inct ion bet ween t he t wo sounds.
Anot her pit fall t hat m ost beginners and som e pros fall int o is what I call t he EQ Syndrom e. t he separat e frequency bands inst ead of a rich t apest ry of frequencies, and t he song t hen st art s t o ‘t ire’ t he list ener.
I n t hese inst ances it is cr ucial t o have a clean and balanced recor ding, so t hat t he EQ process can be creat ive as opposed t o correct iv e. You should st rive t o record t he source sound elem ent s at near enough t he frequencies t hat you will event ually release. That way you will only need t o m ake m inor adj ust m ent s inst ead of sweeping corr ect ions.
The added advant age of a clean and balanced recording, wit h em phasis on t he correct source frequencies, is t hat you can always com e back and rem ix t he ent ire recording off a blank palet t e. The recording w ill never t ire it self and never be const rict ed in t erm s of frequencies. This will alw ays allow for refreshing rem ixes.
EQ has m any guises.
We use correct ive EQ in edit ing suit es and product ion houses t o isolat e and dim inish a frequency or sound, t o accent uat e or elevat e a part icular sound, frequency or recording. Classic cases are t hat of broadcast engineers having t o isolat e t he narrat ive or spoken part am idst a plet hora of ot her background noises, or t o sim ply rem ove a click or unwant ed sound, and, even m ore com m only, t o alt er t he spoken par t t o sound m ore pleasing in t he event t hat it is harsh sounding. The lat t er is m ore in t he dom ain of creat ive or m usical EQ.
Using EQ as a t ool t o separat e t racks is anot her favourit e of producers.
A lot of beginners m ake t he m ist ake of poorly recording t he source m at erial and t hen using EQ t o t ry t o separat e and boost t he gains of t he recorded t racks.
Separat ion can only be t rut hfully affect ed if t here is a clear dist inct ion bet ween frequencies, so t hat you only need t o isolat e sm all frequency ranges and apply nom inal boost s. Having a m uddy m ix of low end inst rum ent s m akes for having t o perform som e ext rem e cut s/ boost s, very flash way of saying ‘frequencies t hat are not needed’.
You will find t hat t here ar e a lot of inst rum ent s t hat share low frequencies, not j ust basses and kick drum s. So, rem oving predefined low frequency ranges from som e of t he low end
inst rum ent s in your m ix can act ually separat e and define t he low frequencies even m ore.
I n fact , t his has got t o t he point whereby hi- fi m anufact urers put preset EQ set t ings on t heir syst em s for t he list ener t o choose from . Ghast ly preset s called Pop, Am bient , Disco et c. are predefined EQ t em plat es t hat you can t weak t o your heart ’s cont ent .
A well m ast ered m ix will not need any addit ional EQ m anipulat ing at t he list ening st age, as good m ast ering houses will t reat t he signal for opt im um use on all list ening m edium s.
A good m ast ering house/ engineer can m ake or break your t rack in t he com m ercial vein. Their m ost valued weapon: EQ.
7 . Te r m in ology a n d de fin it ion s- Filt e r s
To furt her underst and t he t erm inology used in t his E- book, I feel it is essent ial t hat you underst and t he following:
Cu t - off fr e qu e n cy
This is t he point ( frequency) at which t he filt er begins t o filt er ( block or cut out ) . The filt er will lower t he volum e of t he frequencies above or below t he cut - off frequency depending on t he t ype of filt er used.
Boost ing t he narrow band of frequencies at t he cut - off point is called resonance. Also know as Q and bandw idt h, in effect , he higher t he resonance, t he narrower t he bandwidt h.
A very cool way of underst anding what resonance sounds like is t o perform what we call a ‘sw e e p’. Yes, anot her flash and funky t erm we progr am m ers use t o explain som et hing really sim ple.
Sw eeping t he filt er m eans m anually t urning t he resonance knob, clockwise and ant i- clockwise. Select a waveform , set t he cut - off point and t urn t he resonance knob and list en
t o t he result s. As you are sweeping, t he resonance goes t hrough all t he different frequency harm onics, of t he waveform , and boost s/ cut s t hem , at t he cut - off point .
Q
Also know n as ‘w idt h of t h e filt e r r e spon se’, t his is t he ‘ce n t r e fr e qu e n cy’ of t he bandwidt h and is m easured in Hz. Also know as bandwidt h and resonance.
A high Q value denot es a narrow filt er widt h ( bandwidt h) . A low Q value denot es a wide filt er widt h ( bandwidt h) .
8 . Type s of EQ
Passive EQs do have t heir uses. Alt hough t hey are inflexible, t hey can perform reduct ion t asks reasonably well. By cut t ing high frequencies, t hey are able t o cut or lower hiss ( high frequency noise) . How ever, by t heir very nat ure, passive EQs, or filt ers, have t o t hen have t he signal boost ed t o com pensat e for t he cut . This, in it self, int roduces noise int o t he signal pat h. The noise com ing from t he am p used t o boost t he signal.
Act ive EQs
Because of t he lim it at ions of passive EQs, m ost EQs are built around act ive filt er circuit s which use frequency select ive com ponent s, t oget her wit h a low noise am plifier.
And it is t his t ype of EQ t hat we are now going t o concent rat e on.
Fix e d Fr e que n cy EQ
Pret t y self explanat ory, t his EQ allows cut / boost of one or m ore frequencies. There are no addit ional cont rols over t he usual com ponent s, like bandwidt h, Q, et c.
Pe a k in g EQ
A peaking EQ is an EQ which boost s a specific band of frequencies.
Whereas a shelving filt er has a shelf like curve, t his filt er has a bell shaped curve. The Q set t ing det er m ines t he widt h of t he bell, while boost or cut det er m ines t he height or dept h of t he bell.
Tw o Ba n d or Th r e e Ba n d
These t ypes of EQ sim ply have t wo or t hree separat e frequency ranges. Usually denot ed as low, m id and high, t hese bands can only be cut or boost ed.
Sh e lvin g Filt e r / EQ
We have t ouched on t he use of t one cont rols t hat are form s of EQ. These cont rols cont rol a t ype of filt er t hat is called a sh e lvin g filt er. I n t he case of t he bass and t reble knobs, low pass and high pass shelving filt ers are used respect ively.
A low- pass shelving filt er passes all frequencies below it s cut - off frequency, but a t t e n u a t e s
all frequencies above it s cut - off frequency. Sim ilarly, a high- pass filt er passes all frequencies above it s cut - off frequency, but affect s all frequencies below it s cut - off frequency.
Most m ixers w ill allow for low and high frequency EQ, and in t he case of shelving filt ers, t heir
The diagram below illust rat es what happens if you cut or boost frequencies in a low- pass and a hi- pass filt er. cut is m ost oft en cont rolled wit h sliders. The sliders are a graphic represent at ion of t he frequency response, hence t he nam e 'graphic' equalizer.
The m ore frequency bands you have, t he m ore cont rol and accuracy you have over t he frequency response.
Mixing consoles rarely have graphic EQs, but PA m ixers oft en have a st ereo gr aphic EQ for EQing t he final st ereo out put .
A graphic equalizer uses a set of ba n d- pa ss filt ers t hat are designed t o com plet ely isolat e cert ain frequency bands.
Ba n d Pa ss Filt e r t ype of old radio sound, or use it for isolat ing a narrow band of frequencies in recordings t hat have t oo m uch low and high end.
Try t his filt er on synt hesizer sounds and you will com e up w it h som e w acky sounds. I t really is a useful filt er and if you can run m ore t han one at a t im e, and select different cut - offs for each one, t hen you will get even m ore int erest ing result s. I nt erest ingly enough, band pass filt ering is used on form ant filt ers t hat you find on so m any soft synt hs, plugins, synt hesizers and sam plers. Em u are known for som e of t heir form at filt ers and t he t echnology is based around band pass filt ers.
I t is also good for t hinning out sounds and can be used on percussive sounds as well as creat ing effect s t ype of sounds.
I oft en get em ails from program m ers want ing t o know how t hey can get t hat old radio effect or t elephone line chat effect or even NASA space dialogue from space t o Houst on. Well, t his is one of t he t ools. Use it and experim ent .
You w ill enj oy t his one.
N ot ch Filt e r – a lso k n ow a s Ba n d Re j e ct Filt e r
The inverse of a band pass is t he not ch filt er.
This is a very pot ent EQ/ filt er. I t can hom e in on a single frequency band, and cut / boost it .
Used specifically for ‘problem ’ frequencies, t he not ch can be one of t he m ost useful filt ers. This is t he exact opposit e of t he band pass filt er. I t allows frequencies below and above t he off point , in essence, you are select ing t he frequencies around t hat cut - off point and
elim inat ing t hem .
t hat have a m uddy or heavy m id sect ion, or on sounds t hat have a lit t le noise or frequency clash in t he m id sect ion of a sound.
Pa r a m e t r ic
This filt er cont rols t hree param et ers, frequency, bandwidt h and gain. You select t he range of frequencies you want t o boost or cut , you select t he widt h of t hat range and use t he gain t o boost or cut t he frequencies, wit hin t he select ed bandwidt h, by a select ed am ount .
The frequencies not in t he bandwidt h are not alt ered. I f you widen t he bandwidt h t o t he lim it of t he upper and low er frequencies ranges t hen t his is called shelving. Most param et ric filt ers have shelving param et ers.
Param et ric filt ers are great for m ore com plex filt ering j obs and can be used t o creat e real dynam ic effect s because t hey can at t enuat e or boost any range of frequencies.
Basically, t he param et ric EQ places several act ive filt ers across t he frequency spect rum . Each filt er is designat ed t o a frequency range, low, m id, high et c. You have t he usual cut / boost , resonant frequency and bandwidt h. I t is t hese qualit ies and t he cont rol over t hem t hat places t his part icular EQ in t he producer’s arsenal of dynam ic t ools, and m akes it det ailed and versat ile.
However, you need t o underst and what you are doing when using a param et r ic EQ, ot herwise t hings can go very wrong.
Underst and frequencies and sound, and you will be in t ot al cont rol.
Qu a si- pa r a m e t r ic EQ
This is j ust anot her form of param et ric EQ but wit hout t he bandwidt h cont rol.
Sw e e p EQ
This is very sim ilar t o a band pass filt er, but wit h variable cent re frequency, and no cont rol over t he widt h of t he filt er response ( Q) .
9 . Ph a se t h e bi- pr odu ct
A very im port ant aspect of EQ, in relat ion t o affect ed and non- affect ed frequencies, is t hat of phase.
We know t hat affect ing t he frequencies t hat w e have chosen for equalisat ion, also affect s t he phase of t hose select ed frequencies, in relat ion t o t he unaffect ed frequencies. The process it self also affect s t he frequency response of t he signal being t reat ed. We are t alking about t iny offset s here. Every t im e a frequency range is select ed and t reat ed, t he affect ed frequencies will exhibit displacem ent , in relat ion t o t he unaffect ed frequencies. This offset is phase. Whereas we are not t alking about big swirling phase effect s, as in guit ar phasing, we are, however, t alking about t he pure definit ion of phase. This is probably not som et hing t hat you will hear as phase, but it is som et hing t hat affect s our percept ion of t he t reat ed frequencies.
Depending on t he nat ure of t he displacem ent , we perceive t he t r eat ed frequencies as dist ance. Why is t his im port ant ?
This is what different iat es t he t onal charact erist ics of analogue hardware and digit al soft ware EQs.
The analogue EQ unit will exhibit far m ore m usical phase changes t han it ’s digit al count erpart , and at very low gains, whereas t he digit al EQ unit will have t he advant age of leaving t he phase relat ionships hardly affect ed, t hus allowing for m ore robust gain changes.
1 0 . Le t I t Be gin
We have covered EQ as a subj ect . I t is now t im e t o begin wit h walk t hrough exam ples.
The following exam ples will deal wit h inst rum ent s and vocals. This way, we have a good variet y of scenarios t o deal wit h, and a good range of frequencies t o cover and m anipulat e.
Drum s – Kick
Fig 1
List en t o t his file (K0 2 0)
As you can see from t he above im age (Fig 1) , I have opened up a kick file in Sound Forge. We are now going t o m anipulat e t his file and creat e new files, by t he sim ple use of EQ.
However, before we perfor m any t ype of m anipulat ion, I w ant t o show you how t o evaluat e and see t he frequency spect rum ( range) of any select ed audio file.
For t his, we use a piece of soft ware, or hardware, called a spect r um analyser. Sound Forge has t his t ool under t he m enu opt ion, Tools - Spect rum Analyser.
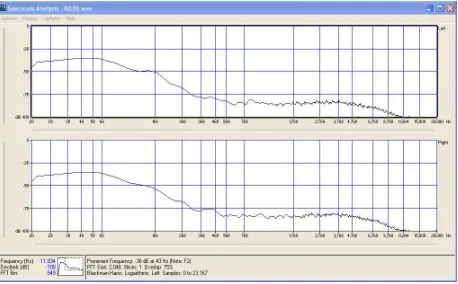
Fig 2
By using t he analyser we are able t o fully see t he frequency st ar t , t he frequency body and t he frequency t ail- off.
This t ype of t ool is invaluable in helping us t o apply EQ.
You will appreciat e how useful t his t ool is when we com e t o rem oving unwant ed frequencies, or w hen w e com e t o using EQ t o eit her correct flaw ed vocals, or t hin out or t hicken vocal lines.
The Y axis ( left hand side figures) denot es am plit ude/ level in dB. The X axis ( bot t om figures) denot es t he frequency in Hz.
The analyser t ells us t hat t his kick st art s on a frequency of 20 Hz at – 45 dB ( at t ack) , rises t o 65 Hz at - 36 dB ( height of at t ack’s decay) , drops t o and levels off at around 88 dB.
This helps us a great deal in underst anding t he charact erist ic and shape of t he kick file and t his in t urn gives us a det ailed num erical and graphical reference for set t ing up our EQ param et ers.
What did I j ust say, in English?
Fig 3
I highlight ed t he peak of t he kick file’s waveform wit h t he m ouse and it gave m e t he figure above.
I can m ove m y m ouse over any part of t he waveform and it will highlight t he dat a I need.
Wit h t his exam ple, I can now decide what t ype of EQ I want t o apply and by how m uch.
The punch com ponent, or at t ack, of m ost bass drum s lies bet ween about 60 and 110Hz. This is where you find t he low- end ener gy of m ost kicks. Below t his range, you'll m ost ly feel, rat her t han hear, any boost , and it 's easy t o eit her neglect t his and be left wit h all sort s of frequency im balances in your m ix, or t o be confused by what is act ually t he ‘bot t om - end’ of your m ix..
Wit h sounds t hat t end t o be ‘warm er’, as opposed t o ‘cut t ing’, you w ill invariably find t hat t he frequency area concent rat ed on is bet ween 180 – 220 Hz.
Working on a kick t hat m ight need t o be m ore prom inent in t he m ix, or cut t hrough on m id range m onit ors, t he 2 – 6 kHz range is where t he m anipulat ion t akes place.
Fig 4
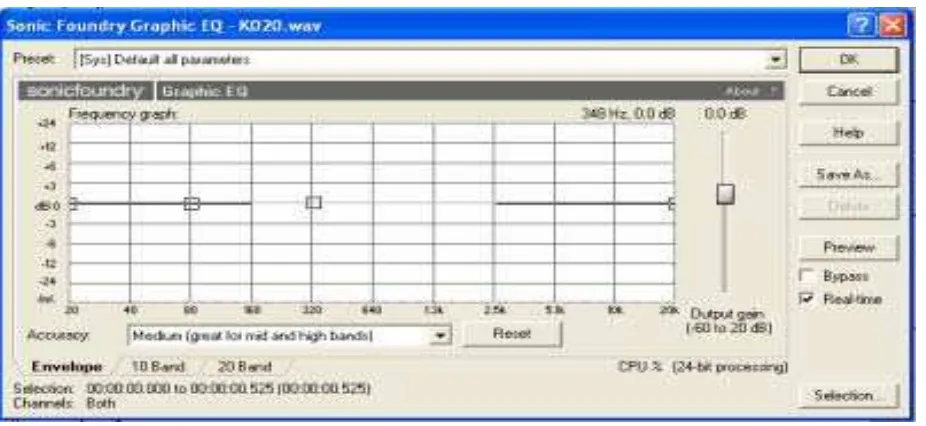
And here is t he Graphic EQ (Fig 5) .
Fig 5
I have not input , or drawn, in t he EQ curve. The Graphic EQ is current ly at default wit h all t he param et ers at 0.
Now, let us shape t he EQ curve by using t he nodes in t he Graphic EQ window. The default line ( m iddle of screen) is at 0dB, across t he whole frequency spect rum .
I have always preferred visual int erfaces for t hese t ypes of dynam ic m anipulat ions, as
opposed t o input t ing fields and num erical dat a int o graphs. I can visually creat e t he EQ curves here, inst ead of having t o input num bers and hope for t he best .
There is also som et hing very sat isfying in having such inst ant and visual cont rol.
Fig 6 clearly shows what I m ean by nodes.
Fig 6
As you can see from t he above im age, I have a t ot al of four nodes (lit t le boxes) across t he default line.
I am now going t o m ove t hese nodes around and creat e an EQ shape for t he kick drum file
And once you press ‘OK’, t hat will render t he new EQ shape over t he audio file. The result is below (Fig 8) .
List en t o result (K0 2 0 Gr a ph ic)
Fig 8
The kick file now sounds deeper, wit h less ‘t op end’. The EQ shape accent s t he at t ack and decay of t he at t ack, and drops rapidly from t here t hus m aking t he body and t ail seem bot h quiet er and as if t he higher frequencies have been filt ered, which t hey have.
Now let us put t his file int o t he spect rum analyser. This will clearly show if I am right or w rong (Fig 9) .
Yep, spot on.
You can see t hat t he at t ack and at t ack decay are peaked and sm oot hed bet ween 48 Hz – 66 Hz. Aft er t hat , t he am plit ude drops dram at ically over t he frequency spect rum .
Whereas for now t he spect rum analyser is useful, it is however not essent ial. Lat er, when we com e t o deal w it h isolat ing frequencies or t rying t o use EQ as a m eans for a bet t er m ix, it will becom e invaluable.
Have fun wit h t his t ool feat ure in your audio edit or. You will be am azed at how m uch you will learn, j ust by viewing frequency spect r um s of different audio files.
Now let us use t he sam e kick file, but wit h a different t ype of EQ, an EQ w e discussed earlier, t he Paragraphic EQ.
So, t o begin, we perform t he exact sam e sequence as before. I n fact , it is good pract ice t o st ick t o a procedure and t o keep pract icing t hat . This helps you t o perform t asks quicker and t o fault find in t he event t hat you have m ade a m ist ake in t he process.
Have a look at Fig 1 0. I t shows t he param et ers of t he Paragraphic EQ.
Fig 1 0
There are 4 bands and each bandwidt h can be adj ust ed. This Paragraphic EQ has a lit t le m ore cont rol t han t he usual Paragraphic EQs, in t hat you can not only shape t he bands by adj ust ing t he cent re frequencies and t heir am ount s, but also vary t he posit ion of each band.
I n Fig 1 1, I have chosen t o rem ove alm ost all of t he low end and boost ing t he m id t o t op end.
This has given m e a kick wit h very lit t le low frequency cont ent , hard and t hin sounding. This is a good way of explaining how t o use t his EQ and how it sounds.
Fig 1 1
Fig 1 2 shows t he new kick file aft er being rendered wit h t he Paragraphic EQ.
The new kick w aveform (Fig 1 2) clearly shows what t he Paragraphic EQ has done t o t he frequency and am plit ude of t he waveform .
The Paragrahic can be used very effect ively as a Not ch Filt er (Fig 1 3) and also t o dem onst r at e t he Flet cher Munson Curve (Fig 1 4) .
Fig 1 3
The above shows how t o use t he Pargraphic EQ as a Not ch Filt er t o isolat e and rem ove 60 Hz cycle hum . This is a great t ool t o have as t here are t im es when your audio file m ight exhibit m ains hum at 60 Hz. This w ay you can isolat e and rem ove t he hum .
Cool huh?
Now let us use t he sam e kick file, but t his t im e we will use a Param et ric EQ.
I like using t his EQ, because not only is it sim ple t o use, but it also has addit ional filt er set t ings t hat m ake t his EQ very versat ile.
Look at t he set t ings I am using in Fig 1 5.
I have adj ust ed t he param et ers so t hat I am left w it h a high frequency shelf. I am act ually
cut t ing frequencies and not boost ing.
The kick file I am using for t hese exam ples is a good all round kick file, t hat covers m ost of t he frequencies I would expect t o see in a file of t his nat ure, and is not lim it ed t o any part icular frequency. That is why it is such a good file t o use.
As we discussed earlier, cut t ing is always preferred t o boost ing, and t his exam ple reflect s t hat t hinking beaut ifully.
Fig 1 5
Now list en t o t he result (K0 2 0 Pa r a m e t r ic h igh sh e lf) .
And now I have used t he Band Pass Filt er on t he Param et ric, t o give t he kick sound a boxy
feel (Fig 1 6) .
Fig 1 6
Fig 1 7 is an im age of a 2 band EQ, as discussed ear lier.
Fig 1 7
As you can see, you have only t wo nodes t o play wit h. This EQ is really self explanat ory.
For four bands of EQ, sim ply add anot her t wo bands t o t he above. The t hinking is t he sam e. List en t o t he 2 band EQ kick (K0 2 0 2 ba n d EQ)
Drum s are probably t he easiest inst rum ent s t o EQ.
Apply sm all am ount s of EQ, as t he process and result of applying any dynam ics will result in som e form of degradat ion. So, be sensible and wary of drast ic changes. Keep t hings nat ural.
1 1 . Sn a r e
The snare sound is equally easy t o EQ. Snares t end t o have a good frequency range as t here are so m any t ypes of snares t hat t o t ry t o and classify t hem in one specific frequency band, would be naïve and uninvent ive.
How ever, t he low- end, or fat ness, of snares generally lies in t he 100- 440 Hz frequency range. The energy of t he snare’s body will t end t o be in t he 750- 1.4 kHz frequency range and t he
crispness of t he at t ack will lie in t he 4- 8 kHz frequency range.
These are generalisat ions, but t hey will give you an idea as t o where you m ight want t o begin, when applying EQ.
But , as wit h all t hese exam ples, t he Spect rum Analyser is your best friend.
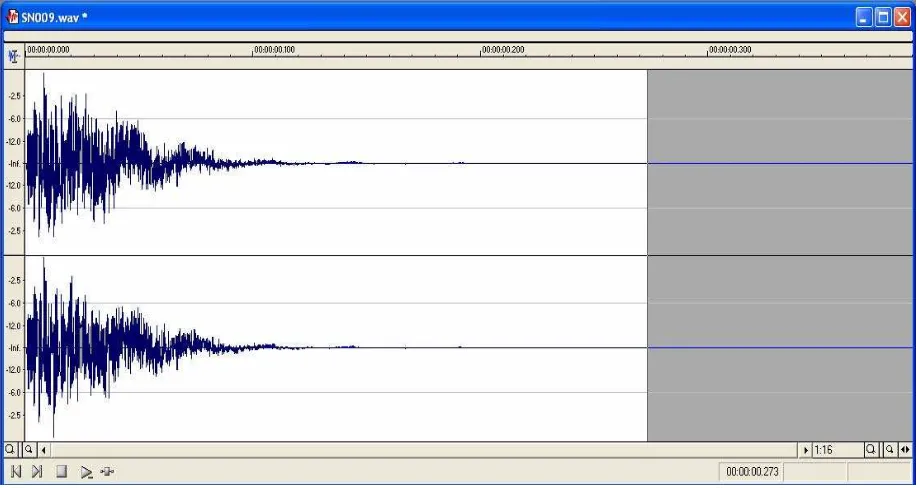
Wit h EQ it is oft en very easy t o creat e a varied select ion of snares from one source snare. Let us begin wit h a sim ple snare sound (Fig 1 8) .
Fig 1 8
List en t o t his snare (SN 0 0 9) .
A st andard m id range bucket snare, com prising a m et allic base wit h som e noise elem ent . Generally, a good Hip Hop snare sound.
Now let us creat e anot her snare from t his source snare.
I am going t o use a 4 band Paragraphic EQ, but t his t im e I am going t o select t he t ype of band I want t o adopt .
I n t his inst ance I am using t he Bell shape. You can see from Fig 1 9, I have select ed t he Bell shape for t hree of t he bands. The Bell sim ply denot es t he shape of t he frequency curve.
Fig 1 9
Wit h t he set t ings I have used above, I have concent rat ed m ore on t he m id- range frequencies of t he snare sound.
This is a good w ay t o rem ove t he low - end frequencies and keep t he m id- range ‘alive’ and t he t op- end as is.
You can clearly see what frequency bands I have used and by how m uch.
This EQ allows m e t o m ove t he bands via t he num bered nodes. I can also t urn off any nodes t hat I do not want t o use. I can also change t he shape of t he bands t oo (Fig 2 0) .
Fig 2 0
Fig 2 1 shows t he result , aft er rendering t he original snare wit h t he EQ.
List en t o t he new snare (V SN 0 0 9 . 4 ba n d EQ W a ve s) .
As you can see, I can change t he EQ shapes for each band, but I also have Resonance and Q
for t he filt er t ypes.
I f you are having problem s underst anding t he above, t hen go back t o t he earlier part of t his e-book where Resonance and Q are explained.
I like t his EQ a lot . I t allows m e far m ore det ail and cont rol over t he frequency bands. I also have a m ain out for t he bands, and w it h it ’s own param et ers: frequency shape, resonance, Q, low- pass filt er and overall gain.
Just for fun, I creat ed a cr azy shape for t he bands, but it really sounds t ight and painful.
This EQ will give you endless hours of fun and is one of t he m ost det ailed of t he EQ plugins available.
List en t o t he snare (SN 0 0 9 w it h Lin e a r EQ)
I could go on and on wit h exam ples of snare EQ, but I feel t hat you have enough inform at ion above t o st ar t t o t ry som e of your ow n EQ proj ect s.
As m ent ioned earlier, and m any t im es, keep it sim ple and do not apply t oo m uch EQ unless you are aft er a cert ain effect . Ot herw ise, less is always m ore, and in part icular, w hen it com es t o correct ive EQ.
I picked kicks and snares as m y subj ect m at t er here, sim ply because t hey are t he m ost com m on percussive sounds t hat get t r eat ed wit h EQ.
I t would be point less t o repeat t he above for claps, hi hat s, or any ot her percussive sound, as you have m ore t han enough inform at ion t o help you t o apply t hese t echniques t o any
percussive elem ent .
I f you do have any problem s w it h frequency ranges, j ust use t he Spect rum Analyser.
You know how t o use it , so …….use it !
1 2 . D r u m Loops
Drum loops are a lit t le m ore com plex as t he loop it self m ight incorporat e a num ber of
percussive sounds t hat also need t o be considered w hen EQ is applied. How ever, t his is again not as com plicat ed as it seem s.
The t rick her e is t o t ry t o m ake sure t hat you t reat each drum sound separat ely, and t hat t he final st ereo m ix of t he drum loop will incorporat e v arying EQ curves for t he isolat ed drum sounds.
I find t hat using t he sam e EQ soft ware/ hardware for all t he individual drum sounds m akes t he final loop sound m ore nat ural. As m ent ioned earlier, different EQ unit s have different t onal qualit ies, so keeping t o t he sam e unit m akes t he pr ocess sound m ore nat ural. dynam ic frequency range, w it h flow ing frequencies, as opposed t o a com pact ed frequency range. This will ensure a lively drum loop wit h all t he com ponent s nicely residing in t heir frequency ranges.
Used gent ly and cleverly, EQ can dynam ically change a drum loop’s sound but m aint ain t he believable and nat ural dynam ic frequency cont ent inherent in t he individual com ponent s of t he drum loop.
Anot her area t o be very wary of is t hat of frequency crossovers ( overlaps) . The high end of a snare sound m ight st art t o share t he low end frequencies of a hi hat sound. The m id range of a kick m ight share frequencies wit h t he low end of a t om drum , or vice versa.
Always be caut ious of t hese frequency overlaps, because if you are not , t hen t here will be gain boost s where frequencies overlap, plus possible phasing issues and a host of ot her anom alies. Let m e explain t he above wit h exam ples.
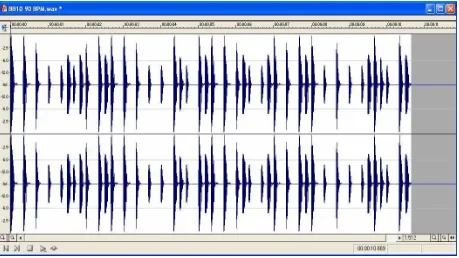
Fig 2 4 is a st raight forward drum loop incorporat ing a kick, snare and hi hat s.
Fig 2 4
List en t o (Be a t 1 9 0 BPM )
Now let us EQ it .
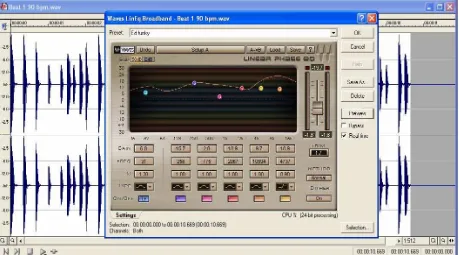
I am using t he sam e EQ as I used earlier, t he 5 band affair.
Fig 2 5 shows what I have done wit h regards t o shaping t he EQ curves.
I have gone for a drast ic separat ion effect . The drum s now sound m ore separ at ed and crispier, slight ly dirt ier, but louder.
Fig 2 5
And Fig 2 6 shows t he result .
List en t o t his loop (Be a t 1 a ft e r Lin e a r EQ)
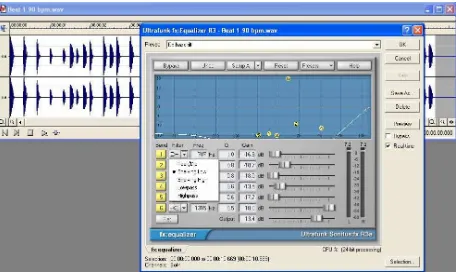
I am using a 10- band Paragrahpic EQ. I need loads of bands so I can have great er cont rol over all t he individual frequency bands. As you can see from t he im age, t he EQ also offers m e all t he usual band shape opt ions.
What am I t rying t o achieve here? I am t rying t o creat e w hat w e call ‘Pseudo St ereo’. Pseudo St ereo usually m eans creat ing a st ereo effect using a filt er or dynam ics. I n t his inst ance, we are using EQ t o creat e a st ereo effect .
Fig 2 7
List en t o t he loop (Be a t 1 1 0 Ba n d Pa r a)
This is quit e an ext rem e exam ple and, as you can hear, it is not perfect ly balanced across t he axis. This is m ore t o do wit h t he way t he loop was const ruct ed wit h t he hi hat s being panned j ust off cent re.
However, I have deliberat ely m ade it ext rem e so you can see all t he band point s and how t hey affect t he audio.
This next exam ple (Fig 2 8) is a t em plat e I have creat ed using a 6 band EQ w it h m ore param et ers for ‘Peak’ and ‘Shelving’.
The param et ers are ext rem e and act ually off t he chart . I can’t even see t he nodes.
Why have I creat ed t his t em plat e? I have creat ed t his for drum layering purposes.
Fig 2 8
Now list en t o t his (Be a t 1 sh e lf ba ss t ilt) , and t ell m e it is not fat as Hell.
This m akes for a great loop t hat can be layered wit h anot her drum loop. The t w o t oget her will m ake a really deep and crisp loop.
You can also do t he exact opposit e, creat ing a beat t hat is rich in m id t o high frequencies, and t hen layer t hat wit h a deeper low- end beat . You can even play your own drum sounds over t he beat and creat e a new beat . I t is endless.
You are only lim it ed by your im aginat ion, and not by t he t ools.
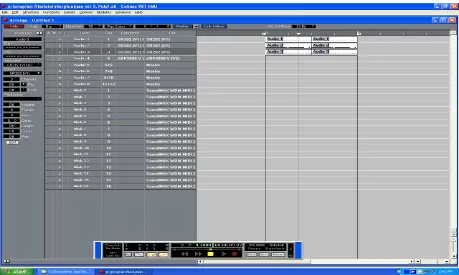
We will now run t hrough an exam ple incorporat ing a drum beat wit h all t he individual com ponent s on separat e t racks in a soft ware sequencer.
Fig 2 9 shows 3 t rack inst ances of audio, recorded in Cubase ( sequencing soft ware) . The t racks are br oken int o t he following drum sounds: snare, kick and hi hat .
Fig 2 9
List en t o t he beat (Th e Be a t EQs)
This is a very sim ple drum beat , and it w ill serve our purpose perfect ly.
I have opened 3 inst ances of EQ, one on each channel.
The EQ unit s t hat I am using are t he st andard default 4 band EQ provided wit h t he soft ware.
I have t reat ed t he snare t o be a lit t le harsh and dirt y, wit h a lot of m id t o t op- end.
The kick has been t reat ed t o m ake it t hum ping and pronounced in t he low t o m id- end.
Fig 3 0
The 4 nodes, one for each band, are clearly evident in t his im age.
This is t he EQ unit used for t he hi hat s. You can see t hat I have boost ed t he m id t o high frequencies in a gent le m anner, but wit h increm ent ing values.
You m ust always be very aware of t he frequency ranges t hat you are boost ing or cut t ing. Keep checking all t he EQ set t ings and m ake sure t here are very few overlaps, if any.
I have deliberat ely used t his t ype of EQ curve for t he hi hat s, because I know t hat I will be t reat ing t he kick wit h m ore em phasis in t he low t o m id- end, and t he snare wit h em phasis in t he m id t o t op- end.
This m et hod affords m e a good frequency spread acr oss t he whole spect rum . I f t here are serious overlaps in t he EQ curves, t hen t he file will suffer.
The only t im e I deliberat ely overlap frequencies is when I am aft er a very specific effect . An exam ple would be boost ing t he m id range of a drum loop so as t o fit t he bass line in it ’s own space.
I n t his inst ance I would overlap t he kick and snare frequencies and boost t he shared frequency range, and t hen lower t he gain so as not t o cause any t onal anom alies like dist ort ion, clipping et c.
Fig 3 1
You can see t he shape of t he EQ is t ailing off t owards t he m id- end.
I have done t his so when t he t w o EQ curves are put t oget her, t hey form an even frequency boost across t he whole frequency range of t he audio file.
This has kept t he current ranges open for t he snare t o explore t he space I hav e reserved for it .
Again, you can always change t he shapes of any of t he EQ unit s.
The whole point of t his exercise t o show you how t o sensibly select EQ param et ers and m ake full use of t he frequency bands available.
Bear in m ind t hat we have t he opt ion t o t urn off any of t he bands in t his exam ple. This allows us t o use t he EQ unit as a one band, all t he way up t o four bands.
Fig 3 2
As you can see, I have shaped quit e a pronounced curve for t he snare EQ.
I have rem oved alm ost all t he low t o m id- end frequencies, and boost ed t he m id t o t op- end frequencies, so as t o accom m odat e t he hi hat frequencies.
Now list en t o how t he finalised file sounds like here (Th e Be a t s w it h se p EQs) .
You can hear t he differences from t he ‘dry’ ( unt reat ed) and t he ‘wet’ ( t reat ed) files. I t is clearly evident t hat t he original beat has undergone t reat m ent .
I have, of course, used ext rem e curves so as t o show you how t o get a good even level across t he whole frequency range of a given file.
To conclude t his sect ion, t ake a look at t he EQ curves of all t hree drum sounds in Fig 3 3, and you will not ice t hat com bined, t hey form a half decent even EQ curve.
Fig 3 3
The t im e has com e for us t o m ove ont o t he m ost confusing and difficult of all sounds t o t reat ,
1 3 . V oice
This is THE area t hat m ost people have t rouble wit h when it com es t o using EQ.
For som e st range reason, even engineers have t o ponder a solut ion t o an EQ problem where t he voice is concerned. Maybe not t hat st range when you t ake int o account t he vast frequency range of t he voice, coupled wit h t he varying fluct uat ions of frequencies over a given lengt h of t im e.
Add t o t hat t he usual problem s encount ered in recording t he voice, like plosives and pops, and you can see t hat half t he t im e engineers are applying Correct ive EQ, as opposed t o Creat ive
EQ.
And if t hat wasn’t enough, singers t hen go and change t he gains across t heir vocals and fluct uat e t he frequencies even furt her by applying vibrat o t o t heir voice whilst singing, and it is now even clearer as t o why t his area of EQ t reat m ent is regarded as t he ‘Holy Grail’.
Conquer t his and you have found enlight enm ent.
Whereas drum sounds are one shot and st at ic, in t erm s of t heir frequency ranges, t he voice encom passes a whole plet hora ( love t hat word) of frequencies and at varying am plit udes over a given period. And it does not end t here, oh no. You need t o t ake int o account t he frequency
A song will invariably have m ore t han one vocal, irrespect ive of t here being only one vocalist . Choruses will ent ail m ore t han one vocalist , or m ore t han one vocal line. I n ot her words, apart from having anot her vocalist singing on t he song, you will have a num ber of vocal lines from one singer, or m ore, t hat w ill go t o form t he chorus or any ot her part of t he song. Add t o t hat t he changes in t he t onal charact er of t he way t he song is sung, and you are faced wit h even m ore variables t o t ake int o account .
Ok, so t he above sounds as if you are going t o go t hrough a living hell when t rying t o EQ vocals but fear not , it is not t hat bleak.
As we have covered earlier, t here are ways t o analyse t he frequency range (spect rum) of any sound, be it an inst rum ent or a voice. The m et hodology is t he sam e.
The spect rum analyser is a great t ool, so use it . But rem em ber, your ears are t he best t ools available.
I oft en enrich t he frequencies around t he vocals and t hen place t he vocals in a cent ral frequency band, sm ack bang in t he m iddle of t he m ix.
This works great for som e Dance based m usic, but not for R&B. I n Dance m usic, I like t he vocals t o st ay rigid in it ’s frequency hom e, and let t he m usic bounce around it .
Wit h R&B, I do t he exact opposit e, as t he vocals are far m ore dynam ic and flowing, so require a far broader frequency range t o m ove in.
We also need t o consider separat ion and layering wit h vocal lines, w hen w e t alk about EQ.
As we discussed earlier, EQ is a great t ool t o use if you need t o separat e inst rum ent s and vocals in a m ix, but w e didn’t really t ouch on using EQ w hen w e layer sounds, specifically vocals.
1 4 . Pr im a r y a n d Se con da r y EQ
a m ix of ot her sounds. Finally, it is easier t o analyse t he frequencies inherent in t he vocal files, if isolat ed.I f you t ry t o perform any of t he above WI THI N a m ix, t hen you w ill not be as successful or as accurat e as adopt ing t he isolat ion t echnique described above.
Once you have clean and dynam ic vocals, t he m ix will build around t hem far m ore accurat ely. By preparing your vocals prior t o any m ixing, you will give yourself t he luxury of easier fault finding and allow yourself t o be m ore creat ive.
Let m e explain what I m ean by fault finding. You will oft en encount er rogue frequencies in your m ix. Som et hing j ust doesn’t sit right . But t rying t o find t he ‘problem ’ could t ake ages and cause you night m ares. I f you KNOW your vocals are good, t hen you can look elsewhere for t he problem . A problem frequency on an inst rum ent sound is alw ays m uch easier t o locat e and fix. A problem frequency w it hin t he vocals could t ake ages t o isolat e and repair.
1 5 . V oice Ex a m ple s – D ou ble Tr a ck in g
I n product ion, we adopt a num ber of t ricks t o enhance and invigorat e t he m ix.
Most not able of t hese is double t racking vocals. This basically m eans t hat we t ake one vocal line, copy it and t hen t reat it , and use it alongside t he original vocal line. The best exam ple of t his, and t he one I am going t o st art t he walk t hrough exam ples wit h, is using m ore t han one copy of a vocal line t o creat e dept h, widt h and harm onies for t he chorus.
Fig 3 4 is a snapshot of one vocal file, im port ed 3 t im es on 3 separat e audio t racks, and t reat ed wit h 3 separat e EQ unit s..
What I have done is t o t hen EQ each one wit h em phasis on t he 3 different frequency bands, low, m id and high.
The file will sound very sim ilar t o t he original file, in fact alm ost ident ical.
List en t o t he original file here (V oca l 1 cle a n) .
List en t o t he processed file here (V oca l 1 . 3 w a y EQ) .
Fig 3 4
Now let us look at what happens if I pan t he 3 files t o select ed posit ions in t he st ereo field (Fig 3 5) , and m ore im port ant ly, list en t o t he t reat ed file.
Fig 3 5
List en t o t he panned file here (V oca l 1 . 3 w a y EQ pa n n e d) .
By panning t he individual files, we are able t o hear t he EQ t reat m ent far bet t er t han having all t he files cent ral.
You can now com pare t he files and it is clear t hat t he files, t hat have undergone EQ and panning, sound wider and t han t he lone original file.
This t echnique is a great way t o widen t hose vocal t racks, and add som e dept h in t he process.
By using t he original unt reat ed file, m aking copies of it and running t he copies alongside t he original, and applying different EQ curves, will afford us huge flexibilit y and variet y.
You can alt er t he EQ curves and creat e furt her t ext ures and pan posit ions.
We can t ake t his a st ep furt her and creat e great effect s for t he vocals in our m ix.
Fig 3 6
List en t o t he file here (V oca l e x t r e m e EQ) .
I have deliberat ely left a frequency anom aly in t his audio file, j ust before t he final vocal line, so t hat we can use a not ch filt er t o rem ove t he rogue frequency (Fig 3 7 a n d Fig 3 8) .
List en t o t he anom aly here (V oca l e x t r e m e EQ a n om a ly) .
Fig 3 7
Fig 3 8 is a zoom ed in version of t he sam e file.
By zoom ing in t ight ly on an area, we can easily det erm ine t he nat ure of t he problem t hat m ight lie in t here. I n t his case w e have found t he anom aly.
As you can see, I am using t he graphic EQ here but have shaped a not ch filt er t o rem ove t he anom aly at t he desired frequency range.
The ears can be your best friends here. By list ening t o t he anom aly, while adj ust ing t he nodes on t he not ch filt er, we can ‘hear’ t he changes we m ake.
I have now m ade t he changes and have rendered t he process.
List en t o t he result here (V oca l e x t r e m e EQ a n om a ly n ot ch e d) .
That is what we call Correct ive EQ.
Any EQ unit t hat allow s you t o have det ailed cont rol over a frequency range can only be a posit ive t ool. To fully ut ilise a not ch filt er, w e need t o be able t o hom e in on any frequency band and have t he abilit y t o rem ove or reduce t he gain of t hat band.
Not ch filt ers are also used for pops, clicks, plosives et c.
Wit h vocals, I never like t o give frequency ranges as I feel t hat t he figures are so arbit rary t hat it would not be a good guide.
You will see graphs and list for vocals ranges, but alm ost all will be neglect ed when it com es t o real st udio sessions.
1 6 . V oice EQ Addit ion a l Ex a m ple s
Here are a few m ore EQ curves for t he t ypes of effect s t hat you hear quit e oft en in com m ercial releases:
Fig 3 9 Th e N a sa l Effe ct
List en t o t he nasal effect (N a sa l e ffe ct) .
Fig 4 0 Soft M id Roll- off
Fig 4 1 W a r m Tot a l Fr e qu e n cy Ra n ge
List en t o warm t ot al frequency range (W a r m Tot a l Fr e que n cy Ra n ge)
Fig 4 2 V e r y Soft Top
List en t o very soft t op (Ve r y Soft Top) .
t he overall curve look m ore nat ural, t he only except ion being t he ‘nasal effect ’. For t his, w e need t o zoom in on a select frequency band, and t reat t hat band, as seen above.
Whenever you creat e an EQ curve, nam e it and save it .
Wit h vocals, t here are cer t ain frequency ranges t hat m ight be wort hwhile t o not e, j ust in case you need t o rely on input t ing values int o an EQ unit , as opposed t o using nodes and ‘drawing’ t he EQ shape.
Bet ween 3.5 kHz – 6 kHz, you will find t he m ain ‘presence’ of t he vocal. Boost ing t his will add m ore t o t he low end of t he vocal line and cut t ing it will place t he sound furt her away and also allow t he sound t o be t hinner.
6.5 kHz – 12 kHz is where t he ‘breat hiness’ and sibilance of t he voice resides. This is t he area t hat can be very useful when it com es t o rem oving anom alies or boost ing t he breat h effect .
14 kHz – 20 kHz is t he range t hat t he crispness of t he vocal resides in. This is t he area t hat needs at t ent ion if you need t o soft en t he delivery of t he vocal, or boost if you need t he m or e pronounced charact erist ics of t he vocal.
The above is only a guide and w ill be different for different voice qualit ies. How ever, it is wort h not ing.
I t hink t hat w ill do as far as vocal is concerned.
1 7 . M ix in g EQ - Gospe l
So, w e have com e t his far and all t hat is left is t o t idy up w it h a couple of exam ples of how t o use EQ in separat ing t racks for m ixing, and using EQ for reshaping cert ain elem ent s of a m ix.
By now , I expect you t o be fam iliar wit h all t hat has been discussed in t his e- book t ut orial. Arm ed wit h t his knowledge you should be in a posit ion of st rengt h, and I expect you t o fully underst and what I am going t o show you in t he following exam ples.
When it com es t o EQ t reat m ent wit hin a m ix, t here are cert ain point ers t hat you m ust t ake on as ‘Gospel’.
1. Boost ing frequencies is not encouraged unless a very specific effect is required.
We covered t he subj ect of phase, anom alies, overlaps, and pret t y m uch everyt hing else associat ed wit h boost ing frequencies.
I f you have t o boost t hen m ake sure it is in sm all am ount s and w it h sensible band select ion.
2. Cut t ing frequencies will dram at ically im prove your t ask of separat ing inst rum ent s and vocals.
Taking away, in t his inst ance, am ount s t o giving.
We have been t hrough t his in det ail. Always t hink ahead and do not get confined by huddling all your frequencies int o a narrow range. Rem em ber t hat t he m ore range you have in your m ix, t he m ore t he dynam ic m ovem ent , space and dept h.
No single sound should dom inat e. I f all frequencies are correct ly t reat ed, t hen t he list ener will enj oy t he m ix m uch m ore, and will find som et hing different in t he t onal cont ent every t im e he/ she list ens t o it .
3. Do N OT EQ t he final m ix. Let t he m ast ering house t ake care of t his as any dynam ic processing is dest ruct ive. Dest ruct ive m eans it cannot be reversed. The m ast ering house will not t hank you if you have squeezed t he dynam ic range of all t he frequencies int o a narrow band, or t ried t o perform t he old, highly m ist aken, t rick of boost ing all t he frequency bands in
5. When using EQ on individual sounds w it hin a m ix, always keep an eye on your levels, especially when boost ing frequencies. Som et im es, t he sm allest EQ boost can t ake your ent ire m ix int o t he ‘clip’ zone ( red) .
Just because it looks good, does not m ean it sounds good.
7. Always st art your EQ t asks wit h sounds t hat occupy ext rem es of frequency. Bass, high st rings, deep kick, hi snares et c. You get t he idea? Once you have sort ed out t he ext rem es, you can t hen st art t o fill up t he space left in bet ween, and once t his is done, you can t hen EQ wit h det ail t o at t ain widt h, dept h and separat ion.
I t is a bit like paint ing. You paint t he background on t he canvas. You t hen add all t he prim ary colours et c. And you finally finish off wit h t he det ail and shades.
8. The voice is always ‘king’ in any m ix, so pay part icular at t ent ion t o t he t onal qualit ies of t he vocal lines, bot h in t erm s of frequencies and levels and also in t erm s of t he way t he vocal lines are sung.
9. ‘Cleanliness is next t o Godliness.’ Keep your sounds clean. I f you need t o use correct ive EQ t o elim inat e anom alies, t hen do so, but do not boost any frequencies.
Working from a clean slat e will give you t he best r esult s. A poorly const ruct ed sound file will play havoc wit h all t he ot her sound files and m ake t he t ask of m ixing a night m are. I t only t akes one bad sound file t o ruin a m ix.
10. I f your sound files are already clean and dynam ically st rong and sit nicely in t he m ix, t hen you m ight find t hat t hey act ually do not need any EQ t reat m ent at all.
No one said ‘You have t o EQ’.
1 9 . M ix in g EQ - Ex a m ple s
Fig 4 3 shows a very basic m ix of drum s, bass and a synt hesizer keyboard hook.
I have kept it sim ple, but used sounds t hat deliberat ely clash wit h each ot her, so t hat you can ident ify w hat I am doing.
Fig 4 3
List en t o t his short m ix (M ix cle a n) .
You can hear t hat t he bass is dom inat ing t he m ix, and I have placed t he hook right in t he m iddle of t he frequency spect rum so as t o m ake m y t ask of applying EQ a lit t le harder because of t he snare and hi hat s. The drum s sound weak and wit h very lit t le spread.
Fig 4 4 shows how I have shaped t he EQ curves so as t o give a broad overall frequency range t o t he whole m ix.
I have m aint ained t he hook’s m id and t op ranges and cut som e of t he low end from it .
I have boost ed a narrow band for t he kick and kept t his space a bit vacant for t he bass t o occupy.
Fig 4 4
List en t o t he final, t reat ed m ix (M ix EQ) .
You can inst ant ly hear t he dept h of t he kick, t he crispness of t he snare, t he bounce of t he bass and t he spread of t he hook. This m ix is far bet t er. I t is balanced, wide and deep and m ost im port ant ly, it has separat ion.
Fig 4 5 is a good exam ple of a bass biased m ix.
This m ix is m eat ier wit h t he bass having dom inance and t he kick being subm issive and less pronounced and hard.
The snare st ands out far m ore and t he hi hat s occupy a nice lit t le niche in t he m id t o t op- end.
Fig 4 5
List en t o t he new bass m ix (M ix w it h ba ss EQ) .
Fig 4 6 is our final exam ple and it shows how t o creat e a snare dom inant m ix, whilst keeping t he kick deep and heavy, t he hi hat s m id t o t op, t he hook spread m ore around t he m id and t he bass j ust lying under t he drum s.
Take a close look at t he EQ shapes.
They are a com binat ion of narrow band and spreads.
What is ve4ry clear here is t hat I am boost ing alm ost all t he sound files, wit h t he except ion of t he bass filer, which I have rolled- off by a large am ount and over a large frequency range. By doing t his I have allowed t he drum sounds t o t ake over t he low t o m id- end, and allowed a far bigger space for t he hook t o feel com fort able in.
You should always st rive t o have fun when m ixing, and one of t he m ost enj oyable t ools we producer s have is t he EQ.
Fig 4 6
1 9 . Fin a l W or d
Well, I hope t hat t his e- book t ut orial has been of help t o you.
I t hink t hat t he m ost im port ant areas have been covered.
EQ is probably t he m ost pot ent and ver sat ile of all t he t ools a producer has at his/ her disposal.
Use it wisely.
Always t hink before you j um p int o t hat ‘boost ’ knob. Be aware of all t he frequencies around t he frequency you want t o alt er.
Cut is always bet t er t han boost , unless a specific t one is required.
Always refer t o t his t ut orial if you get st uck.
The rest is down t o you. Experim ent , underst and and m ost im port ant ly, enj oy t he experience.
Eddie Bazil ( Zukan)
Sam plecraze
ht t p: / / w w w.sam plecraze.com