OBJECT-ORIENTED ANALYSIS OF SATELLITE IMAGES USING ARTIFICIAL
NEURAL NETWORKS FOR POST-EARTHQUAKE BUILDINGS CHANGE DETECTION
N. Khodaverdi zahraeea, H. Rastiveisa*
a School of Surveying and Geospatial Engineering, College of Engineering, University of Tehran, Tehran, Iran -
(niloofar.zahraee, h.rasti)@ut.ac.ir
KEY WORDS: Earthquake, Artificial Neural Network, Object Oriented Image Analysis, Buildings Change Detection
ABSTRACT:
Earthquake is one of the most divesting natural events that threaten human life during history. After the earthquake, having information about the damaged area, the amount and type of damage can be a great help in the relief and reconstruction for disaster managers. It is very important that these measures should be taken immediately after the earthquake because any negligence could be more criminal losses. The purpose of this paper is to propose and implement an automatic approach for mapping destructed buildings after an earthquake using pre- and post-event high resolution satellite images. In the proposed method after preprocessing, segmentation of both images is performed using multi-resolution segmentation technique. Then, the segmentation results are intersected with ArcGIS to obtain equal image objects on both images. After that, appropriate textural features, which make a better difference between changed or unchanged areas, are calculated for all the image objects. Finally, subtracting the extracted textural features from pre- and post-event images, obtained values are applied as an input feature vector in an artificial neural network for classifying the area into two classes of changed and unchanged areas. The proposed method was evaluated using WorldView2 satellite images, acquired before and after the 2010 Haiti earthquake. The reported overall accuracy of 93% proved the ability of the proposed method for post-earthquake buildings change detection.
1. INTRODUCTION
Earthquake is an inevitable destructive event. Every year this natural disaster causes a lot of destruction around the world that most of them are in the populated urban area. Having a destruction map of an area after an earthquake can help to cope with such disasters and reduce their damages. In this case, high-resolution data, such as satellite/aerial imageries and LIDAR are very helpful to prepare a destruction map in an urban area with high speed and high accuracy. Aerial/satellite imagery may be used for extracting the spectral characteristics for an area and are known as one of the main sources for gathering information from earth’s surface (Theau,"Change detection," Handbook, 2011).
There are automatic and visual methods for extracting damage map using satellite/aerial imageries. The visual method is mostly based on the study of manual sampling. This method is time-consuming and requires large-scale manual investigations, manpower, and other resources (Rastiveis, Samadzadegan, et al, 2013). Therefore, in recent years, accurate, fast and efficient automatic methods as pixel-based and object-oriented have been developed and proposed to derive change information from satellite images. For example: Muira et al used texture analysis for detecting damaged areas after the earthquake by using Quick-Bird and WorldView-2 satellite data that have been collected before and after the earthquake in Haiti. This method was able to correctly identify almost 70% of the buildings were destroyed. The method used to detect the destruction caused by the earthquake was a post-classification method. The advantage of this method was reducing radiometric differencing data, but the results were completely dependent on the initial classification (Miura, Yamazaki, & Matsuoka, 2007).
Huyck et al, applied an automatic method based on the edge information by using QuickBird and IKONOS satellite data. This method was based on the assumption that after the earthquake in the collapsed buildings more dissimilarities of edge information are observed in comparison with the intact buildings (Huyck, Cho, Chung, & Eguchi, 2005). Li et al, proposed a method based on a combination of spectral and location information in the detection of collapsed buildings using QuickBird satellite data after the Wenchuan earthquake, China. Combining the results, showed a significant improvement in damage detection compared to other methods that using only spectral information (Li, Xu, Liu, & Guo, 2009). Chini et al proposed an automated method using morphological features to detecting the damages by using QuickBird satellite data (Chini & Stramondo, 2011).
Jin et al used principal component analysis and post-classification vectorize images for change detection. SPOT_5 satellite images that have been collected before and after changes were used in this research. The accuracy of this method was 90.6%. Their technique included an overview of the direction and position changes. However, incorrect classification and complex changes were observed (Jin-Song, et al., 2009).
Wu et al proposed TLSF algorithm with a combination of post-classification and principal component analysis method. IKONOS satellite images, which have been collected before and after the changes, were used in this research. The Accuracy of this method was reported 86.3% (Wu, and Zhang, 2016). Cao et al proposed CRF algorithm with a combination of FCM clustering and Euclidean distance. This method had no need for training data and has a slight noise. SPOT-5 satellite images that have been collected before and after changes were used in this research (Cao, Li, and Zhou, 2016).
Atasever et al proposed DS algorithm based on artificial intelligence. He used principal component analysis algorithm in order to make feature space and DS for feature clustering. SAR satellite images that have been collected before and after the changes were used in this research (Atasever, Kesikoglu, and Ozkan, 2016). Akay et al proposed new approaches to improve the accuracy of training data and use multiple classification Scheme (MCS) based on artificial intelligence for change detection using IKONOS satellite data. This method is more efficient in training samples to detect the changes (Akay, and Sertel, 2016).
In addition to automation, the purpose of this study is mapping changed area with a segment by segment comparison that none of the expressed studies has previously done. So, we used object based segmentation, compare feature’s plot by subtracting pre and post features and ANN for damage detection. More details will be presented in the following section.
2 .METHODOLOGY
The flowchart of the proposed method is summarized in Figure 1. As shown in this figure, satellite imageries from the pre- and post-earthquake are used as input data to obtain a changed map. For this purpose, after preprocessing, image segmentation is performed to generate image objects. Then, the resulted segmentations are intersected to obtain equal image objects on both images. After that, appropriate textural features, which make a better difference between changed or unchanged areas, are extracted for all the image objects. Finally, subtracting the extracted textural features from pre- and post-event images, obtained values are applied as an input feature vector in an artificial neural network for classifying the area into two classes of changed and unchanged areas.
2.1.1 Pre-processing:
The aim of this step is to achieve the same type of measurement at the same geographic location over time by each pixel (lunette 1998). Pre-processing is very important in change detection because false pre-processing can increase errors. In this research, histogram matching is done after geometric correction. Histogram matching is a process where a time series image is modified such that it’s a reference.
Figure1. Flowchart of the proposed method for buildings change detection after an earthquake
2.1.2 Segmentation:
Segmentation is one of the most important steps in object-based change detection. Different techniques have been developed for image segmentation during the last two decades. In this research, the multiresolution segmentation method is applied for segmentation of the pre- and post-event satellite imageries. This algorithm based on region merging segmentation so merged image objects repeatedly until more homogeneity is not possible (eCognition Developer Reference book 2014) Selecting appropriate segmentation parameters such as scale, shape and compactness is the most important step in this process. The Scale determines the maximum allowed heterogeneity for the resulting image objects, shape modifies the relationship between shape and compactness and compactness is used to optimize image objects with regard to compactness.
2.1.3 Segmentation intersection:
As the segmentation of the images may create two different image objects with unequal size and shape, comparison these objects would be difficult. Therefore, segmentation intersection is performed to solve this problem. In other words, both segmentation results are intersected to create the same image objects. For this purpose, two segmentations are overlaid and new polygons are created by the intersection of the input polygon boundaries.
2.1.4 Feature extraction:
Feature extraction has an important role to capture meaningful information from the image objects so can give more precision on classification step. The Purpose of this step is to obtain features that help in the change detection process. In change detection algorithms, an appropriate feature is the one that makes a better difference between change and unchanged area. Spectral and textural information are common features for image classification and change detection. In this study, Haralick textural features are applied for the change detection process. These features can be calculated using grey-level co-occurrence matrix (GLCM). GLCM is a matrix that contains the number of each grey level pairs that are located at distance d and direction θ from each other (Haralick, 1973). In the
Neural network Feature extraction
Change map
High resolution post-event
image High resolution
pre-event image
Pre-processing Pre-processing
Segmentation intersection Segmentation
Feature analysis
proposed method, seven textural features are applied. These features are described below:
GLCM Homogeneity: This feature measures local monotony of pair of pixels. Homogeneity is high if grey value of pixels is similar to each other.
GLCM Contrast: This feature measures local variation between neighbours in the image. Contrast is high when grey value difference between neighbours is high.
GLCM Entropy: This feature measures grey levels distribution
if pixels in image. High entropy represents the heterogeneous texture of the image and low entropy represents a homogeneous texture. The value for entropy is high if the elements of GLCM are distributed equally. It is low if the elements are close to either 0 or 1.
GLCM Ang. 2nd Moment: This feature measures softness. The full steady state value is 1, and where we have the complete lack of uniformity is very close to zero.
GLCM Std. Dev: This feature uses the GLCM, therefore it deals specifically with the combinations of reference and neighbour pixels. Thus, it is not the same as the simple standard deviation of grey levels in the original image.
GLCM dissimilarity: This feature is similar to the contrast but increase linearity. If contrast of area is high, dissimilarity is also high.
GLCM correlation: This feature represents a linear dependence of one pixel’s gray level to neighbor’s gray level.
The formulae of the aforementioned features using GLCM matrix are summarized in Table 1.
Table1. Applied textural features for change detection
Homogeneity
to an unchanged image object, the values of this feature vector will be bigger for the changed image objects.1 1
Artificial Neural Networks are computational methods for data classification. They are applied in many fields such as computer studies, psychology, biology, organic chemistry, etc. Since the late 1980s, artificial neural networks are employed for analysis of remote sensing data in various applications such as classifying land cover, cloud detection, and change detection.(Bakhary, Hao, & Deeks, 2007).
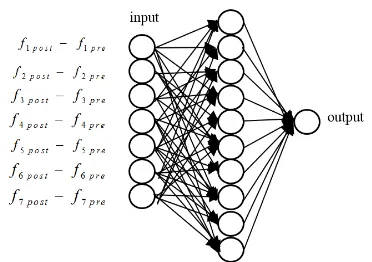
In this study, we used multilayer perceptions (MLP), which is trained through the error backpropagation learning algorithm (Bakhary, Hao, & Deeks, 2007). Typically, an MLP network topology includes of multiple layers of neurons with connections only between neurons in neighboring layers. After learning the network using training data, the calculated feature vector for each image object, which obtained from the previous step, are individually imported into the network and the network will decides about the situation of the image object. Figure 2 shows the structure of the proposed MLP network for change detection.
Figure 2. The structure of the proposed MLP network for buildings change detection
In general, there are three stages in neural network classification for change detection: Firstly, the educational process using input data. Note that, in order to properly train the neural network, training data should be provided for both of the two classes entire the images. So image objects should be collected from all over the image. Secondly, the success of the validation phase that determines the educational phase and health networks. Third, the classification of the classified maps or change map. By performing the algorithm on all image objects, they can be classified into two classes of changed or unchanged. In the following section, the obtained results after testing the algorithm would be presented.
3- STUDY AREA
As can be seen from this figure, many buildings are damaged due to the earthquake.
a
b
Figure 3: Selected area as sample area. a) Pre-event image. b) Post event image.
4. TEST AND EVALUATION:
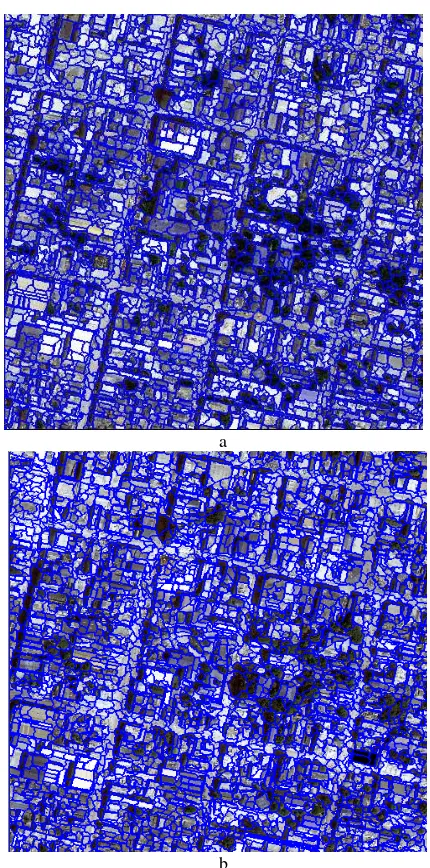
After data pre-processing, segmentation of both images was performed through multi-resolution segmentation algorithm. In this case, shape, scale and compactness are important parameters and, they need to be wisely selected. Inaccuracy in these parameters may cause unexpected segmentation polygons and, consequently, the change detection process will not be reliable. Figure 4(a) and 4(b) demonstrates the obtained segmentation for pre-earthquake and post-earthquake satellite images, respectively. In both images 17, 0.4 and 0.7 for the scale, Shape and compactness parameters were considered. By overlaying these segmentation results new image objects were generated through segmentation intersection step. Figure 5 demonstrates this process for a few number of image objects.
a
b
Figure 4: extracted image objects on pre- and post-earthquake image through multi-resolution segmentation algorithm. a)
Pre-event image b) Post-Pre-event image
Pre
-e
v
en
t
imag
e
P
o
st
-e
v
en
t
imag
e
a b c
Figure 5: Segmentation intersection results of a sample are. a) pre- and post-event sample area. b) Obtained image objects from multiresolution segmentation technique. c) Overlying obtained image objects from segmentation intersection process.
correlation, contrast, Std. Dev, Ang.2nd Moment, dissimilarity features were applied as features. Tables 2-3 show the calculated texture features for four sample image objects from pre- and post-image, respectively.
Table 2. Pre-event feature values for four sample image objects.
Img.Obj. # 53 54 55 56
Correlation 0.61 0.64 0.59 0.36
homogenity 0.34 0.18 0.29 0.08
contrast 0.01 0.01 0.02 0.02
Std.Dev 0.09 0.09 0.14 0.13
2nd Moment 0.02 0.08 0.02 0.25
entropy 0.71 0.42 0.79 0.22
dissimilarity 0.08 0.01 0.10 0.01
Table 3. Post-event feature values for four sample image objects.
Img.Obj. # 53 54 55 56
Correlation 0.75 0.10 0.68 0.05
homogeneity 0.37 0.24 0.44 0.42
contrast 0.00 0.02 0.00 0.01
Std.Dev 0.05 0.10 0.06 0.09
2nd Moment 0.02 0.08 0.04 0.14
entropy 0.70 0.44 0.65 0.33
dissimilarity 0.08 0.02 0.10 0.01
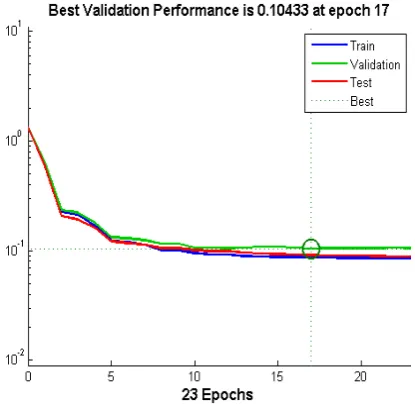
Subtracting the extracted textural features from pre- and post-event images, obtained values are applied as an input feature vector in the designed artificial neural network. In the applied MLP network 10 hidden neurons were considered. Besides, 216 image objects were observed manually as training data to be used for training the network. Figure 6 shows the convergence process of the network.
Figure 6. The convergence process of the NN network.
After training the network all image objects were imported into the network and their situation were assessed. The final obtained change map is demonstrated in Figure 7.
Figure 7. ANN’s output in two classes: Red polygon shows changed area and yellow shows unchanged area.
As seen in Figure 7, red polygons show changed areas and yellow polygons show unchanged areas. ANN’s confusion matrix for this classification is shown in Table 4. As can be seen in Table 3, among 216 manually observed image objects, the proposed algorithm detected 84 correct unchanged image object, 8 false unchanged image object, 42 correct changed image object, 2 false changed image object, and overall accuracy is 92%.
Table 4. ANN’s confusion matrix
Unchange Change Commission error (%)
Unchange 127 7 0.06
Change 10 72 0.12
Omission error (%)
0.07 0.08
5. CONCLUSION
In this paper a new method for mapping destructed buildings after an earthquake using pre- and post-event high resolution satellite imageries were proposed and implemented. By means of multi-resolution method and appropriate selection of parameters including shape, compactness, and scale, the segmentation were done on world-view2 satellite images. Homogeneity, Entropy, correlation, contrast, Std. Dev, Ang.2nd Moment, dissimilarity features were selected among the texture features. Finally, subtracting the extracted textural features of pre- and post-event images, final feature vectors were applied as an input feature vector in an artificial neural network for classifying the area into two classes of changed and unchanged areas. The obtained overall accuracy, 92%, showed the ability of the proposed technique for distinguishing destroyed buildings from intact buildings. Furthermore, segmentation intersection to have the same segments was the main reason for achieving the promising results. Although the results especially in comparison with manually observed image objects were promising, however, further studies need to improve the results.
Akay, S. and E. Sertel, Urban Land Cover/use Change Detection Using High Resolution SPOT 5 and SPOT 6 Images and Urban Atlas Nomenclature. ISPRS-International Archives of the Photogrammetry, Remote Sensing and Spatial Information Sciences, 2016: p. 789-796.
Atasever, U., M. Kesikoglu, and C. Ozkan, a new artificial intelligence optimization method for pca based unsupervised change detection of remote sensing image data. neural network world, 2016. 26(2): p. 141.
Cao, G., X. Li, and L. Zhou, Unsupervised change detection in high spatial resolution remote sensing images based on a conditional random field model. European Journal of Remote Sensing, 2016. 49: p. 225-237.
Chini, M., F. Cinti, and S. Stramondo, "Co-seismic surface effects from very high resolution panchromatic images: the case of the 2005 Kashmir (Pakistan) earthquake," Natural Hazards and Earth System Sciences, vol. 11, pp. 943-931,2011.
Haralick, Robert M., and Karthikeyan Shanmugam. "Textural features for image classification." IEEE Transactions on systems, man, and cybernetics 3.6 (1973): 610-621.
Huyck, C. K. B. J. Adams, S. Cho, H.-C. Chung, and R. T. Eguchi, "Towards rapid citywide damage mapping using neighborhood edge dissimilarities in very high-resolution optical satellite imagery—Application to the 2003Bam ,Iran, earthquake," Earthquake Spectra, vol. 21, pp.266-255, 2005
Jin-Song, D., et al., Urban land use change detection using multisensor satellite images. Pedosphere, 2009. 19(1): p. 96-103.
Li, P. H. Xu, S. Liu, and J. Guo, "Urban building damage detection from very high resolution imagery using one-class SVM and spatial relations," in 2009 IEEE International Geoscience and Remote Sensing Symposium, 2009, pp. V-112-V-114
Miura, H. S. Modorikawa, and S. H. Chen, "Texture Characteristics of High-Resolution Satellite Images In Damaged Areas of the 2010Haiti Earthquake," in 9th International Workshop on Remote Sensing for Disaster Response, USA, 2011.
Theau, J., Change detection, in Springer Handbook of Geographic Information. 2011, Springer. p. 75-94.
Veettil, B., A Comparative study of urban change detection techniques using high spatial resolution images. Proceedings of the 4th GEOBIA, Rio de Janeiro, SP, Brazil, 2012: p. 7-9.
Weber, C. and A. Puissant, Urbanization pressure and modeling of urban growth: example of the Tunis Metropolitan Area. Remote sensing of environment, 2003. 86(3): p. 341-352.
Wu, C., L. Zhang, and L. Zhang, A scene change detection framework for multi-temporal very high resolution remote sensing images. Signal Processing, 2016. 124: p. 184-197.
Samadzadegan, F., M. J. V. Zoj, et al. (2010)."Fusion Of GIS data and high-resolution satellite imagery for Post-earthquake building damage assessment."
Rastiveis, H., F. Samadzadegan, et al. (2013). "A Fuzzy decision making system for building damage Map creation using high resolution satellite imagery." Natural Hazards and Earth System Sciences 13:455.
J. Theau, "Change detection," in Springer Handbook of Geographic Information, ed: Springer, 2011, pp. 75 -94.