DYNAMICAL LAND/FOREST FIRE HAZARD MAPPING OF KALIMANTAN BASED ON SPATIAL AND SATELLITE DATA
(Pemetaan Kebakaran Lahan/Hutan Dinamis Pulau Kalimantan Berdasarkan Data Spasial dan Satelit)
E. S. Adiningsih, B.S. Tejasukmana, M.R. Khomarudin
Center for Remote Sensing Application and Technology Development ± LAPAN ABSTRAK
Sistim deteksi dini merupakan komponen penting dalam pengelolaan kebakaran lahan /hutan. Kalimantan merupakan salah satu daerah yang rawan kebakaran di Indonesia. Pemetaan bencana kebakaran lahan/hutan pada daerah tersebut sangat penting untuk memberikan informasi deteksi dini. Metode untuk pemetaan bencana kebakaran yang bersifat statis telah banyak dilakukan dengan menggunakan Sistim Informasi Geografis. Pemetaan kebakaran lahan hutan dapat dilakukan dengan menggunakan parameter biofisik seperti curah hujan, kondisi vegetasi, penutupan lahan dan jenis lahan. Peta bencana kebakaran lahan/hutan tersebut dapat diperbaharui, karena sebagaian besar parameter diperoleh dari data satelit dan beberapa parameter merupakan hasil prediksi. Tujuan dari penelitian ini adalah untuk membangun model pemetaan bencana kebakaran lahan/hutan untuk Pulau Kalimantan. Data spasial yang digunakan terdiri atas data NOAA-AVHRR, peta penutupan lahan dari Landsat TM, dan peta jenis lahan Hasil penelitian menunjukkan bahwa sumbangan curah hujan dan NDVI terhadap bencana kebakaran lebih besar dari pada penutupan lahan dan jenis lahan dengan bobot berturut-turut 0.35, 0.30, 0.20, and 0.15. Untuk studi kasus periode 1997 ± 2002, sebagian besar hotspot terdapat di daerah dengan kejadian bencana kebarakan hutan yang tinggi.
Kata Kunci : Bahaya kebakaran, Curah hujan, Indeks vegetasi, Penutupan lahan, Peta dinamis. ABSTRACT
Early warning system is an important component in land/forest fire management. Since Kalimantan is one of prone areas to fires in Indonesia, land/forest fire hazard mapping for the area is essential to provide early warning information. Methods on static fire hazard mapping have been established using geographic information system. Land/forest fire hazard mapping could be established based on spatial biophysical parameters such as rainfall, vegetation condition, land cover, and land type. Since most parameters can be derived from satellite data and some of them are predictable, a dynamical land/forest fire hazard maps can be generated. The objective of this research was to construct a model of forest fire hazard mapping for Kalimantan. Spatial data used consisted of spatial rainfall maps, Normalized Difference Vegetation Index (NDVI) maps derived from NOAA-AVHRR data, land cover maps from Landsat TM data, and land type map. The results show that contributions of rainfall and NDVI to fire hazards should be higher than land cover and land type. The weights of NDVI, rainfall, land cover, and land type are 0.35, 0.30, 0.20, and 0.15 respectively. For the case study of 1997 ± 2002 periods, it has been shown that most hotspots are located in areas with forest fire hazard of high level.
INTRODUCTION
Kalimantan in one of main island in Indonesia which is prone to land and forest fires. Early warning system for this island then becomes an important component in land and forest fire management since preventive efforts is relatively cost effective than fire suppression and its damaging impacts. Beside other climate elements, rainfall is one of important factors in determining forest fire hazards in prone areas. Meanwhile, rainfall in Kalimantan has been known to be affected by extreme climate events such as El Nino/La Nina and the Southern Oscillation (ENSO) (Alan et al., 2001; Avia and Hidayati, 2001; Harger, 1995; Sulistya et al., 1998; Winarso dan McBride, 2002).
Beside climate, fuel availability and biomass are other factors determining forest fire hazards. Fuel availability and biomass are related to land use and land cover. Tacconi (2003) suggested that forest fire in many parts of Indonesia was caused by land use and changes. Based on burned areas during 1997/1997 fires in Indonesia it has been found that logged forest are the pronest area to fires in Kalimantan. Second prone areas to fires are swamp and peatland, followed by lowland forest, bush and grassland, plant forest and plantation.
According to Murdiyarso et al. (2002), forest fire hazards are related to accessibility to reach an area and vegetation or fuel types. Highest fire frequency (indicated by hotpot cumulative frequency) was found in areas which could be accessed through secondary roads. They also suggested that although most fires were prescribed, fire spreads were strengthened by prolonged drought or dry weather.
Several methods have been developed to determine forest fire hazards. Anderson et al. (1999) has developed a parameter of Soil Dryness Index (SDI) as an indicator of forest fire hazards. Hidayat (1997) and Junaidi (2001) used vegetation indices (Normalized Difference Vegetation Index
or NDVI) as forest fire hazards indicator. Canadian Forest Department has used Fire Weather Index (FWI) as forest fire hazards indicator (Dimitrakopoulos and Bemmerzouk, 1996). In those previous works fire hazards referred to fuel condition or fuel flammability and fire spread. Nevertheless, those works have not integrated essential biophysical factors in fire hazard determination. Considering the importance of forest fire hazard mapping in Kalimantan, it is necessary to develop a dynamical forest fire hazard mapping quantitatively, so that preventive plans could be established effectively. The role of geographic information system is essential in the work. Therefore, research on combining factors of climate, vegetation condition and land management practices in predicting forest fire hazard is necessary. The objectives of this research are: (1) to establish and test forest fire hazard prediction model for Kalimantan based on rainfall, vegetation indices, land use, and land type; (2) to analyze the effect of ENSO on fire hazard in Kalimantan.
MATERIAL AND METHOD Location and Time
Satellite data collection and processing were accomplished at Centre for Remote Sensing Application and Technology Development, National Institute of Aeronautics and Space (LAPAN), Pekayon ± Pasar Rebo, East Jakarta. Meanwhile field observation was also done in West Kalimantan and Central Kalimantan in 2004.
Material
Data collected from various sources include monthly rainfall from 21 stations in Kalimantan for the period of 1991-2002; monthly NDVI, hotspot location and number of all provinces in Kalimantan for the period of 1996-2002 derived from NOAA-AVHRR satellite data; monthly tropical Pacific sea surface temperature anomaly (SSTA) of Nino 3.4 area, monthly Southern Oscillation Index (SOI), and monthly Dipole Mode Indices (DMI) for the period of 1991-2002 acquired from NOAA website, land use and land type maps of Kalimantan from UNEP (2002). Field data include land use condition, vegetation and fuel condition in West Kalimantan and Central Kalimantan.
This research used a set of PC with Sea Scan software to process NOAA-AVHRR data, Arc View for geographical information processing and mapping, and statistical software for statistical processing and analyses. For field survey we used GPS (Global Positioning Satellite) to determine geographical location and camera for documentation.
Methods
Forest fire hazard analyses are made based on criteria of rainfall, NDVI, land use, and land type were set and weighing method was also applied as seen on Table 1 and Table 2. A weight value is taken into account, then the calculation of parameter score is established as follows:
Parameter score = weight * score
Since there have been several previous works on forest fire factors, scoring method was based on previous related works (expert approach). Total score was obtained by summing all parameter scores. Forest fire hazard classification could be established by dividing total score range into 5 intervals or classes which describe fuel availability and flammability. The five classes of forest fire hazards are very low, low, moderate, high, and very high as seen on Table 3.
Table 1. Criteria and intervals of monthly NDVI and rainfall, land use and land type and their scores to determine forest fire hazard in Kalimantan.
Score/Parameter Monthly NDVI (1)
Monthly Rainfall (mm) (2)
Land use Type
(3) Land type (4)
Score = 1 > 0.55 > 250 Settlement Dry
Score = 2 0.46 - 0.55 200 - 250 Paddy Field -
Score = 3 0.36 - 0.45 151 - 200 Cropland -
Score = 4 0.26 - 0.35 101 - 150 Plantation -
Score = 5 0.16 - 0.25 51 - 100 Forest -
Score = 6 0.06 - 0.15 0 - 50 Swamp, Bush Peat
Note: 1) Based on Hidayat (1997), Junaidi (2001) and NDVI analyses for the period of 1996-2002, 2)Based on criteria of wet and dry months according to Schmidt and Fergusson, isohyet analyses and hotspot distribution maps of Kalimantan in 1996-2002, 3) Based on Tacconi (2003), Murdiyarso et al. (2002), hotspot frequency analyses according to land use type in Kalimantan for the period of 1996-2002, 4) Based on hotspot frequency analyses according to land type in Kalimantan for the period of 1996-2002.
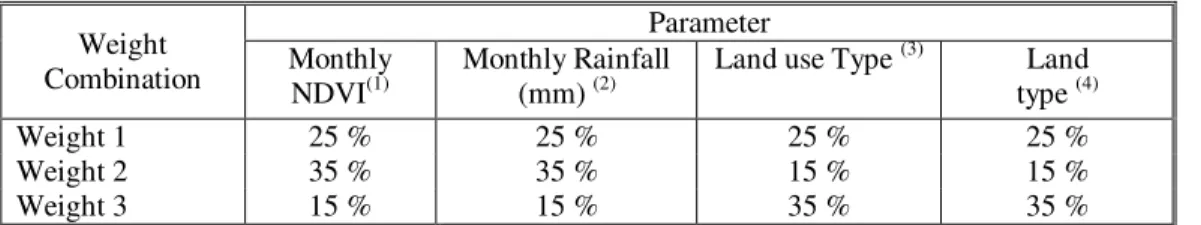
Four combinations of factor scores are applied and analyzed to determine the most appropriate combination of weights for the factors. Analyses on each combination are done by
computing total hotspot frequency of each fire hazard level and the results for all combinations were compared. Some assumptions are made to justify each combination. For combination 1 it was assumed that the contributions of all factors to fire hazards are the same. For combination 2 it is assumed that NDVI and rainfall were dominant factors. On contrary, for combination 3 it is assumed that land use and land types were dominant factors. The three combinations and their weights are presented in Table 2.
Table 2. The weight of each factor applied in the study
Weight Combination Parameter Monthly NDVI(1) Monthly Rainfall (mm) (2)
Land use Type (3) Land type (4)
Weight 1 25 % 25 % 25 % 25 %
Weight 2 35 % 35 % 15 % 15 %
Weight 3 15 % 15 % 35 % 35 %
Interpretation
After giving scores and weights, fire hazards are then classified based on total scores. Forest and land fire hazards were divided into five levels into very low, low, moderate, high, and very high according to the vulnerability of an area to fires. Each level is then described as follows: Table 3. Description of land and forest fire hazard level
Fire Hazard Level Total Scores Description
Very low < 2.00 Available fuels are very difficult to burn and/or spread Low 2.00 ± 2.99 Available fuels are difficult to burn and/or spread Moderate 3.00 ± 3.99 Available fuels are rather easy to burn and/or spread High 4.00 ± 4.99 Available fuels are easy to burn and/or spread Very high > 5.00 Available fuels are very easy to burn and/or spread
Total score can be computed by the sum of all factor scores. As an example, the total score of an area with NDVI of 0.3, rainfall of 175 mm, cropland over peat land for weight combination 1 will be ((0.25*4)+(0.25*3)+(0.25*3)+(0.25*6) or 4 and classified into high fire hazard, and so on.
After score computation and fire hazard classification accomplished, the results were processed using Geographic Information System (GIS) and Arc View software to provide fire hazard maps and their predictions. Maps were made for the following periods: strong El Nino and strong positive Dipole Mode Event (DME) in 1997, strong La Nina and strong negative DME in 1998, normal in 2000, weak El Nino and weak positive DME in 2002. Since the highest frequency of hotspot in Kalimantan occurred in September, sample maps were made for September.
Further analyses of fire hazard maps were made for the whole island in certain years with pronounced hotspot frequencies during 1996-2003. The optimum combination of weight factors were determined by computing hotspot frequency over fire hazard maps to obtained total number of hotspots over fire hazard levels. The results were then compared.
After optimum combination of weight factor was obtained, similar maps were also made for prediction of 2001. The maps of observed data were compared with predicted data. Predictions were made for monthly NDVI and rainfall. However, predictions for land use and land type were not made since their changes were relatively slow. The predictions of NDVI and rainfall were based on model obtained by previous study using Southern Oscillation Index (SOI), Sea Surface Temperature Anomaly (SSTA) of Nino 3.4 area and DMI as predictors (Adiningsih et al., 2003). The model provides predictions of NDVI and rainfall for time lags of 1 to 6 months with adequate accuracy.
RESULT AND DISCUSSION
Based on analyses of hotspot number identified for each land use type, the most pronounced hotspot number in the two provinces occurs in September. Sample maps of fire hazards of Kalimantan were therefore made based on observation data for September 1997 (strong El Nino), 1998 (La Nina), 2000 (normal), and 2002 (weak El Nino) using weighing method 1, 2, 3 as described in previous section. During strong ENSO, as indicated in August 1997, most Kalimantan has very high forest hazard, but during La Nina, as indicated in 1998, most areas are in lowest forest fire hazard. However, land/forest fire hazards during low-moderate ENSO in 2002 were higher than in 1997. During normal year, as indicated in 2000, most Kalimantan were in moderate land/forest fire hazard.
Analyses and comparison on fire risk maps of Kalimantan were accomplished by calculating hotspot numbers over fire risk levels or classes. Total number of hotspots in West Kalimantan reached maximum for moderate fire risk level using the three methods. Hotspot number of this level was the highest among levels of fire hazards. Accordingly hotspot number in Central Kalimantan reached maximum for moderate level using all methods. However, the highest number of hotspot identified for very high risk level was reached by the results of method 3. The results imply that method 3 was relatively appropriate to map fire hazards in Kalimantan.
Since weighing method 3 is the most appropriate one, mapping of fire hazards was made using this method. Maps of fire risk for Kalimantan are presented in Figure 1. From this figure we can see that forest fire hazards are categorized into moderate to high during El Nino year, especially along east coast of the island. During La Nina year forest fire risk is lower than El Nino year. However, during La Nina year forest fire risk along coastal areas is almost high. During normal year fire risk relatively varies among the areas, but most of Riau has moderate to high fire hazards. Unlikely, during weak El Nino year forest fire hazards are lower than other years. This was caused by weakening effect of sea surface slight warming at eastern Indian Ocean on El Nino effect.
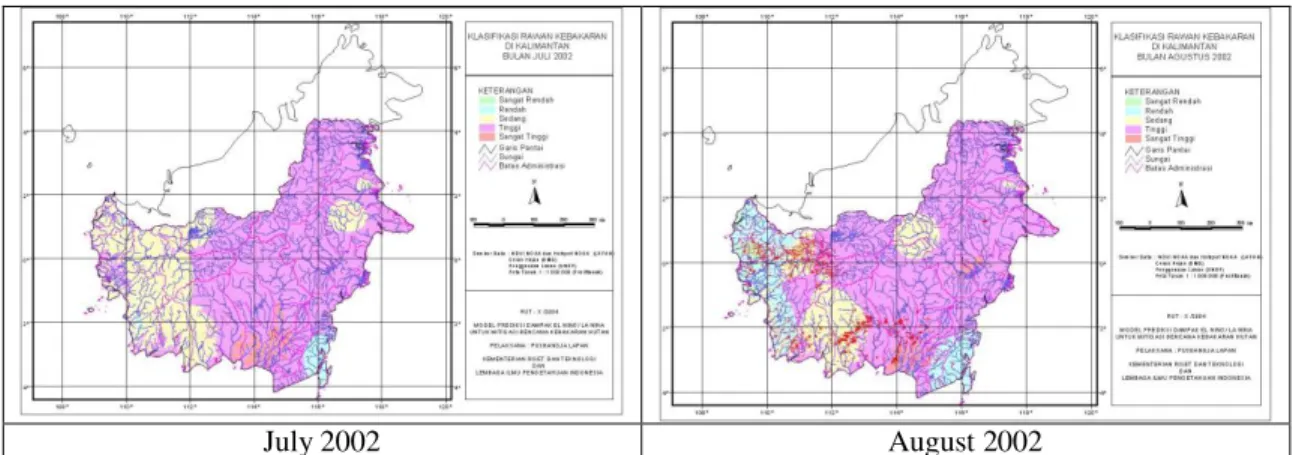
Predicted forest fire hazards in Kalimantan in July 2002 is almost the same as actual forest fire risk, but predicted fire risk map for August 2002 indicates areas having high actual fire risk predicted to be moderate fire risk. The maps of predicted land/forest fire hazard are presented in Figure 2. It is shown that prediction of land/forest fire hazard in Kalimantan tends to generate lower hazard than observation. This is due to lower response of rainfall and NDVI in Kalimantan to ENSO parameter. However, calculation of fire risk areas for all classes was done both for predicted data and observed data. The results reveal that ENSO parameters can predict fire risk accurately for moderate risk, but overestimate for low risk, high risk and very high risk.
July 1997 August 1997
July 1998 August 1998
July 2002 August 2002
Figure 1. Land/Forest Fire Hazard Maps of Kalimantan in Dry Seasons of 1997, 1998, 2000, and 2002 Based on Weighing Method 3.
Prediction for July 2002 Prediction for August 2002
Figure 2. Predicted Land/Forest Fire Hazard Maps of Kalimantan in Dry Seasons of 2002 Based on ENSO Parameters and Weighing Method 3.
CONCLUSION
ENSO has impact on land/forest fire hazard over most Kalimantan areas. Analyses on three weighing methods indicate that the contributions of rainfall and NDVI to fire hazards are higher than land use and land type. Hotspots were concentrated in areas with moderate to high fire risk levels. For the case of Kalimantan, ENSO parameters can predict fire risk accurately for moderate risk, but overestimate for low risk, high risk and very high risk.
ACKNOWLEDGEMENT
We would like to thank RUT-X for the funding of this research. We also thank our colleagues in RUT Team Work, Dr. P.A. Winarso, Z.L. Dupe and A. Buono for their contribution in this research, and Avivah and Mushthofa for their help in data processing.
REFERENCES
Anderson IP, Imanda ID, Muhnandar. 1999. Vegetation Fires in Sumatera, Indonesia: A First Look At Vegetation Indices and Soil Dryness Indices In Relation To Fire Occurence. Balai Inventarisasi dan Perpetaan Hutan Wilayah II dan Kanwil Kehutanan dan Perkebunan. Palembang.
Avia LQ, Hidayati R. 2001. Dampak Peristiwa ENSO terhadap Anomali Curah hujan di wilayah Indonesia selama periode 1890-1989. Majalah Lapan. 3 (2): 62-68.
Dimitrakopoulos, A.P. and A.M. Bemmerzouk. 1996. Evaluation of the Canadian Forest Fire Danger Rating System in the Mediterranean-type Environment of Greece. Proceedings of International Symposium on Applied Agrometeorology and Agroclimatology, Volos, Greece, 24-26 April 1996.
Fuller, M. 1995. Forest Fires: An introduction to Wildland Fire Behaviour, Management, Firefighting, and Prevention. John Wiley & Sons, Inc. Toronto.
Hair, Joseph F. Jr., Rolph E. Anderson, Ronald L. Tatham. 1995. Multivariate Data Analysis. 5th
ed. Macmillan Publishing Company. New York.
Harger, J.R.E. 1995. ENSO variations and drought occurrence in Indonesia and the Philippines. Atmospheric Environment, 29 (16): 1943-1955.
Hidayat A. 1997. Membangun sistem pemantauan kekeringan vegetasi untuk peringatan dini kebakaran hutan menggunakan data penginderaan jauh. Laporan Riset. Riset Unggulan terpadu III Bidang Teknologi Perlindungan Lingkungan (th.1995 ±1997). Dewan Riset Nasional Kantor Meteri Negara Riset dan Teknologi
Junaidi. 2001. Hubungan Indeks Vegetasi dengan Kadar Air pada Lahan Terbakar di Jambi. Tesis sarjana. Departemen Geofisika dan Meteorologi, FMIPA, Institut Pertanian Bogor.
Johnson, RA dan Wichern DW. 1998. Applied Multivariate Statistical Analysis. 4th edition. Prentice ± Hall International Inc.
Murdiyarso, D, Widodo M. and Suyamto, D. 2002. Fire risks in forest carbon project in Indonesia. J. Science in China 5, 65-74.
Murtugudde R, McCreary JP, and Busalacchi AC. 2000. Oceanic processes assosiated with anomalous events in the indian ocean with relevance to 1997-1998. J. Geophys. Res., 105: 3295-3305
Saji NH, Goswani BN, Vinayachandran PN, Yamagata T. 1999. A Dipole Mode In The Tropical Indian Ocean. Nature 401: 360-363.
Sulistya W, YS Swarinoto, A Zakir, H Riyanto and B Ridwan. 1998. The Impact of El Nino 1997/1998 Over Indonesia Region. Bulletin of Meteorology and Geophys. 4:40-51.
Tacconi, L. 2003. Fires in Indonesia: Causes, costs and policy implications. Occasional Paper No. 38. Center for International Forestry Research, Bogor.
Vinayachandran PN, Iizuka S, Yamagata T. 2001. Indian Ocean Dipole Mode Events in an Ocean general Circulation Model ( in press)
Webster PJ. Andrew WM, Loschnigg JP, and Lebon RR. 2000. Coupled ocean atmosphere dynamics in the Indian Ocean during 1997-1998. Nature, 40: 356-360.
Winarso PA dan McBride J. 2002. Iklim. Dalam 3DUWULGJH ,- GDQ 0D¶VKXP 0 HGLWRU Kapan Hujan Turun? Dampak Osilasi Selatan dan El Nino di Indonesia. Queensland: Department of Primary Industries. Hal. 1-11.

![Metode Pembelajaran untuk AUD [Compatibility Mode]](data:image/gif;base64,R0lGODlhAQABAIAAAP///wAAACH5BAEAAAAALAAAAAABAAEAAAICRAEAOw==)