[Type text] Page 1
Potential Co-benefits of Community Based Solid Waste
Management
(CBSWM) in Yogyakarta
1R W D Pramono & Leksono P Subanu
This paper is aimed to present the identified co-benefits of the growing practice of CommunityBased Solid Waste Management (hereinafter, CBSWM) in Yogyakarta. Based on field survey and technical simulation, this research argues that CBSWM, particularly those promoting 3R (reduce, reuse, recycle) is a promising approach to reduce effectively as well as efficiently the amount of waste to be processed by waste processing systems and thus contribute to efforts to reduce the impacts of urban waste on global warming, especially since many urban dwellers in the less developed countries still dispose of their trash in unsustainable ways.
Some potential benefits of CBSWM are generally due to less use of unrenewable energy for transporting and processing waste, and also due to economic potential of reuse and recycle activities at the community level. When integrated with social-cultural characteristics of communities and governmental policy, hypothetically CBSWM can lead to wide environmental and economic benefits.
Potential Co- Benefits of Solid Waste Management
Solid waste management (SWM) has been acknowledged as one of the global warming factor (GWF; CO2-eq. tonne–1 waste) and is becoming an important area of sustainable development studies (Gentil et al, 2009). Zeng et al (2010) pointed out that the process of solid waste management potentially contributes about 3.6% of total annual world GHGs emission.
The integrated practice of reduce, reuse and recycle (3R) has been widely recognised as sustainable practice (Sinha & Amin 1995; Ackerman 2005; Kofoworola 2007). Recycling saves space for final dumping as well as energy. It may also save up to 95% of energy to produce aluminum from recyling. This kind of recycling practice also reduces air pollution from inceneration (Salvato, 1992). Composting as another practice of 3R is observed to reduce up to 50 % of Degradable Organic Carbon (DOC), which is a parameter compound CH4 emission (IGES,2006). In addition, processing recycled wastewater treatment with an aerobic digester system (Thermopilic) can reduce CH4 emissions, amounting to as much as 95.896 tonnes of CO2 per year (Ministry of Environment Japan, 2007). Reduction of
[Type text] Page 2
dumped waste due to 3 R potentially reduces community health risk (Berry and Bove 1958-1971).
Economically the 3R approach can also intoduce improvementsthe local economy, as exemplified by the Manila Linis Ganda program, in Manila, the Philipines where1500scavengers are organised to recover 4000 tons of recyclable waste per month, equivalent to a personal income of USD 5-20 pe rday (Martin Medina, 2000).
Presenting the benefits of community based solid waste management as practiced in the city of Yogyakarta and its environments, this paper suggests that such practice have a lot of contribution to mitigating climate change through community actions.
Research Framework
Although the practice of CBSWM in Indonesia is definitely getting more popular there is currently scant knowledge about the ways and rates by which co-benefits come about. There is need to understand those processes by documenting, measuring, and analyzing cases of communities which have various types of CBSWM by way of self-initiation, replication, programmed diffusion or other means.
This research compares cases of communities that practice CBSWM in the greater area of the city of Yogyakarta and tries to address these questions:
1. What types of initiativeshave emerged and spread from the urban communities to cope with solid waste problems in their surrounding and urban environment?
2. What benefits come up from their initiatives?
The research uses a comparative case study approach. Various benefits, variable and unitary system are constructed based on inductive observations on the practice of CBSWM, which are selected as cases. The calculation of benefits is approached through simulation using Life Cycle Analysis (LCA, see Yi, Sora et all 2011, Pan & Kraines 2001). Research covers a number of cases to represent CBSWM types existing in Yogyakarta, in particular those that have adopted CBSWM relatively rapidly through a diffusion2process.
Life cycle Analysis (LCA) of Yogyakarta Municipal Solid Waste
Life cycle Analysis of Yogyakarta Municipal Solid Waste is done through collecting secondary data and primary survey. The secondary data collected include solid waste volume generated in the area, proportion of those based on sources, proportion of those based on treatment by communities, and those transported to final disposal. Data collected from the primary survey include unit of CBSWM growing in the area and estimated
[Type text] Page 3
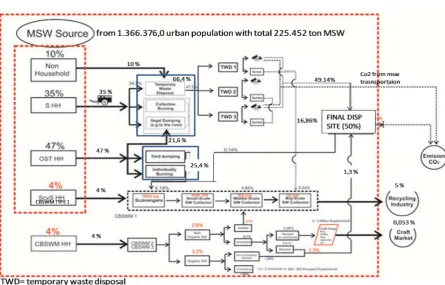
participating community, and the volume of solid waste as well as the way of community in the CBSWM treating those. All information collected then is organized logically as shown by figure 1
Figure 1 is a scheme explaining the process of waste management. Based on the observation, there are two main sources of waste, household (90 percent) and non-household (10 percent). In term of waste processing, non-household waste can be categorized into:
1. MS- HH = Municipality Serviced - Household. Waste from this household is transported by government to the final disposal.
2. ST- HH = Onsite Serviced – Household. Each family manages their own waste in their houses by burning or burying it.
3. ScvS – HH (CBSWM type 1) = Scavenger- Household. The waste of this household is collected by scavengers. The scavengers will sort the waste and sell the recyclable ones to the recycling industry.
[Type text] Page 5
Reseacrh Findings: CO benefits of CBSWM
The scheme draws life cycle of Yogyakarta municipal solid waste can be a model to produce benefits from CBSWM initiatives. In this paper, benefits are computed by simulating 3 scenarios:
1) Scenario 1, situation without the existence of CBSWM
2) Scenario 2, the existing situation with current growth of CBSWM
3) Scenario 3, situation in which significant growth of CBSWM is promoted by the government.
Those three scenarios are simulated to project the differences of CO2 emission from waste in Yogyakarta. The projection is based on the characteristic of the city development from 2003 to 2014 including the growth and the spread of the city population, the average of waste production per capita, the growth of CBSWM and the pattern of waste transportation and disposal by both the community of the government.
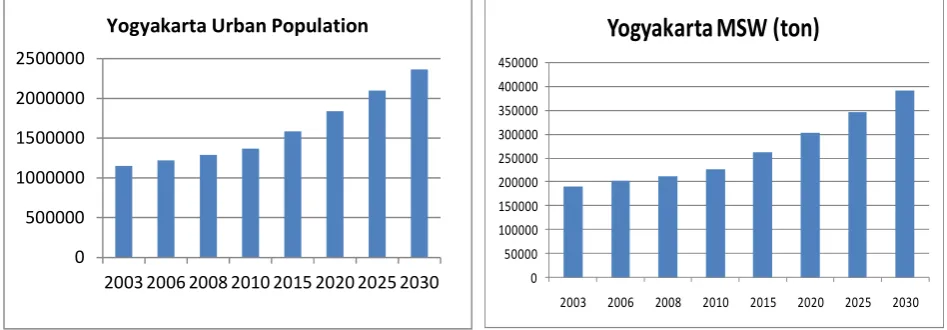
Based on the study of the study of urban agglomeration (Bappeda DIY, 2014), the growth of annual population growth from 2003 to 2030 is estimated between 2.4% to 3%. With that rate, Yogyakarta population which is 136,6376 in 2010 will be 236,2079 in 2030. Based on the survey that per person produces approximately 0.165 ton per year, the production of waste in 2030 will be up to 389,743.08 from about 225,452.04 in 2010. The average solid waste production by houshold in its characteristic is developed based on Abqary (2006), Sidik, U.,S. (2010), Iswanto (2010), Minister of Public Work Act,No. 21/PRT/M/2006 and Ministry of Public Work (2011).
Figure 2. the growth of Yogyakarta urban population and Produced solid waste
2003 2006 2008 2010 2015 2020 2025 2030 Yogyakarta Urban Population
[Type text] Page 6
The simulation of CO2 production is conducted using three scenarios. Those three scenarios are used to examine the significance of CBSWM in reducing the burden of waste treatment and the negative impacts of waste to greenhouse effects. Among those three, scenario 2 is the closest to the real condition of waste treatment in Yogyakarta. Scenario 2 is the projection created based on the secondary data from 2003 to 2010 and the primary survey in 2010. In scenario 2 the growth of CBSWM is analyzed based on data survey up to 2010 as seen in the figure and map below.
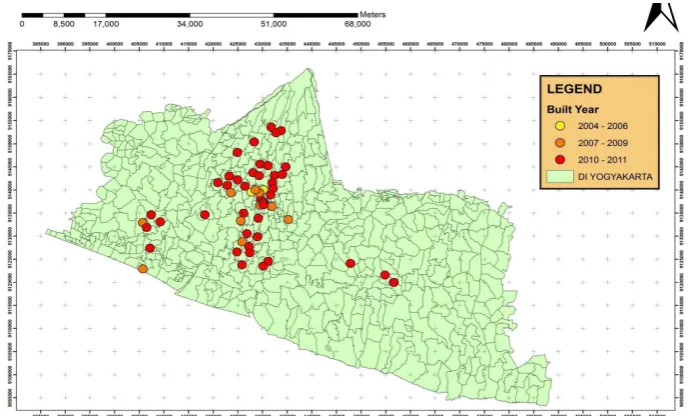
Figure 3: The establishment of CBSWM in Yogyakarta (developed based on Iswanto, 2010)
Figure 4. Spatial distribution of CBSWM in Yogyakarta Province (developed based on Sekber Kartomantul, 2010 & Environment Agency of Yogyakarta Province (2009))
[Type text] Page 7
that the government promotes the growth of CBSWM and other programs so that the growth of CBSWM is higher than the current trend as seen in scenario 2.
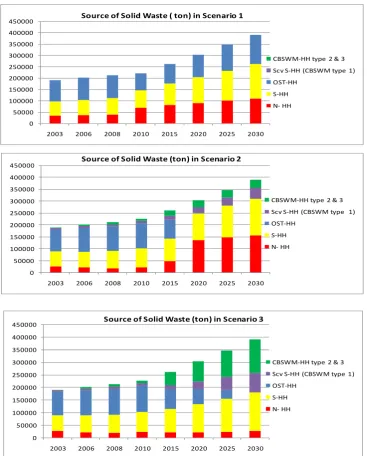
With the same population growth and the same waste production, the difference of source of waste distribution can be seen in figure 5.
Figure 5. Source of MSW based on household typology in 3 scenerios
0
2003 2006 2008 2010 2015 2020 2025 2030 Source of Solid Waste ( ton) in Scenario 1
CBSWM-HH type 2 & 3 Scv S-HH (CBSWM type 1) OST-HH
2003 2006 2008 2010 2015 2020 2025 2030 Source of Solid Waste (ton) in Scenario 2
CBSWM-HH type 2 & 3 Scv S-HH (CBSWM type 1)
2003 2006 2008 2010 2015 2020 2025 2030 Source of Solid Waste (ton) in Scenario 3
CBSWM-HH type 2 & 3 Scv S-HH (CBSWM type 1) OST-HH
[Type text] Page 8
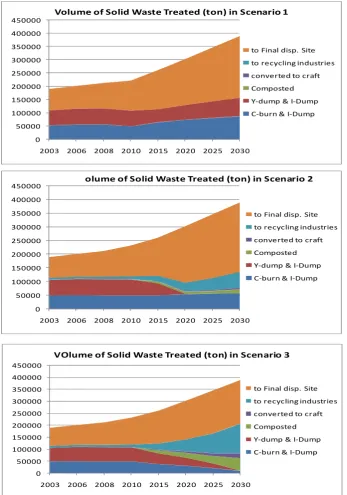
Those three figures show that greater volume of waste is managed by households serviced by scavengers (CBSWM type 1) or participating in CBSWM type 2 and 3. This proportion shift will result in different urban waste treatment pattern as can be seen in figure 6 below:
Figure 6. the patern of MSW treatmntbased on household typology in 3 scenerios 0
2003 2006 2008 2010 2015 2020 2025 2030
Volume of Solid Waste Treated (ton) in Scenario 1
to Final disp. Site
2003 2006 2008 2010 2015 2020 2025 2030
olume of Solid Waste Treated (ton) in Scenario 2
to Final disp. Site
2003 2006 2008 2010 2015 2020 2025 2030
VOlume of Solid Waste Treated (ton) in Scenario 3
[Type text] Page 9
There are at least two outstanding points shown in figure 6; the reduction of waste taken to final disposal site, the increase of waste volume sent to recycling industry- approximately 36.35 ton per year in scenario 1 and 39.60 ton per year in scenario 3. The three scenarios also show the role of CBSWM in changing the habit of yard dumping, ilegal dumping, and colletive burning which in scenario 1 contribute more CO2-producing-waste about 45.4 ton per year. In scenario 2, more people (9% ) are involved in CBSWM and it will reduce the volume of waste in yard dumping, ilegal dumping, and colletive burning by 6.83 ton per year. The growth rate of CBSWM in scenario 2 is about 7 % per year. If it is pushed to 13 % per year as in scenario 3 the population involve in CBSWM will be 34%, the average reduction of solid waste dumped can reach 22.1 ton per year.
CO2 reduction as the benefits of CBSWM is calculated using model simulation. It is the function of Methane (CH4) and Carbon dioxide (CO2) emitted by the solid waste volume dumped at the open area (including at city’s final disposal), the function of burned solid waste, and the function of energy consumed for waste transportation. Especially to calculate CH4, the IPPC formula follows can be used.:
Table 1: CO2 Calculated Formulation
Source: Sang-Arun et al, 2011
MSWT = Total MSW generated by population (Mt/yr)
MSWF = Fraction of MSw disposed to solid waste disposal sites (≤1)
MCF = varies from0.4 for unmanaged shallow land fill; (<5 m) to 1toa managed landfill. For the case study of Yogyakarta Municipal, MCF(Methane Correction Factor)is 1 because the landfill has been managed well.
DOC = A factor which can decompose organic carbon(≤ 1),0.15forfood; 0.17 for garden, park and organic non food waste; 0.3forwoodandagriculturalwaste; 0.4forpaperandtextiles. DOC (Degradable Organic Carbon)for
Yogyakartais0.17according to the results of field surveys, because most garbage in Yogyakarta Municipal still organic waste and mostly from the foliage.
DOCF = Fraction of DOC dissimulated (0,5)
F = Fraction of methane in landfill (0,5)
R = Recovered methane (Mt/yr)
OX = Oxidation factor (0)
[Type text] Page 10
The amount of fuel emission is obtained by assuming that one garbage truck can transport 6tons of waste. Therefore in a year, 18,823 trucks are needed to transport waste (2010). The number should be multiplied by the distance they take in one day. Based on mapping program, a truck will take 97.4 km for each travel. Totally they take 1,833,390.39 km per year and spend 316,101.79 liters of diesel fuel.
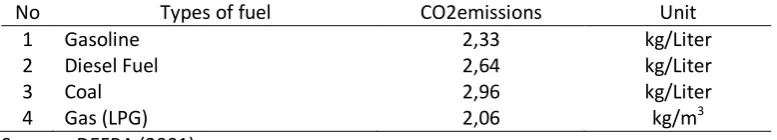
Based on these data, here is the emission of CO2calculated using standard of DEFRA: Table 4.5CO2emissionsproducedbyseveraltypes of fuel
No Types of fuel CO2emissions Unit
1 Gasoline 2,33 kg/Liter
2 Diesel Fuel 2,64 kg/Liter
3 Coal 2,96 kg/Liter
4 Gas (LPG) 2,06 kg/m3
Source : DEFRA (2001)
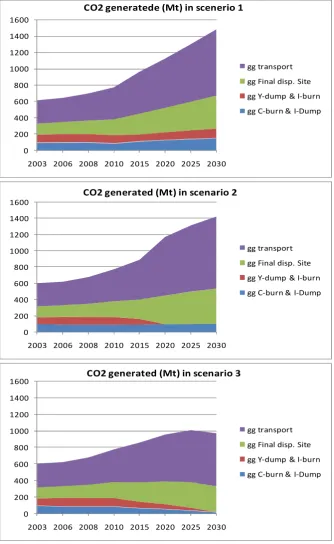
Using the data from projection result and calculating using the above formulas, the CO2 production in Yogyakarta as a result of waste treatment pattern can be predicted as shown in figure 7.
Simulation in scenario 1 (without scavengers and CBSWM) shows that waste from the Serviced HH is the most dominant up to 2030, meaning that the residents of Yogyakarta will strongly depend on the government to manage their waste. CO2 emission will keep on increasing as contributed by waste transportation. While scenario 2, (with curent growth of scavengers, household involved in CBSWM about 7 % , more transportation service to final dumping site) will reduce the illegal dumping as much as 11 % per year, but it will still increase the open dumping in final disposal site as much as 20% per year. Like scenario 1, CO2 emission from garbage trucks will keep on increasing. In scenario 3, encouraged growth of scavengers and CBSWM will maximize the role of scavengers and CBSWM and reduce the volume of waste sent to final disposal. Therefore it will reduce transporting, too. With the growth of people involved in CBSWM as of 13,3 % per year, it is projected that by 2030 the population of Yogyakarta would reach about 2,3 millions and if this scenario applies, there would be 34 % of population who would implement this concept.
[Type text] Page 11
Figure 7. The approximation of CO2 emission from 3 scenarios.
0
2003 2006 2008 2010 2015 2020 2025 2030 CO2 generatede (Mt) in scenerio 1
gg transport
2003 2006 2008 2010 2015 2020 2025 2030 CO2 generated (Mt) in scenario 2
gg transport
2003 2006 2008 2010 2015 2020 2025 2030 CO2 generated (Mt) in scenario 3
[Type text] Page 12
Other Benefits of CBSWM
Besides CO2 reduction that can contribute to the reduction of world’s GHG, the existence of CBSWM can give economic, health, as well as social benefits particularly enjoyed by local community.
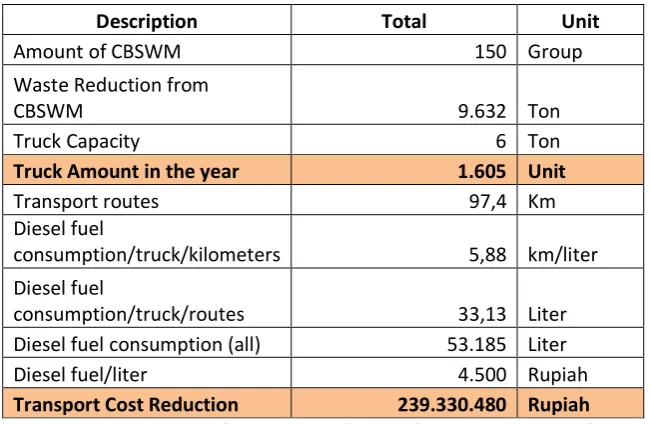
Economic benefits of CBSWM come from several paths. First is due to reduction of SW to be transported and dumped at final disposal site. Regarding this, economic benefit includes reduction of transport cost, and management cost at final disposal site such as land rent reduction for final disposal site, and cleaning cost for the site (see table 4.6).
Table 2 Waste Reduction Unit Conversion to Transport (Garbage Truck) year 2010
Description Total Unit
Amount of CBSWM 150 Group
Waste Reduction from
CBSWM 9.632 Ton
Truck Capacity 6 Ton
Truck Amount in the year 1.605 Unit
Transport routes 97,4 Km
Diesel fuel
consumption/truck/kilometers 5,88 km/liter Diesel fuel
consumption/truck/routes 33,13 Liter
Diesel fuel consumption (all) 53.185 Liter
Diesel fuel/liter 4.500 Rupiah
Transport Cost Reduction 239.330.480 Rupiah
Source: primary survey and interview with Yogyakarta Environmental Agency
The second economic benefit of CBSWM is the practice of Reuse and Recycle in
CBSWM. From about 150 units CBSWM in 2010 for instance, the economic value reuse and recycle product is about IDR 3.143.263.200, mostly from handicraft production using plastic solid waste as raw materials.
The growth of CBSWM represents the growth of unit of clean communities. Through the practice of CBSWM, this community is free from SW burning and opens dumping. Generally they also initiate greenery at their environment. Although there has no direct evidence yet of the correlation, dengue fever, one of SW related-health problem, in the research area tend to decrease in line with the growth of CBSWM.
[Type text] Page 13
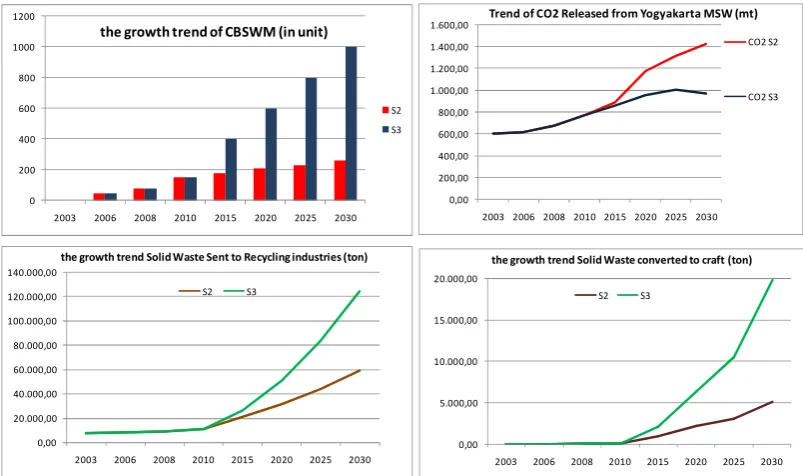
Enviroment Tourism Centre. To resume the important potentiaco-benefits from CBSWM growth in Yogyakarta solid waste management is shown by following graphs (figure 8).
Figure 8. The Important Potential Co-benefits of CBSWM in Yogyakarta
References:
Abqary, Q.,HF, 2006, Measuring of Household Consumption, Balairung Journal, 39th edition/XX/2006.
Ackerman. Frank, 2005, Material Flows for a Sustainable City Special Feature on the Environmentally Sustainable City in International Review for Environmental Strategies Vol. 5, No. 2, pp. 499 - 510, by IGES
Bappeda DIY, 2014, Laporan Study Perencanaan Kebijakan Pengembangan Permukiman di Kawasan PerkotaanYogyakarta
Berry, M. & Bove, F., Birth Weight Reduction Associated with Residence near a Hazardous Waste Landfill, Environmental Health Perspectives, Volume 105, Number 8, August 1997
DEFRA (2001). In National Scrapie Plan for Great Britain. Schemes Brochure, pp. 1–28. London: Department for Environment, Food and Rural Affairs
Environment Agency of Yogyakarta Province (2009), Community Based Solid Waste Management (Pengelolaan Sampah Mandiri)
Environment Agency of Yogyakarta Province, 2011, Environment Status Data of Yogyakarta Province in 2010.
2003 2006 2008 2010 2015 2020 2025 2030
Trend of CO2 Released from Yogyakarta MSW (mt)
CO2 S2
2003 2006 2008 2010 2015 2020 2025 2030
the growth trend of CBSWM (in unit)
S2
2003 2006 2008 2010 2015 2020 2025 2030
the growth trend Solid Waste Sent to Recycling industries (ton)
S2 S3
2003 2006 2008 2010 2015 2020 2025 2030
the growth trend Solid Waste converted to craft (ton)
[Type text] Page 14
Environment Agency of Yogyakarta Province, 2004, Mapping Report of of Illegal Dumping in Yogyakarta Rivers, 2004.
Environment Agency of Yogyakarta City, 2008, Monthly Solid Waste Volume Report in Yogyakarta City 2008.
Gentil, Emmanuel, Julie Clavreul and Thomas H. Christensen (2009). Global warming factor of municipal solid waste management in Europe, Waste Manag Res 2009 27: 850 originally published online 6 October 2009.
Inazumi, Sinya, Hirayosu Ohtsu, Tomoki Shiaotani, and Takeshi Katsumi (2011),
Enviromental assesment and accounting for the waste disposal stream in Bangkok, Thailand, J Mater Cycles Waste Management Journal (pp 139-149)
Indonesia Act No. 18 year 2008, Solid Waste Management
Indonesia Act No. 32 year 2009, Environmental Control and Management
Iswanto, 2010, Community Initiatives In Solid Waste Reduction, Sukunan Village, Sleman, Yogyakarta, Indonesia., Green Cities International Conference, Putrajaya, Malaysia, March 2010
Sekber Kartamantul (Joint Secretary of Yogyakarta, Sleman and Bantul), 2010, Report of Networking Activities in Infrastructure and Facilities among Yogyakarta, Sleman and Bantul.
Medina, Martin, 2000, Scavenger Cooperatives in Asia and Latin America, Resources, Conservation and Recycling, 2000 - Elsevier
Meidiana, C., and Gamse, T., 2010, Development of Waste Management Practices in Indonesia, European Journal of Scientific Research, ISSN 1450-216X Vol.40 No.2 (2010), pp.199-210 © EuroJournals Publishing, Inc. 2010
Ministry of Environment Japan, 2007, Containers and Packaging Recycling Law Ministry of Environment, 2008, Statistic of Solid Waste in Indonesia.
Minister of Public Work Act,No. 21/PRT/M/2006, National Policy and Strategy for Developing Solid Waste Management System.
Ministry of Public Work, 2011, Solid Waste for Dissemination and Socialization.
Kit, Stranger (2002). Overview of waste management options: their efficacy and acceptability, Enviromental and Health Impact of Solid Waste Management Activities (pp: 8)
Kofoworola, O.F. 2007, Recovery and recycling Practices in municipal solid waste
management in Lagos, Nigeria, Waste Management 27 (2007) 1139–1143. Elsevier Pan, Xiaoming and Kraines, Steven (2001). Enviromental Input-Output Models for Life –
Cycle Analysis, Enviromental and Resources Economics Journal (pp. 61-72)
Sang-Arun et al, 2011, Practical Guide for Improved Organic Waste Management: Claimate Benefits through 3Rs in Developing Asian Country, IGES
[Type text] Page 15
Sidik, U.,S., 2010, Implementation of SMM in Indonesia Perspective, MSW Management, Ministry of the Environment Indonesia.
Sinha. M, & Amin. A, 1995 Dhaka's waste recycling economy: Focus on informal sector labour groups and industrial districts, Regional Development Dialogue
Thanh, Nguyen Phuc and Matsui, Yasuhiro (2011). An evaluation of alternative household solid waste treatment practices using life cycle inventory assessment mode,
Environment Monitoring Assessment Journal
Tchobanoglous, G., Theisen, H., and Eliassen, R., 1993, Solid Wastes: Engineering Principles and Management Issues, McGraw-Hill Kogakusha, LTD: Tokyo.
Williams, Paul T (2002). Emissions form solid waste management activitie, Enviromental and Health Impact of Solid Waste Management Activities , (pp: 147-149)
Yi, Sora; H, Kiyo; Kurishu, and Hanaki, Keisuke (2011). Life cycle impact assesment and interpretation of municipal solid waste management scenarios based on the midpoint and endpoint approache, International J Life Cycle Assesment Journal (pp: 652-668)