Whatever the weather…
Making climate information user friendly
for humanitarian organizations
Ca
se
S
tu
dy
Summary
The Asia Pacific zone covers 45 countries and experiences 79% of the world’s disaster related fatalities. Increasing climate risk threatens hard-earned development gains. A strategy for dealing with this is to better understand and pre-empt climate related hazards through systematic use of climate information available for early warning. This can occur on timescales of hours, days, weeks, months and even years ahead of time. Yet, early warning is not a technology, it is part of a system that relies on a chain of actors and responses. Challenges currently abound for practitioners trying to apply climate information. Increased interaction between end users such as humanitarians and information providers is required to ensure more user friendly, needs driven climate information so that ultimately lives can be saved and injuries can be limited.
Introduction
Asia and Pacific are among the most disaster prone areas in the world and are affected by virtually every conceivable natural disaster. While geo-physical disasters such as volcanoes, earthquakes and related tsunami tend to inflict the highest economic tolls, hydro-meteorological
1. World Disasters Report 2009, Table 3 of Annex 1 | 2. IPCC 2007 Working group 2, Asia chapter, Page 473 | 3. IPCC 2007 Working group 2, Asia chapter
disasters such as floods, drought and tropical cyclones occur most frequently. Between 1999 and 2009, the Asia Pacific accounted for 85% of the total number of people impacted by disasters and 79% of all fatalities1. There is
encouraging evidence that regional disaster risk reduction initiatives have reaped positive benefits over the past decade, including measurable decreases in loss of life due to weather and climate-related disasters. However, efforts to reduce disaster risk are yet to fully keep pace with changing dynamics that contribute to rapidly increasing vulnerability within the region.
On average, the number of people affected by disasters has remained steady, but the economic impacts of these events have continued to rise. This is in part due to the increasing number of extreme weather events that have been experienced in the region in recent decades2. This
2 | International Federation of Red Cross Society and Red Crescent Society (IFRC)
A useful strategy to cope with and adapt to the impacts of climate change is to increase the ability to anticipate and prepare for changing climate risks – not only in the coming decades, but also in the next days, weeks, months, and years. To be able to do this, it is important for humanitarian actors to have access to up-to-date climate related hazards information. This case study will present the Red Cross and Red Crescent efforts to work with climate information to cope with the adverse impacts of climate change and it will set forth potential improvements in the formats and usage of this data for the Asia Pacific.
Strategies for addressing increasing
climate risks
The Red Cross Red Crescent has recognized that one of the key methods for coping with and adapting to increasing climate risk is utilizing ‘Early Warning, Early Action’ (EWEA) strategies. Such strategies use available information before a humanitarian emergency occurs, with the goal of systematically triggering action to improve preparedness and response. In the shortest time period that could be evacuations, in the longest time period early action means working closely with communities to assess and address the root causes of the changing risks they face.
Not only can action be taken at different stages based on available information with different lead times, action can also be taken at various levels. This includes community level preparedness (see Box 4), national contingency planning based on scenarios, as well as mobilizing human and financial resources ahead of a disaster. Recent and on-going advances in climate prediction technologies present an opportunity to enhance Early Warning, Early Action to better reduce risks related to climate change.
In support of Early Warning, Early Action, a number of high-level regional initiatives such as the Asian Ministerial Conference on Disaster Risk Reduction and global agreements, have acknowledged the value of and need for improvements in cutting edge technologies and science-based information to better inform disaster risk reduction strategies. However, there is still a challenge in ensuring that the information provided can be easily understood and applied by decision-makers. The majority of currently available climate information is technical in nature, posing an obstacle to practitioners who must translate this into practical activities. Therefore, the problem of improving climate information use is not simply a matter of lack of technological tools.
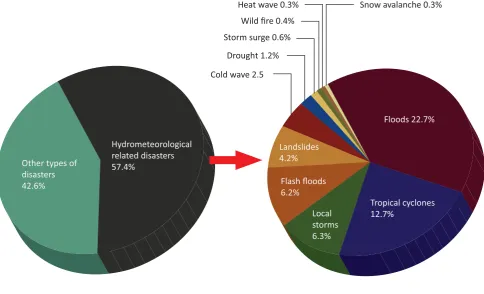
Types of Hydro-meteorological related disasters recorded in Asia Pacific from 2004-June 2010 Figure 1: Hydro-meteorological related disasters
made up 57.40% of disasters recorded in Asia Pacific from 2004-2010.
Heat wave 0.3% Snow avalanche 0.3%
Hydrometeorological
Climate information needs in Asia
Pacific
The disaster management unit within the IFRC’s Asia Pacific zone office has been exploring the information requirements of disaster managers to enable them to stay abreast of the multitude of climate hazards that frequently impact the region such as floods, drought and typhoons. There is a wish to also develop a systematic framework that supports disaster managers in their monitoring of changes in hazard risks and provide an overview of increasing or decreasing risks throughout the region at key milestone points within a year.
In some regions of the world seasonal climate influences can be predicted based on sea surface temperatures. This means that in these locations, seasonal forecasts are likely to be high confidence on a regular basis. For example, across large areas of Indonesia, 93% of drought events in the past 100+ years have been linked with El Niño, which indicates a higher likelihood of dry conditions (see Box 3
below for further explanation of El Niño and La Niña). While this is beneficial for effective preparedness planning across Indonesia, not all parts of Asia Pacific have such regular predictability of hazards based on seasonal forecasts.
With these challenges in mind, the IRI has been working to develop a “predictability” map as part of the collaboration with the IFRC. Such a resource will help disaster managers to understand where contingency plans based on seasonal forecasts might be most relevant. Furthermore it assists in deciding where to invest time and resources to sensitizing staff members and building capacity to utilize climate information. Knowing which places inherently have better predictability can also help to reduce skepticism and frustration among users.
4 | International Federation of Red Cross Society and Red Crescent Society (IFRC)
hazards might impact the region also need to be considered to ensure an accurate understanding of the multitude of vulnerabilities faced by at-risk communities.
From a disaster manager’s perspective a ‘one stop shop’ can make it simpler to compare available forecasts to baseline information. From a climate science perspective, the challenges of combining all of the available information are immense. In light of the difficulties of managing large amounts of information related to climate and disaster impacts, the Red Cross and Red Crescent is exploring collaborative projects with design schools, to explore effective ways of conveying large amounts of information in digestible formats.
Utilizing the maze of information that
is available
During the systematic evaluation of climate information products available, it became evident that climate risks require the team to use multiple “layers” of climate information. This starts at broad time and geographic scales, and gets more refined at each layer (see Figure 2, starting with ‘layer 1’).
According to Michael Annear, head of the IFRC’s Asia Pacific disaster management unit, “this process of analysis prompted the disaster management unit to systematically develop a better understanding of the information that is available, which was very useful”.
Starting with historical information that serves as a “baseline” layer, information on what is usually expected at certain times of the year can be ascertained. Such baselines enable a disaster manager to better assess the implications of various forecasts, which become more accurate at
shorter time periods and for smaller geographical areas. Following the initial analysis undertaken at milestone points within a year, a disaster manager can then determine the need for increasingly specific forecasts, in part, by the level of risk identified at each stage.
Thus, a disaster manager can follow up on the initial El Niño or La Niña forecast to get more specific information as high-risk seasons approach. Because the majority of forecasting at shorter time scales takes place at the national level, it can be time-consuming to monitor on a constant basis
In
d
o
n
e
s
ia
n
R
e
d
C
ro
s
s
(
P
M
MOSTLY REGIONAL
Layer 2: Annual El Nino & La Nina forecast
Layer 1: Baseline with general data on how much rain a given area usually receives at various mes of the year, average number
of cyclones, and typical impacts of El Nino & La Nina
Layer 4: Real me based on historic data (updated periodically to consider changing baseline due to climate change) Layer 3: Forecast for coming season on
cyclones, rainfall,floods and droughts
Figure 2: A framework for monitoring climate hazards: Disaster managers can strategically navigate through “layers” of climate information, of growing specificity, using baseline information on what usually occurs where, and seasonal El Niño and La Niña forecasts as a filter to identify and monitor increasing risks in more specific locations.
across a broad spectrum of countries, as is necessary in the Asia Pacific region. Therefore, regional seasonal forecasts can be used to help disaster managers “hone in” on priority areas that are more likely to experience abnormal conditions over the upcoming season. Vulnerability due to other factors is analyzed separately, but taken into consideration during decision making.
From this process, the understanding of climate trends within a wider disaster preparedness framework can assist a disaster manager in deciding if there is a need to initiate region-wide preparedness activities, such as replenishing stocks, mobilizing staff, and conducting refresher trainings. While concerns with less certain forecasts have been touched on above, they can also signal the need for heightened monitoring of updates and weather forecasts at shorter time periods (i.e. weekly or monthly) in high-risk areas, or upcoming ‘hotspots’. Within this process, it is important to communicate an honest description of forecasts and climate information based on likelihoods, not certainty. Nevertheless, taking into consideration the inherent concerns with the reliability of climate forecasts, there are many actions that can be taken regardless of whether a particular event occurs or not, and in some cases there are heightened levels of risk that warrant precautionary action.
The challenges to translating early
warning into early action
In order to identify the specific climate information needs which disaster managers can utilize within a wider disaster preparedness framework, hypothetical scenarios in India and Philippines were studied. Walking through the layers of climate information in a structured way, it was possible to identify the various challenges to successfully translating early warnings currently available (via climate information) into early action that can result in improved disaster preparedness and overall risk reduction…
6 | International Federation of Red Cross Society and Red Crescent Society (IFRC)
...there is SO much information!
Although it is more convenient for practical purposes to group available climate information resources together according to various categories such as location, scale and forecast lead time (i.e. the amount of time between the prediction and the forecast period), in application it becomes clear that various forecast products do not fit together neatly. Forecasts that might be lumped into the “seasonal” category are still issued by different agencies, at varying lead-times, for different high-risk seasons, and on different geographic scales. For example, one agency may produce regional cyclone activity forecasts once a year, while another agency may produce more frequent cyclone activity forecasts every three months, but with different geographical coverage. Thus, it is often difficult to systematically monitor in a way that ensures complete temporal or geographic coverage.
In some instances, gaps in forecast information can be successfully filled by monitoring multiple forecast products; however, this also implies the need for the disaster manager to dedicate more time to monitoring and sifting through information, and there can be challenges in deciding which resources to use. For example, there are over 20 tropical cyclone forecasting and monitoring resources within the Asia Pacific region. A key component of the monitoring framework is to help to discern which forecasts are most relevant, depending on the type of actions that can be taken before and during a disaster.
There are also gaps in existing climate information that cannot readily be filled through more extensive monitoring of various forecasts. For example, while there is a seasonal cyclone activity forecast for the northwestern
Pacific region, there is no seasonal tropical cyclone activity forecast for the eastern Indian Ocean and Bay of Bengal. Increased interaction with climate scientists can help to drive research that may eventually help to fill such gaps.
...the formats of available climate information
are challenging
Even when there are climate information resources available across time scales, there can still be difficulty in applying the information they provide. When using multiple forecasts, formatting is often inconsistent, which can make it challenging to compare products. Without a consistent and structured framework, interpreting various sources of information can be time-consuming, since many useful forecasts are located on different websites and can be difficult to find. In order to coherently assess the level of risk, it was necessary for users to move back and forth between online resources. It was noted that this inefficiency could be somewhat alleviated by printing out hard copies of maps, for easier and more direct comparison, but many maps are not available in easily printable formats. “Most forecast resources available online are not easy to print which is an essential element for planning disaster preparedness and response in IFRC”, said one IFRC disaster management unit member. Additionally, the team noted that even though the framework helped to hone in on key resources, most were not designed for use by practitioners.
...there is contradicting information
without having to analyze and scrutinize which specific underlying data is used for the different forecasts.
...there is still a lack of evidence that it works
Currently, one of the largest challenges to the use of climate information is a lack of concrete data to show how it might be beneficial – both in economic terms and
in reductions in loss of human life – so that appropriate funding and institutional arrangements can be made to enable early humanitarian action based on forecasts.
Conclusions
Technology for technology’s sake is not enough to save lives. New development of climate information needs to be informed by the practitioner world, through improved understanding, communication and reaching out by information providers to those that need to act upon the information. To enable this bridge to be built, more creative ways of synthesizing and presenting available information needs to occur. The underpinning factor when developing climate forecasting products, is to see how will this work make a difference to reducing death and injury – how will it reach the most vulnerable that all too often end up in statistics?
There are a multitude of climate information resources available in the Asia Pacific region, but there is no single tool that is comprehensive enough to support early warning for all hazards and all locations. Therefore it is necessary for a disaster manager to strategically combine multiple forecasts to assess future climate risks and take proactive steps to minimize loss of livelihoods and lives. Without guidance regarding which forecasts to use in combination, however, the amount of climate information can be completely overwhelming for Red Cross and Red Crescent
C
a
m
b
o
d
ia
n
R
e
d
C
ro
s
International Federation of
Red Cross and Red Crescent Societies Asia Pacific Zone Office Red Cross / Red Crescent
Climate Centre
8 | International Federation of Red Cross Society and Red Crescent Society
staff. Information is available from so many sources in so many formats – there is a great need for coordination and harmonization of climate information between providers with the needs of end users in mind.
To help Red Cross Red Crescent staff utilize climate information in a more systematic way, the IFRC disaster management unit, with the support of the Red Cross Red Crescent Climate Centre and the IRI, is working to develop further the framework for monitoring climate hazards, which will provide a basic structure to guide disaster managers through the many layers of climate information. While this is a useful first step, the process of designing this framework highlighted that much of the available information does not come together cleanly and that gaps still remain. The development of new forecasting tools is not the only way to make climate information
more useful; it is also valuable to consider more creative ways of packaging and communicating existing climate information. This could include innovative approaches, such as enhanced collaboration with information design specialists, who can help to efficiently convey layers of information in easily comprehensible formats.
High level technical information needs to be coupled with community-based application where climate information should be developed with the core aim of reaching the most vulnerable and making a difference. Of course, even with ideal climate information there is still much that needs to be done to make a difference on the ground, including triggers for action. Involving organizations that can take information to the final mile is essential if we are to stay ahead of increasing climate risk.