CHAPTER III
RESEARCH METHOD
A. Research Design
This research was an experimental research. In this research, there were two variables that had correlation each other. The variables were the effect of Stop and Dare Strategy as independent variable and students’ writing skill as dependent variable. Variable was an object of study that became important point in research.
According to Gay (2000: 367-368), the experimental research was the only type of research that can test hypotheses to establish cause-and effect relationship. And consist of two classes, which were experimental class and control class. In this research, the experimental class was taught by Stop and Dare Strategy and the control class was taught by Conventional Strategy (Three Phase Strategy).
Besides, the two classes were taught by different writing strategy but both of classes taught by researcher with the same topic and the same length of time. After deciding which classes were experimental and control, the researcher continue with the treatment process. The treatment was given to experimental class about six meetings and also six meetings in control class. Every meeting the researcher gave different topics. At the end of treatment, the researcher gave the students post-test to see effect of the treatment towards students’ writing skill.
Finally, at the end of the research, the researcher compare the mean score students’ writing of experimental class and control class to prove whether or not students who were taught of Stop and Dare strategy had better writing skill in analytical exposition than who were not at Senior High School 16 Padang
Table 3.1
The Research Design of This Research
Group Independent Variable Dependent Variable
E X 0
C --- 0
E : Experimental Class C : Control Class
X : Treatment (teaching through Stop and Dare Strategy) 0 : Post test for Experimental Group and Control Group B. Population and Sample
1. Population
Gay (2012:122) states that population was a group of interest to the researcher, the group to which she or he would like the result of the study to be generalized. In this research, the population of this research was eleventhgrade students of Senior High School 16 Padang. Total number of the population is 104 consist of three classes (XI IPA1, XI IPA2, XI IPA3)
Table 3.2
The Total Students of Senior High School 16 Padang
No Cl ass T ot al
1 X I I P A 1 3 5
2 X I I P A 2 3 5
3 X I I P A 3 3 4
2. Sample
According to Gay (2012:134) a sample is a group of individuals, items, or events that represents the characteristic of the larger group from which the sample is drawn. Then, process of selecting a number of individuals for a study in such a way that the individuals represent the larger group from which they were selected is called Sampling.
Researcher used cluster random sampling. Gay (2012:144) says that cluster random sampling is sampling in which group, not individual are randomly selected.
To get the representative sample of this research the researcher did these steps:
a. Collected students’ daily writing score from all of students at eleventh grades. (see appendix 1)
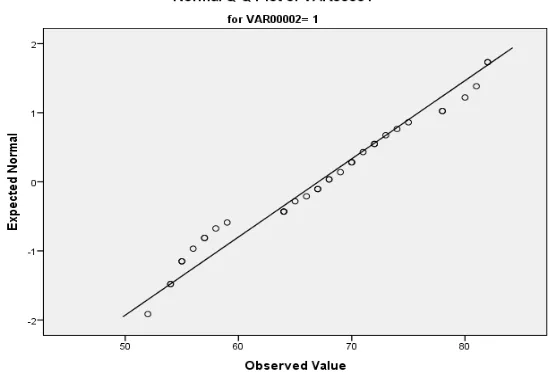
Table 3.3
Test of Normality Population
Tests of Normality
VAR00002 Kolmogorov-Smirnova Shapiro-Wilk
Statistic Df Sig. Statistic df Sig.
VAR00001
XI IPA1 .105 35 .200* .953 35 .144
XI IPA2 .140 35 .079 .942 35 .066
XI IPA3 .173 34 .012 .878 34 .001
*. This is a lower bound of the true significance. a. Lilliefors Significance Correction
Based on the table, can be seen that the significance or probability score just two classes (IPA1 and IPA2) bigger than 0.05 in both Kolmogorov-Smirnov and Shapiro-Wilk.
c. After did the normality test, researcher analyzed the homogeneous variation test. This test has an objective as to know whether the sample homogeny or not. The researcher did the test of homogeneity by usingTest of Homogeneity of Variance. Population has homogeny variance if P-value is bigger than 0.05. See the table below:
Table 3.4
Test of Homogeneity Population
Test of Homogeneity of Variance
Levene Statistic df1 df2 Sig.
VAR00001
Based on Mean 2.428 2 101 .093
Based on Median 1.206 2 101 .304
Based on Median and with
adjusted df 1.206 2 93.314 .304
Based on trimmed mean 2.212 2 101 .115
The decision of columntest of homogeneity of varianceshown that p-value 0.001 is smaller than 0.05, so it can be concluded that all the class were homogeneity.
Table 3.5 Sample of Research
No Class Number of Student
1 XI IPA 1 (Experimental Class) 35
2 XI IPA 2 (Control Class) 35
Total Sample 70
C. Variable and Data
There are three variables in this research: 1. Independent Variable
In this research, the independent variable was Stop and Dare Strategy that was given to students in experimental class.
2. Dependent Variable
The indication which appeared from treatment was result of students’ writing aspects that was gotten from test that was given at the end of research.
3. Control Variable, variable which was kept same teacher, syllabus, curriculum, subject, and same material of subject.
D. Place and Time of the Research
This research conducted in Senior High School 16, Padang of academic year 2017/2018.
E. Instrument of the Research
application of Stop and Dare Strategy in writing, because through using the test researcher known students’ score by mastering all component in writing. The researcher used Jacob's criteria (1981:90) in scoring the students' writing product assessed based on five component that are; content, organization, vocabulary, language use, and mechanics.
F. Procedures of Doing Research
1. Preparation
a. Setting a schedule of the research b. Determining the population and sample
c. Preparing the lessons plan arranged by curriculum or syllabus for six meetings to experimental and control class
d. Preparing research instrument 2. Application Step
Researcher gave treatment by using Stop and Dare Strategy in Experimental class. The scenario of learning for experimental class and control class can be seen as follows:
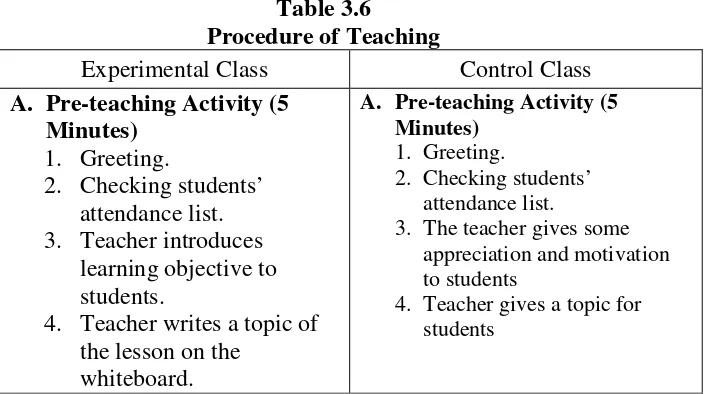
Table 3.6
Procedure of Teaching
Experimental Class Control Class
A. Pre-teaching Activity (5 Minutes)
4. Teacher writes a topic of the lesson on the
whiteboard.
A. Pre-teaching Activity (5 Minutes)
1. Greeting.
2. Checking students’ attendance list.
3. The teacher gives some appreciation and motivation to students
B. Whilst-teaching Activity
1. Exploration
Building Knowledge of the Field (BKOF) (10 Minutes)
a) The teacher introduces the topic based on the syllabus.
b) The teacher gives some questions based on the topic to build students’ background
a) Generic structure of the text
b) The purpose of the text c) Language features of
the text
Teacher also explain about each step of strategy Join Construction of the Text (JCOT) (20 Minutes) a) Guided the students to use Suspend Judgment b) Ask students to Take a Side with place (+) at the top on one box c) Ask students to
Organize Ideas with place a star
d) Plan More as Your Write
B. Whilst-teaching Activity 1. Exploration (25 Minutes)
a) Teacher gives a topic for students
b) Teacher guides students to brainstorm the topic of material
c) Teacher uses kind of learning approach, learning media and other sources
d) Guides the interaction between students and students, students and teacher, students and the other sources
e) Teacher explain about analytical exposition (generic structure, purpose and language feature of the text) f) Ask the students to make
a simple text about analytical exposition
2. Elaboration (25 minutes)
In elaboration activity, students should be:
a) Students make their own text
b) Uses the language feature of analytical exposition in write a text such as present tense, sentence connector, etc
3. Confirmation (15 Minutes)
c) Gives confirmation about the result of exploration and elaboration to students through many sources d) Student write/read their
e) Leads students to Develop Topic Sentence
f) Add Supporting Ideas g) Reject one of
Arguments
h) End with Conclusion Independent
Construction of Text (ICOT) (15 Minutes)
a) Let the students make their own text
independently
3. Confirmation (10 Minutes)
a) Student read their writing in front of the class
b) gives them correction for their essay
class
e) gives them correction for their essay
C. Post-teaching Activity (5 Minutes)
1. Teacher gives the opportunity for the students to ask their difficulties.
2. Teacher concludes the lesson.
3. Teacher closes the lesson.
D. Post-teaching Activity (10 Minutes)
4. Teacher gives the
opportunity for the students to ask their difficulties. 5. Teacher concludes the
lesson.
6. Teacher closes the lesson.
4. Final Phase
a. Giving test (post-test) to experimental and control class b. Processing data
c. Taking conclusion from Strategy of data collection G. Technique of Data Collection
1. Test
six meetings. And the material was taught is a kind of the monologue text (Analytical Exposition text) by using Stop and Dare Strategy in experimental class and conventional Strategy. In this section, the researcher prepares an instructional design for each meeting.
At the end of this research, the researcher gave the post-test to students in experimental and control class. Post-test was the process of giving the test after giving the treatment. It was aimed to find out the effect of treatments to students’ writing score.
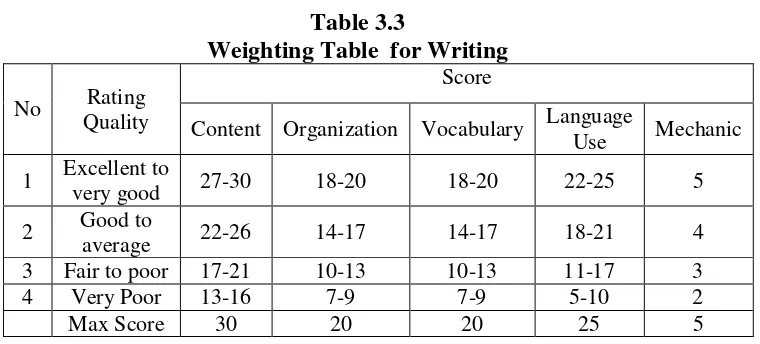
2. Scoring
Researcher used scoring technique of Jacob (1981: 92) in this research to assess students’ writing
Table 3.3
Weighting Table for Writing
No Rating
Quality
Score
Content Organization Vocabulary Language
Use Mechanic
1 Excellent to
very good 27-30 18-20 18-20 22-25 5
2 Good to
average 22-26 14-17 14-17 18-21 4
3 Fair to poor 17-21 10-13 10-13 11-17 3
4 Very Poor 13-16 7-9 7-9 5-10 2
Max Score 30 20 20 25 5
H. Technique of Data Analysis
determine whether there was any significant effect of the mean score between the two sets of tests. The purpose was to see difference of students’ writing Skill between experimental class and control class.
In analyzing students’ test score, some steps were done before analyzing the different mean by using t-test formula as follows Sudjana (2005:67, 93, 239):
T-test formulas develop which was presented as follow:
I. This formula was used to decide mean of students’ test score in experiment and control class:
ܺതଵ =∑∑ிభிభభ (Experiment class) ܺതଶ = ∑∑ிమிమ
మ (Control class)
II. This formula was used to decide standard deviation of experiment class ܵଵଶ =݊ଵ∑ܨଵܺଵ
ଶ (∑ܨ ଵܺଵ)ଶ ݊ଵ(݊ଵ− 1)
III. This formula was used to decide standard deviation of control class
ܵଶଶ =݊ଶ∑ܨଶܺଶ ଶ (∑ܨ
ଶܺଶ)ଶ ݊ଶ(݊ଶ − 1)
The formula of T-test was followed by Sudjana, (1996: 239) ݐ= ݔҧଵ− ݔതതതଶ
t = the value of t calculated X1 =mean score of experiment class X2 = mean score of control class
S12 = standard deviation of experiment group S22 = standard deviation of control group