CHAPTER IV
RESULT OF THE RESEARCH AND DISCUSSION
This chapter is present the result of the study and discussion. The finding design to
answer the research problem is questionnaire. This section covered
data of the students’
preference toward EFL listening teaching strategies at English Education Study Program in
State Islamic Institute of Palangka Raya and discussion.
A.
Data Presentation
Data presentation presented about the calculation of the questionnaire result on the
students’ preference toward listening teaching strategies at English Education Study Prorgam
in State Islamic Institute of Palangka Raya. Including about number and percent of students
preference.
The Percentage Calculation of the Questionnaire Result
On
The Students’ Preference toward EFL Listening Teaching Strategies at
English Education Program in State Islamic Institute of Palangka Raya.
NoDeclaration
Number & Percent
Scale
Total SA=5 A=4 N=3 D=2 SD=1 Missing
1. Saya suka mendengarkan audio untuk mendapatkan informasi tertentu secara umum.
I like listening audio to get particular
information generally.
Number 25 88 29 6 1 1 150
Percent 16,7% 58,7% 19,3% 4% 0,7% 0,7% 100%
2. Saya mendengarkan ide utama terlebih dahulu baru kemudian ide pendukung.
I listen for main ideas first then for details.
Number 22 96 29 2 0 1 150
3. Saya suka mendengarkan dari informasi yang umum kemudian informasi khusus.
I like listening from the general information then special information.
Number 24 70 44 9 1 2 150
Percent 16% 46,7% 29,3% 6% 0,7% 1,3% 100%
4. Saya mencoba untuk membuat ringkasan singkat dari apa yang telah saya dengar untuk memahami teks.
I try to make a written or short summary of word of i have listen to comprehend the meaning.
Number 39 70 33 7 0 1 150
Percent 26% 46,7% 22,7% 4,7% 0 0,7% 100%
5. Saya lebih suka mendengarkan audio dengan cara dipotong-potong pada bagian tertentu.
I prefer listening audio chunk by chunk in certain part
Number 24 43 36 42 5 0 150
Percent 16% 28,7% 24% 28% 3,3% 0 100%
6. Saya senang membaca
pertanyaan-pertanyaan secara cepat kemudian, saya memutuskan untuk
mendengarkan hal-hal khusus dalam
teks yang berhubungan dengan pertanyaan-pertanyaan tersebut.
I like scanning the question first, and then decide to listen for specific aspect of script.
Percent 13,3% 32% 33,3% 19,3% 1,3% 0,7% 100%
7. Saya suka menebak arti kata-kata yang sulit dengan cara menggunakan kata-kata umum yang sudah dikenal dalam lingkup bahasan yang sama.
I like guessing the
meaning of
unfamiliar words using known words in this surrounding context.
Number 22 67 44 16 0 1 150
Percent 14,7% 44,7% 29,3% 10,7% 0 0,7% 100%
8. Saya mencoba untuk menggunakan informasi diluar kalimat-kalimat dalam dialog untuk menebak arti dari kata-kata yang tidak sayak etahui.
I try to use information beyond the sentence level to guess the meaning of unknown words.
Number 14 74 48 14 0 0 150
Percent 9,3% 49,3% 32% 9,3% 0 0 100%
9. Saya mencoba menebak informasi berdasarkan tempat dimana
dialog/monolog berlangsung.
I try to guess the information based on where the dialogue/
monologue take
Number 21 79 40 8 0 2 150
place
10. Saya lebih mudah membuat
kesimpulan
sementara dari audio setelah menemukan kata kunci.
It is easier to make inference fro audio after optioning the key words.
Number 24 70 44 11 0 1 150
Percent
16% 46,7% 29,3% 7,3% 0 0,7% 100%
11. Saya membuat hipotesa pada teks berdasarkan judul, kemudian saya membuktikan hipotesa tersebut
saat saya
mendengarkan.
I make hypotheses on text by titles and then verify my anticipation
Number 21 65 50 13 0 1 150
Percent 14% 43,3% 33,3% 8,7% 0 0,7% 100%
12. Saya
menghubungkan informasi baru dengan pengalaman atau pengetahuan saya pribadi.
I related new information to my personal experience or knowledge.
Number 23 74 44 7 0 2 150
Percent 15,3% 49,3% 29,3% 4,7% 0 1,3% 100%
13. Saya suka mendengarkan ide pendukung terlebih dahulu kemudian ide pokok/ ide
utama.
I like listening for details first then for main idea.
Percent 13,3% 36,7% 38% 10% 0 2% 100%
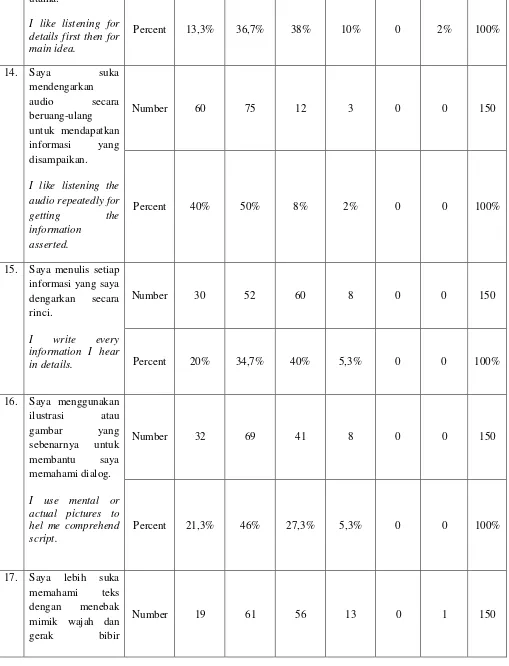
14. Saya suka mendengarkan audio secara beruang-ulang untuk mendapatkan informasi yang disampaikan.
I like listening the audio repeatedly for getting the information
asserted.
Number 60 75 12 3 0 0 150
Percent 40% 50% 8% 2% 0 0 100%
15. Saya menulis setiap informasi yang saya dengarkan secara rinci.
I write every information I hear in details.
Number 30 52 60 8 0 0 150
Percent 20% 34,7% 40% 5,3% 0 0 100%
16. Saya menggunakan ilustrasi atau gambar yang sebenarnya untuk membantu saya memahami dialog.
I use mental or actual pictures to hel me comprehend script.
Number 32 69 41 8 0 0 150
Percent 21,3% 46% 27,3% 5,3% 0 0 100%
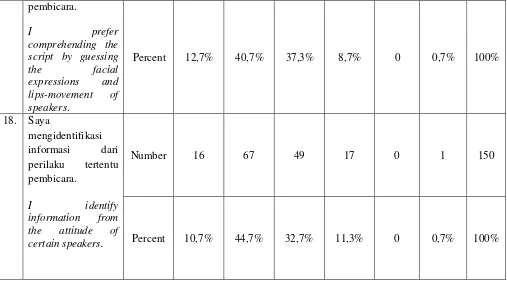
17. Saya lebih suka memahami teks dengan menebak mimik wajah dan gerak bibir
pembicara.
I prefer
comprehending the script by guessing
the facial
expressions and lips-movement of speakers.
Percent 12,7% 40,7% 37,3% 8,7% 0 0,7% 100%
18. Saya
mengidentifikasi informasi dari perilaku tertentu pembicara.
I identify
information from the attitude of certain speakers.
Number 16 67 49 17 0 1 150
Percent 10,7% 44,7% 32,7% 11,3% 0 0,7% 100%
B.
Result of the Research
The result of research on Students’
Preference toward EFL Listening Teaching
Strategies at English Education Program in State Islamic Institute of Palangka Raya was
obtained by employing questionnaire to collect the data. The presented data consisted of
responses, central tendency (mean, median, modus), and standard deviation. There were
150 students from three different academic years who were chosen as sampling.
First step was to tabulate score into the table of calculation Mean. The table 4.1
was shown below:
Table 4.1
The Calculation of Mean of Students’ Preference (item 1)
X F FX
5 25 125
4 89 356
3 29 87
2 5 10
1 1 1
N=150 ∑FX =579
∑X 579
X = = = 3.86 N 150
The mean of item 1 is 3.86.
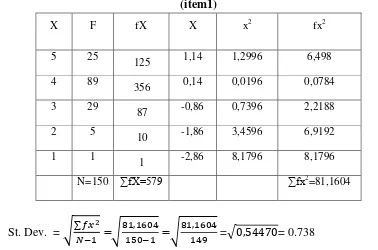
Next step is to tabulate the score into the table of calculation Deviation Score
and Standard Deviation
.Table 4.2
The Calculation of Deviation Score and Standard Deviation of Students’ Preference
(item1)
X F fX X x2 fx2
5 25
125 1,14 1,2996 6,498
4 89
356 0,14 0,0196 0,0784
3 29
87 -0,86 0,7396 2,2188
2 5
10 -1,86 3,4596 6,9192
1 1 1 -2,86 8,1796 8,1796
N=150 ∑fX=579 ∑fx2=81,1604
St. Dev. =
√
∑
=
√
=
√
=
√
= 0.738
Then, the score of Mean, Median, Modus, and Standard Deviation are tabulated in the
table. The table is as follows table 4.3:
1.
Result of Questionnaire Analysis
Table 4.3
Result of Questionnaire
No It
e m
Number & Percent
Scale
Total Me Mdn Mo ST. DEV SA=5 A=4 N=3 D=2 SD=1 Missi
ng
1 1 Number 25 88 29 6 1 1 577 3,85 4,00 4 0,738
Percent 16,7% 58,7% 19,3
% 4% 0,7% 0,7% 100
Percent 14,7% 64% 19,3
% 1,3% 0 0,7% 100
3 3 Number 24 70 44 9 1 2 551 3,67 4,00 4 0,930
Percent 16% 46,7% 29,3
% 6% 0,7% 1,3% 100
4 4 Number 39 70 33 7 0 1 588 3,92 4,00 4 0,879
Percent 26% 46,7% 22,7% 4,7% 0 0,7 100
5 5 Number 24 43 36 42 5 0 489 3,26 3,00 4 1,132
Percent 16% 28,7% 24% 28% 3,3% 0 100
6 6 Number 20 48 50 29 2 1 502 3,35 3,00 3 1,023
Percent 13,3% 32% 33,3% 19,3% 1,3% 0,7% 100
7 7 Number 22 67 44 16 0 1 542 3,61 4,00 4 0,911
Percent 14,7% 44,7% 29,3% 10,7% 0 0,7% 100
8 8 Number 14 74 48 14 0 0 538 3,59 4,00 4 0,787
Percent 9,3% 49,3% 32% 9,3% 0 0 100
9 9 Number 21 79 40 8 0 2 557 3,71 4,00 4 0,870
Percent 14% 52,7% 26,7% 5,3% 0 1,3% 100
10 10 Number 24 70 44 11 0 1 554 3,69 4,00 4 0,874
Percent 16% 46,7% 29,3% 7,3% 0 0,7% 100
11 11 Number 21 65 50 13 0 1 541 3,61 4,00 4 0,882
Percent 14% 43,3% 33,3% 8,7% 0 0,7% 100
12 12 Number 23 74 44 7 0 2 557 3,71 4,00 4 0,877
Percent 15,3% 49,3% 29,3% 4,7% 0 1,3% 100
13 13 Number 20 55 57 15 0 3 521 3,47 3,50 3 0,981
Percent 13,3% 36,7% 38% 10% 0 2,0% 100
14 14 Number 60 75 12 3 0 0 642 4,28 4,00 4 0,696
15 15 Number 30 52 60 8 0 0 554 3,69 4,00 3 0,851
Percent 20% 34,7% 40% 5,3% 0 0 100
16 16 Number 32 69 41 8 0 0 575 3,83 4,00 4 0,823
Percent 21,3% 46% 27,3% 5,3% 0 0 100
17 17 Number 19 61 56 13 0 1 533 3,55 4,00 4 0,871
Percent 12,7% 40,7% 37,3% 8,7% 0 0,7% 100
18 18 Number 16 67 49 17 0 1 529 3,53 4,00 4 0,880
Percent 10,7% 44,7% 32,7% 11,3% 0 0,7% 100
The data above could be detailed as follows:
item1
Frequency Percent Valid Percent Cumulative Percent
Valid 0 1 ,7 ,7 ,7
1 1 ,7 ,7 1,3
2 6 4,0 4,0 5,3
3 29 19,3 19,3 24,7
4 88 58,7 58,7 83,3
5 25 16,7 16,7 100,0
Total 150 100,0 100,0
Item 1, I like listening audio to get particular information generally. There were
25 students (16.7%) who strongly agreed, 88 students (58.7%) who agreed, 29 students
(19.3%) who neutral, 6 students (4%) who disagreed, a student (0.7%) who strongly
disagreed, a student (0.7%) who strongly disagreed, a student (0.7%) did not answer.
item2
Frequency Percent Valid Percent Cumulative Percent
Valid
0 1 ,7 ,7 ,7
2 2 1,3 1,3 2,0
3 29 19,3 19,3 21,3
4 96 64,0 64,0 85,3
5 22 14,7 14,7 100,0
Item 2, I listen for main ideas first then for details. There were 22 students
(14.7%) who strongly agreed, 96 students (64%) who agreed, 29 students (19.3%) who
neutral, 2 students (4%) who disagree, and a student (0.7%) did not answer.
item3
Frequency Percent Valid Percent Cumulative Percent
Valid
0 2 1,3 1,3 1,3
1 1 ,7 ,7 2,0
2 9 6,0 6,0 8,0
3 44 29,3 29,3 37,3
4 70 46,7 46,7 84,0
5 24 16,0 16,0 100,0
Total 150 100,0 100,0
Item 3, I like listening from the general information then special information.
There were 5 students (16%) who strongly agreed, 70 students (46.7%) who agreed 44
students (29.3%) who neutral, 9 students (4%) who disagreed, a student (0.7%) who
strongly disagreed, and 2 students (1.3%) did not answer.
item4
Frequency Percent Valid Percent Cumulative Percent
Valid
0 1 ,7 ,7 ,7
2 7 4,7 4,7 5,3
3 33 22,0 22,0 27,3
4 70 46,7 46,7 74,0
5 39 26,0 26,0 100,0
Total 150 100,0 100,0
item5
Frequency Percent Valid Percent Cumulative Percent
Valid
1 5 3,3 3,3 3,3
2 42 28,0 28,0 31,3
3 36 24,0 24,0 55,3
4 43 28,7 28,7 84,0
5 24 16,0 16,0 100,0
Total 150 100,0 100,0
Item 5, I prefer listening audio chunk by chunk in certain part. There were 24
students (16%) who strongly agreed, 43 students (28.7%) who agreed, 36 students
(24%) who neutral, 42 students (28%) who disagreed, and 5 student (3.3%) who
strongly disagreed.
item6
Frequency Percent Valid Percent Cumulative Percent
Valid
0 1 ,7 ,7 ,7
1 2 1,3 1,3 2,0
2 29 19,3 19,3 21,3
3 50 33,3 33,3 54,7
4 48 32,0 32,0 86,7
5 20 13,3 13,3 100,0
Total 150 100,0 100,0
Item 6, I like scanning the question first, and then decide to listen for specific
aspect of script I like scanning the question first, and then decide to listen for specific
aspect of script.
There were 20 students (13.3%) who strongly agreed, 48 students
(32%) who agreed, 50 students (33.3%) who neutral, 29 students (19.3%) who
disagreed, 2 students (1.3%) who strongly disagreed, and a student (0.7%) did not
answer.
item7
Frequency Percent Valid Percent Cumulative Percent
Valid
0 1 ,7 ,7 ,7
2 16 10,7 10,7 11,3
3 44 29,3 29,3 40,7
4 67 44,7 44,7 85,3
5 22 14,7 14,7 100,0
Item 7, I like guessing the meaning of unfamiliar words using known words in
this surrounding context.
There were 22 students (14.7%) who strongly agreed, 67
students (44.7%) who agreed, 44 students (29.3%) who neutral, 16 students (10.7%)
who disagreed, and a student (0.7%) did not answer.
item8
Frequency Percent Valid Percent Cumulative Percent
Valid
2 14 9,3 9,3 9,3
3 48 32,0 32,0 41,3
4 74 49,3 49,3 90,7
5 14 9,3 9,3 100,0
Total 150 100,0 100,0
Item 8, I try to use information beyond the sentence level to guess the meaning
of unknown words.
There were 14 students (9.3%) who strongly agreed, 74 students
(49.3%) who agreed, 48 students (32%) who neutral, 48 students (32%) who disagreed,
and 14 students (9.3%) who disagreed.
item9
Frequency Percent Valid Percent Cumulative Percent
Valid
0 2 1,3 1,3 1,3
2 8 5,3 5,3 6,7
3 40 26,7 26,7 33,3
4 79 52,7 52,7 86,0
5 21 14,0 14,0 100,0
Total 150 100,0 100,0
Item 9, I try to guess the information based on where the dialogue/ monologue
take place.
There were 21 students (14%) who strongly agreed, 79 students (52.7%)
who agreed, 40 students (26.7%) who neutral, 8 students (5.3%) who disagreed, and 2
students (1.3%) did not answer.
item10
Frequency Percent Valid Percent Cumulative Percent
Valid
0 1 ,7 ,7 ,7
2 11 7,3 7,3 8,0
3 44 29,3 29,3 37,3
4 70 46,7 46,7 84,0
5 24 16,0 16,0 100,0
Item 10, it is easier to make inference from audio after optioning the key word.
There were 24 students (16%) who strongly agreed, 70 students (46.7%) who agreed,
44 students (29.3%) who neutral, 11 students (7.3%) who disagreed, and a student
(0.7%) did not answer.
item11
Frequency Percent Valid Percent Cumulative Percent
Valid
0 1 ,7 ,7 ,7
2 13 8,7 8,7 9,3
3 50 33,3 33,3 42,7
4 65 43,3 43,3 86,0
5 21 14,0 14,0 100,0
Total 150 100,0 100,0
Item 11, I make hypotheses on text by titles and then verify my anticipation.
There were 21 students (14%) who strongly agreed, 65 students (43.3%) who agreed,
50 students (33.3%) who neutral, 13 students (8, 7%) who disagreed, and a student
(0.7%) did not answer.
item12
Frequency Percent Valid Percent Cumulative Percent
Valid
0 2 1,3 1,3 1,3
2 7 4,7 4,7 6,0
3 44 29,3 29,3 35,3
4 74 49,3 49,3 84,7
5 23 15,3 15,3 100,0
Total 150 100,0 100,0
item13
Frequency Percent Valid Percent Cumulative Percent
Valid
0 3 2,0 2,0 2,0
2 15 10,0 10,0 12,0
3 57 38,0 38,0 50,0
4 55 36,7 36,7 86,7
5 20 13,3 13,3 100,0
150 100,0 Total
Item 13,
I like listening for the details first then the main idea.
There are 20
students (13.3%) who strongly agreed, 55 students (36.7%) who agreed, 57 students
(38%) who neutral, 15 students (10%) who disagreed, and 3 students (2%) did not
answer.
item14
Frequency Percent Valid Percent Cumulative Percent
Valid
2 3 2,0 2,0 2,0
3 12 8,0 8,0 10,0
4 75 50,0 50,0 60,0
5 60 40,0 40,0 100,0
Total 150 100,0 100,0
Item 14, I like listening the audio repeatedly for getting the information
asserted. There were 60 students (40%) who strongly agreed, 75 students (50%) who
agreed, 12 students (8%) who neutral, and 3 students (2%) who disagreed.
item15Frequency Percent Valid Percent Cumulative Percent
Valid
2 8 5,3 5,3 5,3
3 60 40,0 40,0 45,3
4 52 34,7 34,7 80,0
5 30 20,0 20,0 100,0
Total 150 100,0 100,0
item16
Frequency Percent Valid Percent Cumulative Percent
Valid
2 8 5,3 5,3 5,3
3 41 27,3 27,3 32,7
4 69 46,0 46,0 78,7
5 32 21,3 21,3 100,0
Total 150 100,0 100,0
Item 16,
I use mental or actual pictures to help me comprehend script.
There
were 32 students (21.3%) who strongly agreed, 69 students (46%) who agreed, 41
students (27.3%) who neutral, and 8 students (5.3%) who disagreed.
item17
Frequency Percent Valid Percent Cumulative Percent
Valid
0 1 ,7 ,7 ,7
2 13 8,7 8,7 9,3
3 56 37,3 37,3 46,7
4 61 40,7 40,7 87,3
5 19 12,7 12,7 100,0
Total 150 100,0 100,0
Item 17, I prefer comprehending the script by guessing the facial expressions
and lips-movement of speakers. There were 19 students (12.7%) who strongly agreed,
61 students (40.7%) who agreed, 56 students (37.7%) who neutral, 13 students (8.7%)
who disagreed, and a student (0.7%) did not answer.
item18
Frequency Percent Valid Percent Cumulative Percent
Valid
0 1 ,7 ,7 ,7
2 17 11,3 11,3 12,0
3 49 32,7 32,7 44,7
4 67 44,7 44,7 89,3
5 16 10,7 10,7 100,0
Total 150 100,0 100,0