Locomotor Ecology of Wild Orangutans (Pongo
pygmaeus abelii) in the Gunung Leuser Ecosystem,
Sumatra, Indonesia: A Multivariate Analysis Using
Log-Linear Modelling
Susannah K.S. Thorpe1* and Robin H. Crompton2
1Department of Human Biology, University of Cape Town, Cape Town 7925, South Africa
2Department of Human Anatomy and Cell Biology, University of Liverpool, Liverpool L69 3GE, UK
KEY WORDS primate; locomotion; support use
ABSTRACT The large body mass and exclusively ar-boreal lifestyle of Sumatran orangutans identify them as a key species in understanding the dynamic between mates and their environment. Increased knowledge of pri-mate locomotor ecology, coupled with recent developments in the standardization of positional mode classifications (Hunt et al. [1996] Primates37:363–387), opened the way for sophisticated multivariate statistical approaches, clar-ifying complex associations between multiple influences on locomotion. In this study we present a log-linear mod-elling approach used to identify key associations between orangutan locomotion, canopy level, support use, and con-textual behavior. Log-linear modelling is particularly ap-propriate because it is designed for categorical data, pro-vides a systematic method for testing alternative hypotheses regarding interactions between variables, and allows interactions to be ranked numerically in terms of
relative importance. Support diameter and type were found to have the strongest associations with locomotor repertoire, suggesting that orangutans have evolved dis-tinct locomotor modes to solve a variety of complex habitat problems. However, height in the canopy and contextual behavior do not directly influence locomotion: instead, their effect is modified by support type and support diam-eter, respectively. Contrary to classic predictions, age-sex category has only limited influence on orangutan support use and locomotion, perhaps reflecting the presence of arboreal pathways which individuals of all age-sex cate-gories follow. Effects are primarily related to a tendency for adult, parous females to adopt a more cautious ap-proach to locomotion than adult males and immature sub-jects. Am J Phys Anthropol 127:58 –78, 2005.
©2004 Wiley-Liss, Inc.
The type, size, and orientation of supports within the canopy has a considerable potential influence on the expressed locomotor repertoire of arboreal ani-mals. As Grand (1972, 1984) noted, the principal stable elements in a forest are vertical tree trunks separated horizontally from one another by substan-tial amounts of space. Branches stretch outwards from trunks but taper toward the ends, and as they become thinner they become weaker and less stable, deforming more readily under an animal’s weight. Even the narrowest gaps between trees will lie be-tween the ends of branches, and compliance thus creates difficulty when crossing from one tree to another. Furthermore, edible fruits and leaves also tend to be located on thin peripheral branches (Grand, 1984). Sumatran orangutans, as the largest extant mammal to live an exclusively arboreal life-style (Rodman, 1984), are thus an interesting spe-cies in understanding the dynamics between arbo-real animals and their environment.
However, the data collected during field studies of primate locomotor behavior are by no means as readily analyzed as morphometric data on the
loco-motor system itself (e.g., measurements on the post-cranial skeleton). In most cases, field studies of lo-comotion are concerned with establishing the expression of a species’ locomotor potential (set pri-marily by the mechanical design of the musculoskel-etal system) in a given environment. We are there-fore concerned to know the interaction of variables, including the locomotor repertoire of the subject spe-cies and its diet and ranging behavior, with a range of variables expressing the structure of the habitat
Grant sponsor: European Commission; Grant sponsor: Indonesian Government; Grant sponsor: Leverhulme Trust; Grant sponsor: Royal Society; Grant sponsor: L.S.B. Leakey Foundation; Grant sponsor: Natural Environment Research Council.
*Correspondence to: Dr. Susannah Thorpe, School of Biosciences, University of Birmingham, Edgbaston, Birmingham B15 2TT, UK. E-mail: [email protected]
Received 17 December 2002; accepted 26 November 2003.
DOI 10.1002/ajpa.20151
Published online 10 September 2004 in Wiley InterScience (www. interscience.wiley.com).
in which it is observed, and the distribution of re-sources and risks within that habitat. Variables commonly observed include the mode (type) of loco-motor or postural behavior, height above ground, diameter and angle (to the horizontal) of the sup-ports on which locomotion occurs, the time at which it occurs, the distance over which it occurs, and the associated behavioral context. Some of these vari-ables, such as distance over which locomotion oc-curs, are relatively easy to estimate accurately and repeatably, and may reliably be treated as continu-ous variables, where standard statistical techniques such ast-tests may legitimately be employed, if the data may be regarded as normally distributed (in practice, the t-test is fairly robust to violations of normality). Others, such as height of support and support diameter, are often recorded as estimates of linear dimensions: these may be analyzed as contin-uous variables, but care is needed, especially in for-ests where a primate may be high in the canopy and height or diameter is difficult to estimate consis-tently, and it is often easier to establish a mental scale or range of height or diameter categories. Other variables, such as support orientation, are usually observed as range categories, e.g., vertical, angle, and horizontal. These variables, however, are in effect naturally ordered, and may be treated as ordinal variables. But a third type of variable, such as type or mode of locomotion which occurs, and type of behavior (or context) with which locomotion or posture is associated, is categorical, with no natural order, and nonparametric statistical techniques must be used, unless we are concerned to know, for example, at what heights running or feeding tends to occur, when the categories are used only to estab-lish a priori groups.
Standard nonparametric tests (such as2tests on contingency tables, when examining relationships between variable frequencies) are usually fairly ro-bust when the association between a pair of vari-ables is under examination. However, while valid for two-dimensional analyses, such an approach may lead to misleading conclusions, if we attempt to ex-amine multidimensional relationships by analyzing a series of combinations of two-dimensional tables (Gilbert, 1981; Agresti, 1990). A further difficulty arises when cell frequencies may be low or zero, as happens very quickly when examining locomotor data, even where the overall dataset is numbered in tens of thousands of observations. Analysis of vari-ance approaches, including multivariate ANOVA, may be used when we are concerned only to examine the influence of categorical variables on continuous variables, but normal distribution is a requisite, dif-ficult to achieve under field conditions, and ANOVA is not robust to violations of normality.
Log-linear analysis is a technique which has only in the last few years become available in standard statistical analysis packages such as SPSS. It may very loosely be regarded as a nonparametric, multi-variate analogue of ANOVA, which is capable of
examining the relationships of a mix of continuous, ordinal, and categorical data by treating them all as categorical data, which does not require the assump-tion of normality (Tabachnick and Fidell, 1989; Crook, 1997). It would therefore appear to be an ideal tool with which to examine the interrelation-ship between locomotion and habitat variables.
Cant (1987a) previously identified the main weight-bearing support for each locomotor bout ex-hibited during travel for two adult female orangu-tans and found clear associations between particu-lar locomotor modes and both support type and diameter. Orangutans also show a large degree of sexual dimorphism, and age-related variation in body mass and build, and Sugardjito and van Hooff (1986) reported significant differences in locomotor repertoire and in use of different canopy levels dur-ing travel for adult males, adult females, and ado-lescents. However, studies on great ape positional behavior by Cant (1987b) and Hunt (1994) raised questions regarding the importance of body mass relative to other influential factors on ape posture. Cant (1987b) found no difference in the levels of suspensory postures exhibited by the different age-sex categories for orangutans, a result which ap-pears to conflict with expectations (Cartmill and Milton, 1977) that higher body mass should be as-sociated with increased levels of suspension. Cant (1987a,b), however, focused only on the main weight-bearing support, and so could not eliminate the effect of the use of multiple supports. Sugardjito (1982), Sugardjito and van Hooff (1986), and Cant (1987a) therefore provided broad descriptions of or-angutan locomotor behavior during travel.
The aim of the present study is to build on this work by identifying more precisely the relationship between orangutan locomotion and support use, for all age-sex categories and during travel and during feeding, using the log-linear approach. To this end, our observations of the behavior of wild orangutans recorded support type and diameter for all supports which appeared to bear more than the mass of the limb contacting it (following Hunt et al., 1996), in bouts for which up to four supports were used. The influences of the age-sex category of the individual, the height of the animal in the canopy, and contex-tual behavior on observed locomotion are also ana-lyzed.
SUBJECTS AND METHODS
Field study
ani-mals and their relationships and histories are well-known.
Conditions of visibility ruled out any classification of positional behavior on the basis of footfall pattern or hand/foot grip. Instead, positional classifications are based on the standard categories detailed by Hunt et al. (1996), who categorized both postural and locomotor behavior in terms of the number of weight-bearing limbs and whether each limb ap-pears to be under predominantly suspensory (“ten-sile”) or compressive stress regimes. In this classifi-cation system, the body part that bears the most weight is recorded first in the definition. Body parts which contact a substrate but which do not appear to bear more than their own weights are not included in the locomotor definition (Hunt et al., 1996). Infor-mation on whether the weight-bearing limbs are flexed or extended is also recorded (joints are re-garded as “extended” only when in, or very near, full extension; all other joint positions are recorded as “flexion”).
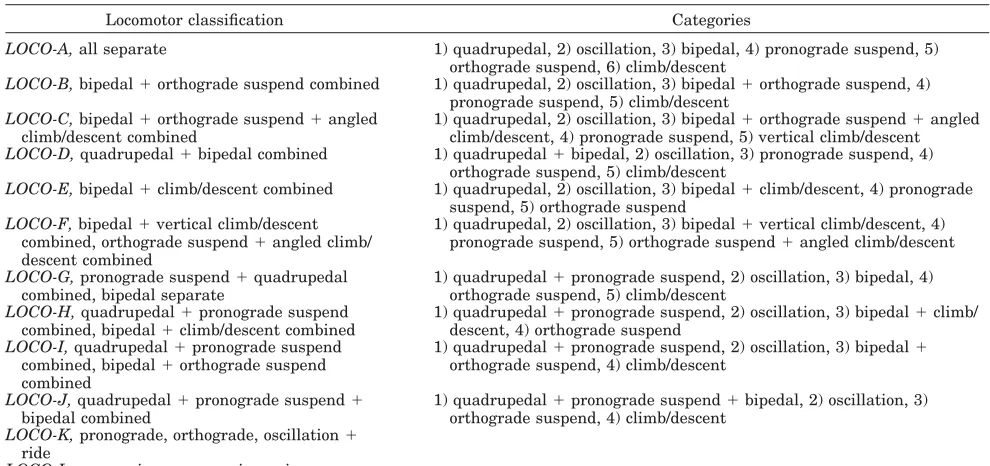
The first 6 weeks were spent in refining the stan-dard categories given in Hunt et al. (1996) to reflect better the diversity of orangutan locomotion, and in self-training to estimate support and locomotor clas-sifications. Fifty-four biomechanically distinct loco-motor submodes were identified. These will be pub-lished in detail elsewhere, but for the present study they are conflated into seven modes (Table 1). Fur-ther self-training in estimating height and diameter of supports was performed during this time and throughout the data collection period. The main pe-riod of data collection thus took place between Feb-ruary–November 1999.
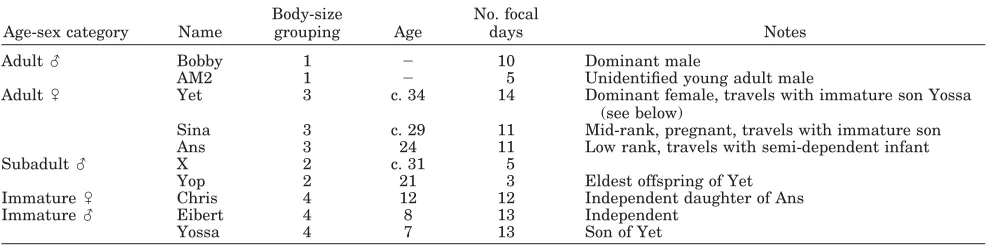
Apart from the type, number, and diameter of the supports used, the height of the animal in the can-opy, the direction of locomotion, and the contextual behavior, the main group of variables which might a priori be regarded as likely to have influence on orangutan locomotion consists of the age, sex, rank, and body size of the individual. Social rank is less relevant for orangutans than in studies of many other primate species due to their more solitary nature. Further, factors other than age influence the development of secondary sexual characteristics; thus a male orangutan might be adult in years but subadult in development (Utami et al., 1997). There-fore, we define adult males as those exhibiting sec-ondary sexual characteristics such as cheek flanges, throat pouches, and increased body mass, and adult females as females that have given birth. Subadult males are defined as sexually active males that lack secondary sexual characteristics, and immature males and females as subjects that show no sexual activity (Rijksen, 1978). Ten adult and immature individuals from both sexes were observed. See Ta-ble 2 for subject information. It is obviously impos-sible to know the absolute body mass of free-ranging subjects without trapping them, which would have been unethical even were it possible. Subjects were therefore visually ranked according to decreasing body size, particularly when two or more individuals were near one another. These were then classified into the body-size groups specified in Table 2. Vari-ation in body size was substantially greater between groups than within groups, although subadult males were closer in size to adult females than to adult males. Classifications of an orangutan’s age, sex, TABLE 1. Positional behavior observations
1. Date 2. Individual 3. Time
4. Positional mode1
Quadrupedal walk: locomotion on top of supports angled at⬍45°. Typically all four limbs contact support in a particular sequence. Torso is pronograde or roughly parallel to support. Includes tripedal walk, quadrupedal run, and tripedal run.
Bipedal walk: hindlimbs provide support and propulsion, with only insignificant contributions from other body parts. Includes flexed and extended bipedalism, and hand-assisted bipedalism in which hindlimbs bear more than 50% of body mass, but one or both forelimbs are used to assist, either in suspension or compression, and bear more than their own weight.
Climb/descent2: ascent and descent on supports angled at
ⱖ45°. Distinction is made between vertical climb/descent (i.e., climbing on supports within 20° of true vertical) and angled climb/descent (climbing between 20°–45°).
Torso-orthograde suspension: includes brachiation and orthograde clamber which is a forelimb suspensory torso-orthograde mode, but with hindlimbs assisting either in suspension or compression. All four limbs act as propulsors, with most of bodyweight borne by abducted forelimbs. Also includes mode drop, in which all predrop postures were orthograde in nature.
Torso-pronograde suspension3: all limbs are used in some combination; torso is pronograde, and limbs are in tension.
Bridge: a torso pronograde gap closing movement used with limbs both in compression and suspension.
Oscillation: combines modes tree sway and ride, although note that “ride” for Sumatran orangutans does not occur from tree to ground as in Hunt et al. (1996), but from a higher to lower level in canopy. Also includes liana and branch sway, in which body is used to oscillate vertical/subvertical lianas/branches with increasing amplitude to reach next support. These modes are conflated in this study, since all involve significant support deformation.
5. Height: 5 m interval up to 40 m,⬎40m (measured as the vertical distance from the animal to the ground) 6. Number of supports: 1; 2; 3; 4; many
7. Support type: branch, liana, trunk, bough, other (aerial roots, bamboo, nest)
8. Support diameter:⬍2 cm;ⱖ2–⬍4 cm;ⱖ4–⬍10 cm;ⱖ10–⬍20 cm;ⱖ20–⬍40 cm;ⱖ40–⬍80 cm;ⱖ80 cm (after Cant, 1987) 9. Behavior: feed (acquiring, processing, and eating); travel
10. Clinging infant
1All follow those of Hunt et al. (1996) unless otherwise stated, and include all submodes as detailed in their study. 220° was selected as a convenient midpoint between 0 – 45°.
and body size overlap sufficiently for these variables to be combined, to reduce redundancy in the model-ling process, as an age-sex variable, which acts, in this study, in place of a true body mass variable.
Instantaneous sampling on the 1-min mark was used to enable detailed support and behavioral data to be collected, in addition to positional behavior. This method does not take account of the distance travelled during a locomotor bout, but Doran (1992) demonstrated that results obtained with instanta-neous sampling do not differ significantly from loco-motor bout sampling with distance if the sample is large, as is the case in this study. Once located, the orangutans were followed for a maximum of 5 con-secutive days from when they left their night nest (normally around dawn, but in bad weather the time of commencement of travel could approach noon), until they built their next night nest (approximately 5:00 –7:00PM). Individuals were followed on at least
two well-separated occasions in an attempt to re-duce possible bias associated with temporarily abun-dant fruit.
Table 1 provides details of positional behavior ob-servations for this study. Two variables which might be expected to have an influence on the relationship between locomotor mode and related ecological vari-ables were omitted from the final analysis. These are the direction of locomotion and substrate angle. While direction of locomotion was recorded and ini-tially included in our statistical model, it was re-moved at an early stage, as its measurement in the field is problematic (dramatically increasing the number of cells with zero or small frequencies), and it is not independent of locomotor mode definitions (e.g., vertical climbing). Support angle was also re-corded, but the results are not presented because of the need to reduce the number of variables and categories.
One female (Ans) travelled with a dependent in-fant. During observation it was noted whether the infant was clinging or travelling independently, as Sugardjito and van Hooff (1986) found slight differ-ences in locomotor repertoire before and after par-turition. However, Ans’ locomotion did not differ significantly when the infant was clinging compared to when it was travelling independently.
Statistical analysis
The interdependence of observations is a further problem in the analysis of locomotor data. Sequen-tial observations using a small time interval are thought to produce results in which assumptions of independence may be violated, so that sampling pro-cedures may be required (Boinski, 1989; Hunt, 1991; Dagosto, 1994; Warren and Crompton, 1997). How-ever, due to poor visibility in this study and the tendency of orangutans to rest frequently during bouts of locomotion, sequential observations were rarely obtained. Consequently, we feel that the de-pendence between data points is of minimal concern here, and all locomotor observations are analyzed. To eliminate interobserver variation, one of us (S.K.S.T.) obtained all 28,797 instantaneous obser-vations of positional behavior, 2,811 of which were of locomotion, the subject of the present report. It should be noted that 47% of observed locomotor bouts sampled behavior of immature males and fe-males, 35% that of adult females and 19% that of adult and subadult males, so that there is a degree of undersampling of the behavior of the latter. How-ever, since body weight was only one of a number of variables included in the log-linear analysis, it would be inappropriate to weight the data on this basis.
Like any form of multivariate analysis, log-linear analysis should be regarded as first and foremost a means of exploring the data. Thus, we need to go into the process of analysis (or modelling) in some detail. We indicated above that our concern is to explore the relationship between the potential loco-motor repertoire of orangutans (what they can do) and the habitat in which they live: the expression of this relationship is locomotor behavior. This behav-ior can be thought of as a data-space influenced by a number of different variables, which may also have influence on each other. In hierarchical log-linear modelling, we ask which combination of interacting variables exerts a statistically significant influence on the data-space, and which best “explains” this data-space while leaving as little as possible (the residual) unexplained (for a detailed treatment, see Agresti, 1990).
TABLE 2. Study subjects1
Age-sex category Name
Body-size
grouping Age
No. focal
days Notes
Adult么 Bobby 1 ⫺ 10 Dominant male
AM2 1 ⫺ 5 Unidentified young adult male
Adult乆 Yet 3 c. 34 14 Dominant female, travels with immature son Yossa
(see below)
Sina 3 c. 29 11 Mid-rank, pregnant, travels with immature son
Ans 3 24 11 Low rank, travels with semi-dependent infant
Subadult么 X 2 c. 31 5
Yop 2 21 3 Eldest offspring of Yet
Immature乆 Chris 4 12 12 Independent daughter of Ans
Immature么 Eibert 4 8 13 Independent
Yossa 4 7 13 Son of Yet
1
Log-linear analysis works, like the familiar 2 test, by comparing actual cell counts in a contin-gency table to theoretically expected values (in this case, values predicted by the models). Like the chi-square test, it is thus most effective when there are as few variables as possible and as few empty or near-empty cells as possible. Iteratively, the proce-dure seeks the smallest “model,” i.e., variable-com-bination, which creates predicted cell-counts best fitting the observed cell counts in the multiway con-tingency tables. A significance value of 1 for the2 likelihood ratio indicates a perfect fit of the model’s predicted cell counts to the observed cell counts. In the first instance, terms (variable-interactions) with a significance value less than 0.05 are iteratively deleted. (Note that a large value forPin log-linear
analysis thus has an almost “opposite” implication, e.g., to the value of P in a t-test.) Generally, one
cannot expect to find one single best-fit model or “variable-combination” which explains all relation-ships between variables. As is typical of multivari-ate statistics, the analyst exercises informed judg-ment progressively to identify those variables and variable-combinations which best explain the field observations, aided in this case by biological inter-pretation of the adjusted residuals in the multiway contingency tables. These indicate by their sign whether a particular interaction is more (⫹ve) or less (⫺ve) common than predicted by the model, and by their size, to what degree (for details, see Agresti, 1990).
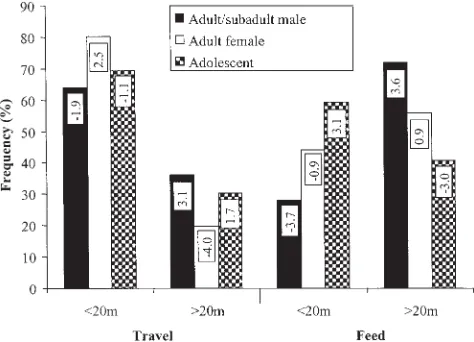
Once a best-fit model or models are established on the basis of the parameterP(the significance level of the 2 likelihood ratio), the relative importance of interactions included within a model is indicated by the rank of the standardized2 values (2/DF, e.g., last column in Table 8). For the best-fit models, we then proceed to determine the strength of relation-ships between variables from standardized cell re-siduals (SCRs) in the multiway contingency tables (e.g., Table 9) and calculate the odds ratios. These represent ratios of probabilities and enable the cor-relations underlying the significant interactions to be identified (Crook, 1997). For example, for the interaction age-sex * behavior * height in Figure 1, of the 752 observations of adult females travelling in the study, 603 travelled below 20 m. The probability that a female will travel below 20 m is therefore 603/752 (0.80), and the probability that females will move above 20 m is 149/752 (0.20). The odds ratios of these probabilities, i.e., 0.80/0.20, is 4, which estab-lishes a correlation between females and height in the canopy, with an adult female being four times more likely to travel below 20 m than above. The legitimacy and statistical reliability of this type of multidimensional statement, which we might previ-ously have had to make at considerable risk of mis-interpretation by analyzing a series of combinations of two-dimensional tables, lie at the heart of the power of the log-linear approach to analyze interac-tions between habitat and locomotor behavior.
Our analysis was performed using SPSS version 10.07 (Chicago, IL).
Sections of the analysis
Support type and diameter were only recorded for bouts in which between 1– 4 supports (e.g., up to one per limb) were used, as, in practice, it was impossi-ble to record such fine details when more than four supports were used during an observation. Conse-quently, the data are analyzed in two parts. Ini-tially, the relationships between locomotion and age-sex category, number of supports, height, and contextual behavior are analyzed for all observa-tions (n⫽ 2,811, the “basic” analysis). Then a more detailed analysis is presented for the observations which include data on support type and diameter (n⫽1,648, the “support” analyses), again in respect to their relationship with locomotion.
Conflation, recategorization, and selection of variables
uals). Height, for example, was reclassified in three ways: height-1, with categories 10 m, 10 –20 m, 20 –30 m, and30 m;height-2, with categories15 m, 15–30 m, and30 m; andheight-3, which divided observations into20 m and 20 m. Of these, the last proved the most effective in explaining the re-lationships between our variables by leading to bet-ter-fitting models, both in the basic and support analyses. In each case, better-fitting models also included the substitute variable age-sex-2, which combines adult and subadult males, leaving adult
females and immature subjects as separate catego-ries, andNo.supports-3, which distinguishes simply between the use of single and multiple supports.
In the “support” studies, analysis of all variables together (age-sex category, locomotor mode, height, behavior, number of supports, support type, and support diameter) was impossible, as there were more possible combinations between variables than observations. Analyses of associations between more than four variables resulted in very high levels of sampling zeros. Consequently the models of best fit TABLE 3. Substitute classifications tested in log-linear analysis
Original variable Substitute classification Categories
1. Age-sex Sex male; female
Age-sex-1 adult么; adult乆; subadult么; immature么乆 Age-sex-2 adult么subadult么; adult乆; immature么乆 Age-sex-3 adult么; adult乆subadult么; immature么乆
2. No. of supports No. of supports-1 1; 2; 3; 4;4
No. of supports-2 1; 2–4;4
No. of supports-3 1;1
3. Height Height-1 10 m; 10–20 m; 20–30 m;30 m
Height-2 15 m; 15–30 m;30 m
Height-3 20 m;20 m
4. Behavior Behav travel; feeding
5. Support type Type-1 liana; branch; boughtrunk; other; multiple liana; multiple branch; multiple boughtrunk; multiple other; mixed liana, branch, bough, trunk, other
Type-2 lianaother; tree; multiple lianaother; multiple tree; mixed liana, other, tree
6. Support diameter Diam (4,4) 4 cm;4 cm; multiple4 cm; multiple4 cm; mixed4,4 cm
Diam (10,10) 10 cm;10 cm; multiple10 cm; multiple10 cm; mixed10, 10 cm
Diam (4, 4–10,10) 4 cm; 4–10 cm;10 cm; multiple4 cm; multiple 4–10 cm; multiple10 cm; mixed4, 4–10,10 cm
Diam (10, 10–20,20) 10 cm; 10–20 cm;20 cm; multiple10 cm; multiple 10–20 cm; multiple20; mixed10, 10–20,20 cm
Diam (4, 4–10, 10–20,20) 4 cm; 4–10 cm; 10–20 cm;20 cm multiple4 cm; multiple 4– 10 cm; multiple 10–20 cm; multiple20; mixed4, 4–10, 10– 20,20 cm
TABLE 4. Substitute locomotor classifications tested in log-linear analysis
Locomotor classification Categories
LOCO-A,all separate 1) quadrupedal, 2) oscillation, 3) bipedal, 4) pronograde suspend, 5) orthograde suspend, 6) climb/descent
LOCO-B,bipedalorthograde suspend combined 1) quadrupedal, 2) oscillation, 3) bipedalorthograde suspend, 4) pronograde suspend, 5) climb/descent
LOCO-C,bipedalorthograde suspendangled climb/descent combined
1) quadrupedal, 2) oscillation, 3) bipedalorthograde suspendangled climb/descent, 4) pronograde suspend, 5) vertical climb/descent
LOCO-D,quadrupedalbipedal combined 1) quadrupedalbipedal, 2) oscillation, 3) pronograde suspend, 4) orthograde suspend, 5) climb/descent
LOCO-E,bipedalclimb/descent combined 1) quadrupedal, 2) oscillation, 3) bipedalclimb/descent, 4) pronograde suspend, 5) orthograde suspend
LOCO-F,bipedalvertical climb/descent combined, orthograde suspendangled climb/ descent combined
1) quadrupedal, 2) oscillation, 3) bipedalvertical climb/descent, 4) pronograde suspend, 5) orthograde suspendangled climb/descent
LOCO-G,pronograde suspendquadrupedal combined, bipedal separate
1) quadrupedalpronograde suspend, 2) oscillation, 3) bipedal, 4) orthograde suspend, 5) climb/descent
LOCO-H,quadrupedalpronograde suspend combined, bipedalclimb/descent combined
1) quadrupedalpronograde suspend, 2) oscillation, 3) bipedalclimb/ descent, 4) orthograde suspend
LOCO-I,quadrupedalpronograde suspend combined, bipedalorthograde suspend combined
1) quadrupedalpronograde suspend, 2) oscillation, 3) bipedal orthograde suspend, 4) climb/descent
LOCO-J,quadrupedalpronograde suspend bipedal combined
1) quadrupedalpronograde suspendbipedal, 2) oscillation, 3) orthograde suspend, 4) climb/descent
LOCO-K,pronograde, orthograde, oscillation ride
were found for variable subsets which looked at the relationship between locomotor mode, number of supports, support type, support diameter, and: A, age-sex; B, height; and C, behavior.
We further minimized the number of variable combinations by combining data concerning support type and number of supports used, e.g., the substi-tute variableType-2has categories liana and other; tree; multiple liana and other; multiple tree; mixed liana, other and tree (Table 3). Similarly, support diameter and number of supports were combined, e.g.,Diam4,4has the categories 4 cm;4 cm; multiple4 cm; multiple4 cm; and mixed4 cm and 4 cm. This method makes a distinction be-tween the use of 1 and 1 support, but combines observations in which 2, 3, and 4 supports are used, since the 1/1 demarcation was found to produce the best associations with other variables in the “basic” analysis.
It was also found necessary to conflate bipedalism, quadrupedalism, and pronograde suspension with other modes of locomotion, because these modes con-sistently resulted in large adjusted residuals. Differ-ent combinations were again essayed for each, based on analysis of the relevant adjusted residuals (Lo-co-B to Loco-I for bipedalism, and Loco-D and Lo-co-Gto Loco-Ifor the latter two; Table 4).
Model selection
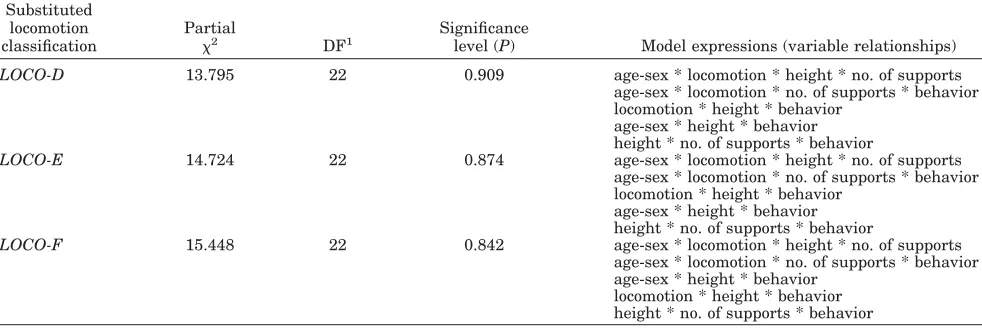
The three statistically best-fitting models in the basic analysis (see Table 5) included substitute lo-comotor variablesLoco-D, Loco-E, and Loco-F, but they were in other respects less desirable, in that they retained complex, second-order (four-way) vari-able interactions, while Loco-C, -H, -I, and -J re-solved one of these into two simpler, first-order (three-way) variable interactions. In the support analyses, substitute variables which retained de-tailed distinctions between locomotor modes gener-ally led to better-fitting models than those which conflated locomotion into only a few categories. But the substitute locomotor and diameter variables
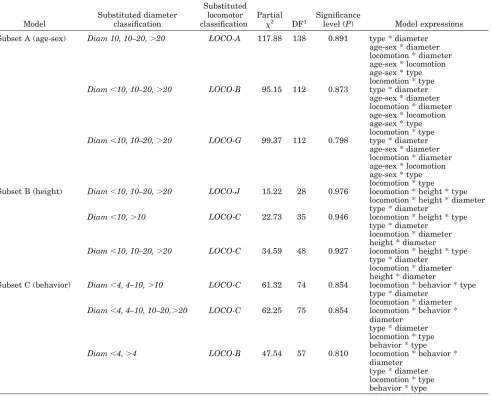
in-cluded in the models of statistical best fit (Table 6) differed between the variable analysis subsets A, B, and C. Consequently, to identify which substitute locomotor variable and which substitute diameter variable best represented the whole support analy-sis dataset (i.e., all data in subsets A, B, and C together), we calculated the mean values of signifi-cance (P), degrees of freedom, and sampling zeros for each substitute locomotion and diameter classifica-tion combinaclassifica-tion for subsets ABC, to produce an overall statistic for each combination (Table 7).
Log-linear analysis requires judgment to be exer-cised between retention of detail in categories and relationships, and goodness of fit: in some cases, for example, a better result in terms of desirable fea-tures (a high significance level,P, but a low percent-age of sampling zeros, and simple interactions) was achievable by excluding rare data, such as observa-tions on supports of over 10 cm in diameter (35 cases). Similarly, use of the substitute variable Lo-co-C, while not in the top three models of fit in the basic analysis, gave a better balance than those that were (Loco-D, -E, and -F, Table 5) in terms of a relatively highPwhile minimizing complex interac-tions, and while performing better thanLoco-H,-I, and-J in terms of retained detail.Loco-C was also the most frequently occurring substitute locomotor variable in the 10 overall statistically best-fitting models in the Table 7 for support analyses. Thus Loco-C was selected as the substitute locomotor variable which provided the best description of loco-motion, in relation to the other tested variables. Similar considerations led us to select Diam 10, 10 –20, 20as the most useful diameter classifica-tions.
Table 8 gives the models (sets of associations) for the chosen substitute locomotor and diameter vari-ables, for the basic analysis and support analysis subsets A, B, and C. The sets of associations re-mained the same when the minimumPfor retention of terms (variable-associations) was raised from 0.05 to 0.07, indicating a robust fit. The best-fit models
TABLE 5. The three best-fitting models for basic analysis1
Substituted locomotion classification
Partial
2 DF1
Significance
level (P) Model expressions (variable relationships)
LOCO-D 13.795 22 0.909 age-sex * locomotion * height * no. of supports
age-sex * locomotion * no. of supports * behavior locomotion * height * behavior
age-sex * height * behavior height * no. of supports * behavior
LOCO-E 14.724 22 0.874 age-sex * locomotion * height * no. of supports
age-sex * locomotion * no. of supports * behavior locomotion * height * behavior
age-sex * height * behavior height * no. of supports * behavior
LOCO-F 15.448 22 0.842 age-sex * locomotion * height * no. of supports
age-sex * locomotion * no. of supports * behavior age-sex * height * behavior
locomotion * height * behavior height * no. of supports * behavior
for the support analyses cannot be regarded as a full description of the associations between variables, since each analysis excludes two variables. To test whether the exclusions falsely increased clarity, all variables were analyzed together, using a SPSS log-linear forward selection approach in which the data
are first tested for no association between variables (main effects) and then all two-way associations, all three-way interactions, and so forth. The results for our chosen substitute variables Loco-C and Diam (10, 10 –20,20)were: main effects (2: 1,420.52, DF704,P1.E-50); all two-way associations (2: TABLE 6. The three best-fitting models for support analyses1
Model
Substituted diameter classification
Substituted locomotor classification
Partial 2 DF1
Significance
level (P) Model expressions
Subset A (age-sex) Diam 10, 10–20,20 LOCO-A 117.88 138 0.891 type * diameter age-sex * diameter locomotion * diameter age-sex * locomotion age-sex * type locomotion * type Diam10, 10–20,20 LOCO-B 95.15 112 0.873 type * diameter
age-sex * diameter locomotion * diameter age-sex * locomotion age-sex * type locomotion * type Diam10, 10–20,20 LOCO-G 99.37 112 0.798 type * diameter
age-sex * diameter locomotion * diameter age-sex * locomotion age-sex * type locomotion * type Subset B (height) Diam10, 10–20,20 LOCO-J 15.22 28 0.976 locomotion * height * type
locomotion * height * diameter type * diameter
Diam10,10 LOCO-C 22.73 35 0.946 locomotion * height * type type * diameter
locomotion * diameter height * diameter Diam10, 10–20,20 LOCO-C 34.59 48 0.927 locomotion * height * type
type * diameter locomotion * diameter height * diameter
Subset C (behavior) Diam4, 4–10,10 LOCO-C 61.32 74 0.854 locomotion * behavior * type type * diameter
locomotion * diameter Diam4, 4–10, 10–20,20 LOCO-C 62.25 75 0.854 locomotion * behavior *
diameter type * diameter locomotion * type behavior * type Diam4,4 LOCO-B 47.54 57 0.810 locomotion * behavior *
diameter type * diameter locomotion * type behavior * type
1DF, degrees of freedom.
TABLE 7. The ten overall best-fitting models for support analysis1
Model rank
Diameter classification (DIAM)
Locomotor classification (LOCO)
Significance level (P)
Degrees of freedom
Sampling zeros (%)
1 (10, 10–20,20) A 0.832 85 27
2 (10, 10–20,20) B 0.792 69 28
3 (10, 10–20,20) C 0.759 69 28
4 (10, 10–20,20) E 0.752 69 28
5 (10, 10–20,20) F 0.724 69 28
6 (4, 4–10, 10–20,20) C 0.694 109 30
7 (10,10) F 0.691 47 23
8 (10, 10–20,20) D 0.660 69 25
9 (10,10) C 0.650 55 24
10 ((4, 4–10, 10–20,20) B 0.649 109 30
1Significance levels, degrees of freedom, and sampling zeros are mean values calculated for subsets A (“age-sex”)
501.02, DF623,P 0.0001); and all three-way interactions (2: 189.99, DF
422,P1.000). This implies that when all variables are modelled, the relationships between the variables are described sufficiently by all two-way associations. While these results are not reliable in terms of model selection (as the high significance levels for all two-way and all three-way models are a reflection of the large number of sampling zeros rather than an accurate representation of the fit of the model), they do imply that the addition of the support data, to some extent, resolves the complex (i.e., three- and four-way) vari-able interactions in the basic model, into a series of simpler two-way associations between variables.
RESULTS
Descriptive data
Descriptive statistics are not the focus of this pa-per, and will be described in detail elsewhere. How-ever, to summarize the main results, orangutan lo-comotion is dominated by orthograde suspension, which accounts for 48% of the total locomotor reper-toire. Orangutans are 2.4 times more likely to ex-hibit orthograde suspension than vertical climb/de-scent, nearly 3 times more likely to exhibit orthograde suspension than quadrupedalism, and over 7 times more likely to do so than to exhibit pronograde suspension and oscillation. With regard to the age-sex category, 47% of observed locomotor bouts sampled behavior of immature individuals, 35% adult females, and 19% adult and subadult males. Sixty-six percent of locomotion took place below 20 m, and orangutans spent 27% of locomotor bouts feeding and 71% travelling. Finally, 59% of observed bouts utilized more than one support for weight-bearing.
Influences on locomotion
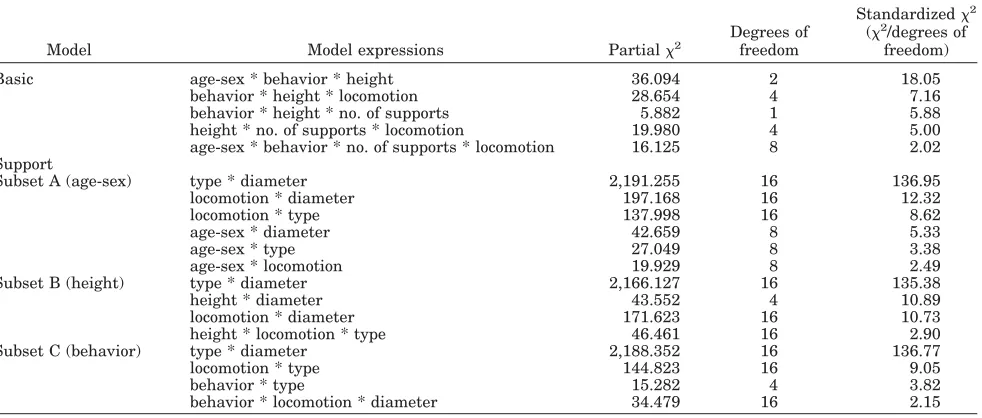
The variable relationships in the larger dataset (i.e., the basic analysis; Table 8) indicate that loco-motion is influenced by height, behavior, number of supports, and age-sex category. The magnitude of the association between locomotion and height dif-fers according to whether orangutans are travelling or feeding (behavior * height * locomotion, Table 8). The number of supports used for different locomotor modes differs when moving above or below 20 m (height * no. of supports * locomotion, Table 8). The existence of a second-order interaction (age-sex * behavior * no. of supports * locomotion, Table 8) shows that the number of supports used for each locomotor mode in travel and feeding differs accord-ing to the age-sex category of the individual. Overall height and behavior are conditionally dependent, given age-sex (age-sex * behavior * height, Table 8), locomotion (behavior * height * locomotion, Table 8), or number of supports (behavior * height * no. of supports, Table 8). Only the variable age-sex isnot in a three-way interaction with locomotion. This suggests that when the associations between all variables are taken into account, the age-sex cate-gory of the individual has limited influence on the observed locomotor repertoire. The magnitude of the standardized2values associated with the interac-tions of the different variables (Table 8) shows that the combined influence of height and behavior ac-counts for more of the variation in locomotion than the combined influence of height and number of supports, and has over three times more influence than the interaction between age-sex category, no. of supports, and behavior. However the interaction “age-sex * height * behavior” is over twice as impor-tant as the most imporimpor-tant expression for locomo-TABLE 8. Models of best fit and associated standardized2values1
Model Model expressions Partial2
Degrees of freedom
Standardized2 (2/degrees of
freedom)
Basic age-sex * behavior * height 36.094 2 18.05 behavior * height * locomotion 28.654 4 7.16 behavior * height * no. of supports 5.882 1 5.88 height * no. of supports * locomotion 19.980 4 5.00 age-sex * behavior * no. of supports * locomotion 16.125 8 2.02 Support
Subset A (age-sex) type * diameter 2,191.255 16 136.95 locomotion * diameter 197.168 16 12.32
locomotion * type 137.998 16 8.62
age-sex * diameter 42.659 8 5.33
age-sex * type 27.049 8 3.38
age-sex * locomotion 19.929 8 2.49
Subset B (height) type * diameter 2,166.127 16 135.38
height * diameter 43.552 4 10.89
locomotion * diameter 171.623 16 10.73 height * locomotion * type 46.461 16 2.90 Subset C (behavior) type * diameter 2,188.352 16 136.77
locomotion * type 144.823 16 9.05
behavior * type 15.282 4 3.82
behavior * locomotion * diameter 34.479 16 2.15
1Large standardized
tion. The second-order interaction “age-sex * behav-ior * no. of supports * locomotion” has a very low standardized chi-squared value, indicating that the magnitude of the relationships between these vari-ables is rather weak.
Interaction effects (Table 8) for the smaller data-set, the support analysis, show that all tested vari-ables do influence locomotion in some form. Al-though “support type * diameter” is the only association common to all models, we can see that locomotion has a two-way (direct) association with age-sex category, support type, and support diame-ter (subset A, “age-sex”). However, the relationship between locomotion and support type differs when moving above and below 20 m (subset B, “height”). Similarly, the association between locomotion and support diameter when travelling differs from that when feeding (subset C, “behavior”). Comparison of the standardized2values associated with variable interactions (Table 8, subsets A–C) shows that the association “support-type * diameter” is over 11 times stronger than the next expression. When age-sex (subset A) and height (subset B) are included in the analysis, support diameter appears to be the most important influence on locomotion. It is five times more important than age-sex category, and slightly more important than support type in subset A, and over 4 times more important than the com-bined influence of type * height in subset B. In contrast, when contextual behavior is considered (subset C), support type is over 4 times more impor-tant than the combined influence of diameter * be-havior. This may be related to the fact that the subset C (“behavior”) data were found to be better described when diameter was reclassified to recog-nize a 4-cm demarcation.
Support type and diameter
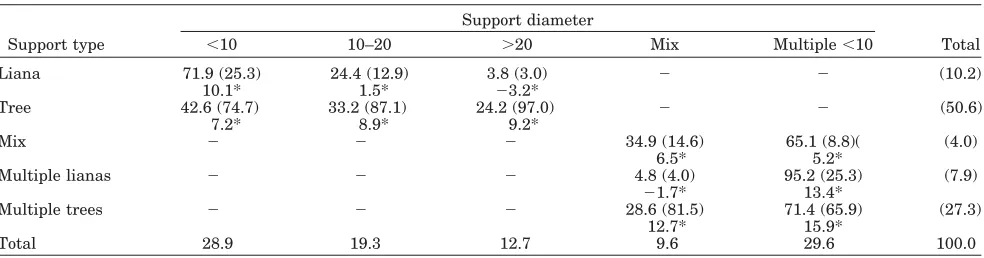
Seventy-eight percent of all locomotion takes place only on trees (branches, boughs, and trunks), with 51% on single tree supports and 27% on mul-tiple tree supports (Table 9). Odds ratios calculated from the same contingency table show that the use
of a single tree support occurs almost 5 times as often as the use of a single liana, over 6 times as often as the use of multiple lianas, and over 12 times as often as the use of mixed tree and liana supports. Overall, the most utilized diameter category was “multiple⬍10 cm,” with an odds ratio of 3.1 over the
least used category, “mixed,” indicating that oran-gutans are over 3 times more likely to utilize multi-ple supports under 10 cm than multimulti-ple supports of different diameters. The study subjects tended to use “⬍10 cm” and “multiple ⬍10 cm” in a similar proportion, but when using one support, orangutans are 1.5 and 2.3 times, respectively, more likely to use “⬍10 cm” than “10 –20 cm” and “⬎20 cm.” Overall,
nearly 60% of locomotion relied exclusively on sup-ports of⬍10 cm in diameter (Table 9, column total
for “⬍10 cm” and “multiple⬍10 cm”).
Analysis of contingency tables
We see in Table 8 that support diameter is the most important influence on observed locomotor rep-ertoire, when support characteristics are included in the analysis. Table 10 gives details on this relation-ship, and to highlight our interpretative technique, we discuss this contingency table in detail, together with related material on support type and locomo-tion in Table 11, and on the three-way interaclocomo-tion between behavior, locomotion, and support diameter (Table 12). An identical interpretation of Tables 13–15 and Figures 1–5, which present the relation-ship between the age-sex category and associated variables, is the source of other similar relationships highlighted in the Discussion.
Locomotion * diameter
Orthograde suspension is by far the most prevalent form of locomotion for all diameter categories except “⬎20 cm,” where levels are substantially reduced and quadrupedalism is twice as likely to be exhibited (Ta-ble 10, column percentages). Orthograde suspension is particularly associated with single supports of⬍10 cm
diameter, and is between 4 – 8 times more likely to be exhibited than comparable locomotor modes
(“quadru-TABLE 9. Contingency table for support model association: type*diameter1
Support type
Support diameter
Total
⬍10 10–20 ⬎20 Mix Multiple⬍10
Liana 71.9 (25.3) 24.4 (12.9) 3.8 (3.0) ⫺ ⫺ (10.2)
10.1* 1.5* ⫺3.2*
Tree 42.6 (74.7) 33.2 (87.1) 24.2 (97.0) ⫺ ⫺ (50.6)
7.2* 8.9* 9.2*
Mix ⫺ ⫺ ⫺ 34.9 (14.6) 65.1 (8.8)( (4.0)
6.5* 5.2*
Multiple lianas ⫺ ⫺ ⫺ 4.8 (4.0) 95.2 (25.3) (7.9)
⫺1.7* 13.4*
Multiple trees ⫺ ⫺ ⫺ 28.6 (81.5) 71.4 (65.9) (27.3)
12.7* 15.9*
Total 28.9 19.3 12.7 9.6 29.6 100.0
1Entries are row % and (column %) for each type * diameter unit, e.g., for locomotion on lianas with diameters of
pedalism,” “pronograde suspend,” and “oscillation”) on multiple supports ⬍10 cm in diameter (“multiple
⬍10,” Table 10). “Oscillation” also shows strong asso-ciations with supports of ⬍10 cm (both single and
multiple), occurring infrequently or not at all on the other diameter categories.
We can further see that “quadrupedalism” is strongly associated with larger, single supports (a
TABLE 10. Contingency table for support model association: locomotion*diameter1
Locomotion
Support diameter
Total
⬍10 10–20 ⬎20 Mix Multiple⬍10
Quadrupedalism 13.5 (9.9) 29.4 (32.3) 27.0 (45.2) 10.2 (22.5) 19.8 (14.2) (21.2)
⫺5.2* 4.2* 7.4* 0.4* ⫺3.3*
Oscillation 40.8 (6.8) 1.3 (0.3) 0.0 (0.0) 3.9 (2.0) 53.9 (8.8) (4.8)
1.9* ⫺3.6* ⫺3.1* ⫺1.6* 3.9*
Orthograde suspend 35.2 (54.2) 17.2 (39.6) 6.4 (22.6) 8.9 (41.1) 32.3 (48.5) (44.4)
3.1* ⫺1.3* ⫺4.6* ⫺0.6* 1.3*
Pronograde suspend 32.0 (6.8) 23.7 (7.6) 10.3 (5.0) 5.2 (3.3) 28.9 (6.0) (6.2)
0.6* 1.0* ⫺0.6* ⫺1.4* ⫺0.1*
Vertical climb/descent 27.4 (22.2) 16.6 (20.1) 14.7 (27.1) 12.8 (31.1) 28.5 (22.5) (23.4)
⫺0.5* ⫺1.2* 1.1* 2.0* ⫺0.4*
Total 28.9 19.3 12.7 9.6 29.6 100.0
1For explanation of table, see Table 9.
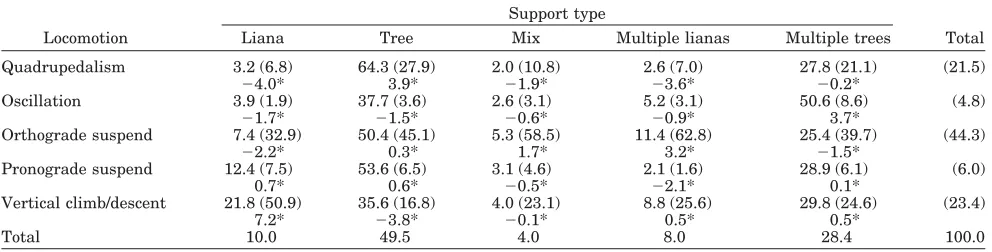
TABLE 11. Contingency table for support model association: locomotion*type1
Locomotion
Support type
Total
Liana Tree Mix Multiple lianas Multiple trees
Quadrupedalism 3.2 (6.8) 64.3 (27.9) 2.0 (10.8) 2.6 (7.0) 27.8 (21.1) (21.5)
⫺4.0* 3.9* ⫺1.9* ⫺3.6* ⫺0.2*
Oscillation 3.9 (1.9) 37.7 (3.6) 2.6 (3.1) 5.2 (3.1) 50.6 (8.6) (4.8)
⫺1.7* ⫺1.5* ⫺0.6* ⫺0.9* 3.7*
Orthograde suspend 7.4 (32.9) 50.4 (45.1) 5.3 (58.5) 11.4 (62.8) 25.4 (39.7) (44.3)
⫺2.2* 0.3* 1.7* 3.2* ⫺1.5*
Pronograde suspend 12.4 (7.5) 53.6 (6.5) 3.1 (4.6) 2.1 (1.6) 28.9 (6.1) (6.0)
0.7* 0.6* ⫺0.5* ⫺2.1* 0.1*
Vertical climb/descent 21.8 (50.9) 35.6 (16.8) 4.0 (23.1) 8.8 (25.6) 29.8 (24.6) (23.4)
7.2* ⫺3.8* ⫺0.1* 0.5* 0.5*
Total 10.0 49.5 4.0 8.0 28.4 100.0
1For explanation of table, see Table 9.
TABLE 12. Contingency table for support model interaction: behavior*locomotion*diameter1
Behavior Locomotion
Support diameter
Total
⬍10 10–20 ⬎20 Mix Multiple⬍10
Travel Quadrupedalism 16.2 (10.0) 25.0 (25.6) 29.9 (45.2) 6.4 (14.0) 22.5 (13.7) (18.6)
⫺3.7* 2.3* 7.1* ⫺1.0* ⫺2.1*
Oscillation 42.9 (9.1) 1.4 (0.5) 0.0 (0.0) 4.3 (3.2) 51.4 (10.7) (6.4)
1.9* ⫺3.3* ⫺2.9* ⫺1.2* 3.1*
Orthograde suspend 35.0 (55.0) 16.9 (44.2) 6.0 (23.0) 8.8 (49.5) 33.3 (51.5) (47.5)
2.0* ⫺0.7* ⫺4.1* 0.3* 1.1*
Pronograde suspend 31.9 (6.6) 17.4 (6.0) 11.6 (5.9) 7.2 (5.4) 31.9 (6.5) (6.3)
0.2* ⫺0.2* ⫺0.2* ⫺0.4* 0.2*
Vertical climb/descent 27.7 (19.3) 20.3 (23.6) 15.2 (25.9) 11.3 (28.0) 25.5 (17.6) (21.1)
⫺0.7* 0.8* 1.2* 1.4* ⫺1.4*
Total 30.3 18.2 12.3 8.5 30.7 100.0
Feed Quadrupedalism 9.3 (9.8) 36.4 (45.2) 22.5 (45.3) 16.3 (36.2) 15.5 (15.4) (26.9)
⫺3.7* 3.6* 2.8* 1.4* ⫺2.5*
Oscillation 16.7 (0.8) 0.0 (0.0) 0.0 (0.0) 0.0 (0.0) 83.3 (3.8) (1.3)
⫺0.4* ⫺1.1* ⫺0.9* ⫺0.9* 2.6*
Orthograde suspend 35.8 (52.0) 17.9 (30.8) 7.8 (21.9) 8.9 (27.6) 29.6 (40.8) (37.4)
2.7* ⫺1.1* ⫺2.0* ⫺1.2* 0.6*
Pronograde suspend 32.1 (7.3) 39.3 (10.6) 7.1 (3.1) 0.0 (0.0) 21.4 (4.6) (5.8)
0.7* 2.0* ⫺0.9* ⫺1.8* ⫺0.6*
Vertical climb/descent 27.0 (30.1) 10.2 (13.5) 13.9 (29.7) 15.3 (36.2) 33.6 (35.4) (28.6)
0.3* ⫺2.9* 0.2* 1.1* 1.4*
Total 25.7 21.7 13.4 12.1 27.1 100.0
1Entries are row % and (column %) for behavior * locomotion * diameter unit, e.g., for quadrupedalism on
total of 56% occurring on diameters “10 –20 cm” and “20 cm,” Table 10, row percentages), but less common than expected (Table 10, negative values for standardized cell residuals (SCRs)) on single and multiple supports 10 cm in diameter. It is 4.2 and 2.8 times more likely to be exhibited on a single support of10 cm than on a single support of 10 cm and multiple supports of 10 cm, re-spectively.
Since “vertical climb/descent” can only occur in a vertical plane, its relative frequency is of course not directly comparable to the other locomotor modes.
When climbing or descending vertically, orangutans tend to use single supports of “10-cm diameter” and “multiple 10-cm” diameter supports relatively equally, with these diameter categories being 1.6, 1.9, and 2.2 times more likely to be associated with climbing than “10 –20-cm,” “20-cm,” and “mixed” diameters, respectively (Table 10, row percentages). However, vertical climbing represents a larger pro-portion of the total locomotor repertoire on mixed supports than on other support diameters, account-ing for 31% of locomotion on mixed supports (Table 10, column percentages).
TABLE 13. Contingency table for basic model interaction: behavior*height*locomotion1
Behavior Locomotion
Height
Total
20 m 20 m
Travel Quadrupedalism 63.5 (13.4) 36.5 (20.3) (15.3)
1.9* 3.0*
Oscillation 77.8 (8.5) 22.2 (6.4) (7.9)
0.8* 1.3*
Orthograde suspend 74.2 (52.5) 25.8 (48.1) (51.3)
0.6* 1.0*
Pronograde suspend 71.2 (6.8) 28.8 (7.3) (6.9)
0.2* 0.3*
Vertical climb/descent 73.5 (18.8) 26.5 (18.0) (18.6)
0.2* 0.3*
Total 72.5 27.5 100.0
Feed Quadrupedalism 27.6 (13.7) 72.4 (33.8) (24.0)
4.0* 3.9*
Oscillation 100.0 (3.0) 0.0 (0.0) (1.5)
2.4* 2.4*
Orthograde suspend 48.7 (40.7) 51.3 (40.5) (40.6)
0.0* 0.0*
Pronograde suspend 46.3 (5.2) 53.7 (5.7) (5.4)
0.2* 0.2*
Vertical climb/descent 63.7 (37.4) 36.3 (20.1) (28.5)
3.2* 3.1*
Total 48.5 51.5 100.0
1For explanation of table, see Table 12.
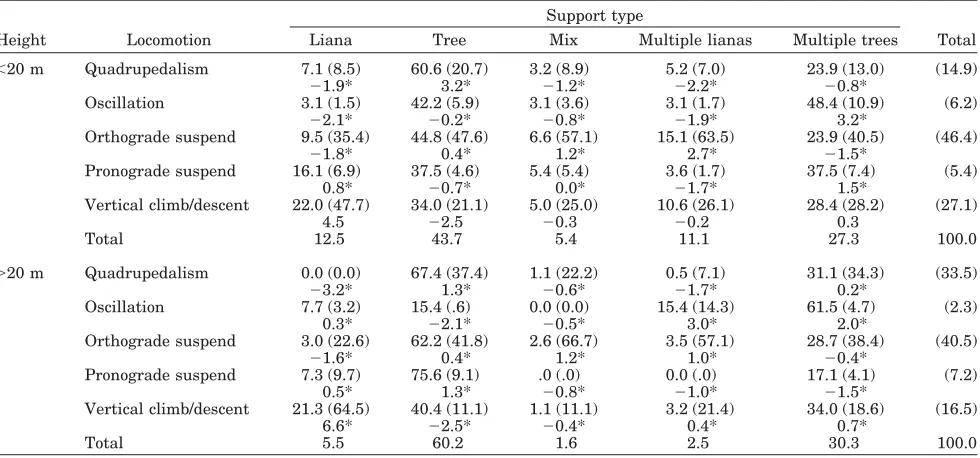
TABLE 14. Contingency table for support model interaction: height*locomotion*type1
Height Locomotion
Support type
Total
Liana Tree Mix Multiple lianas Multiple trees
20 m Quadrupedalism 7.1 (8.5) 60.6 (20.7) 3.2 (8.9) 5.2 (7.0) 23.9 (13.0) (14.9)
1.9* 3.2* 1.2* 2.2* 0.8*
Oscillation 3.1 (1.5) 42.2 (5.9) 3.1 (3.6) 3.1 (1.7) 48.4 (10.9) (6.2)
2.1* 0.2* 0.8* 1.9* 3.2*
Orthograde suspend 9.5 (35.4) 44.8 (47.6) 6.6 (57.1) 15.1 (63.5) 23.9 (40.5) (46.4)
1.8* 0.4* 1.2* 2.7* 1.5*
Pronograde suspend 16.1 (6.9) 37.5 (4.6) 5.4 (5.4) 3.61.7) 37.5 (7.4) (5.4)
0.8* 0.7* 0.0* 1.7* 1.5*
Vertical climb/descent 22.0 (47.7) 34.0 (21.1) 5.0 (25.0) 10.6 (26.1) 28.4 (28.2) (27.1)
4.5 2.5 0.3 0.2 0.3
Total 12.5 43.7 5.4 11.1 27.3 100.0
20 m Quadrupedalism 0.0 (0.0) 67.4 (37.4) 1.1 (22.2) 0.5 (7.1) 31.1 (34.3) (33.5)
3.2* 1.3* 0.6* 1.7* 0.2*
Oscillation 7.7 (3.2) 15.4 (.6) 0.0 (0.0) 15.4 (14.3) 61.5 (4.7) (2.3)
0.3* 2.1* 0.5* 3.0* 2.0*
Orthograde suspend 3.0 (22.6) 62.2 (41.8) 2.6 (66.7) 3.5 (57.1) 28.7 (38.4) (40.5)
1.6* 0.4* 1.2* 1.0* 0.4*
Pronograde suspend 7.3 (9.7) 75.6 (9.1) .0 (.0) 0.0 (.0) 17.1 (4.1) (7.2)
0.5* 1.3* 0.8* 1.0* 1.5*
Vertical climb/descent 21.3 (64.5) 40.4 (11.1) 1.1 (11.1) 3.2 (21.4) 34.0 (18.6) (16.5)
6.6* 2.5* 0.4* 0.4* 0.7*
Total 5.5 60.2 1.6 2.5 30.3 100.0
Locomotion * support type
Orthograde locomotion is the predominant mode for moving on all support types except single lianas, which shows a stronger relationship with vertical climb (odds ratio for vertical climb * liana / ortho-grade suspend * liana1.5, Table 11, column per-centages). The strongest correlation between “ortho-grade suspend” and support type is for multiple lianas (SCR 3.2), where orangutans are 9, 20.3, and 40.5 times more likely to exhibit “orthograde suspend” than “quadrupedal,” “oscillation,” and “pronograde suspend,” respectively. Pronograde sus-pension is distributed rather evenly among support types, except for “multiple lianas,” for which the proportion of “pronograde suspend” is rather low (negative SCR value).
When vertical climbing, orangutans are 1.6 and 4.1 times more likely to use a single tree support than a single liana or multiple lianas, respectively, and are 8.9 times more likely to use a single tree support than “mixed” support types (Table 11, row percentages). However, orangutans show a stronger affinity for vertical climbing on single lianas than any other locomotor mode (Table 11, SCR 7.2), and exhibit comparatively less vertical climbing on
single trees than other forms of locomotion (Table 11, SCR 3.8).
Locomotion * diameter * behavior
The association between locomotion and diameter (Table 10) changes somewhat when the behavioral context of the observed bout is also taken into ac-count (Table 12). Orthograde suspension is more associated with travel than with feeding, but the pattern of support diameter use for “orthograde sus-pend” does not differ substantially between behavior categories (Table 12, row percentages). For both “travel” and “feeding” there is a strong association between orthograde locomotion and supports of10 cm in diameter (as indicated by the large, positive SCRs in Table 12). In contrast, there is a poor asso-ciation between orthograde locomotion and supports of 20 cm in diameter (as indicated by the large, negative SCRs), where there is a preference for qua-drupedalism in both behavior categories (as indi-cated by the large, positive SCRs in Table 12).
“Oscillation” is also more associated with travel than with feeding, particularly for supports “10 cm,” where oscillation is 11 times more likely to be exhibited in travel rather than feeding (column per-centages). Levels of oscillation are also high for “10 cm combined” relative to levels for the other diame-ter categories for both the “20 m” and “20 m” height categories.
The association between “quadrupedalism” and larger single supports is apparent in both behavior categories, but particularly for “20 cm” in “travel” (SCR7.1) and “10 –20cm” in “feeding” (SCR3.6). Similarly, the lower than expected frequency for single and multiple supports of10 cm is also re-flected in both “travel” and “feeding.” For “10 cm,” “20 cm,” and “multiple10 cm,” “quadrupedalism” is exhibited in approximately the same proportions in both “travel” and “feeding.” However, for “10 –20 cm” and “mixed” supports, it has a more dominant role in “feeding” than in “travel,” being 1.8 and 2.6 times (respectively) more likely to be exhibited.
Pronograde suspension is exhibited at near pre-dicted frequency on all support diameters during “travel,” but shows a stronger association with loco-motion on single supports of 10 –20 cm during “feed-ing” (SCRs). When feeding, orangutans ascend and descend most commonly on “10-cm” and “multiple
10-cm” supports, but frequencies for travelling are less than predicted (SCRs). The frequency for climb-ing on sclimb-ingle supports of “10 –20 cm” durclimb-ing feedclimb-ing is low (SCR 2.9), both in comparison to the higher than expected frequency of vertical climbing for diameter “10 –20 cm” when travelling (SCR
0.8), and in comparison to the average probability of vertical climbing in feeding.
DISCUSSION
The way in which variables are categorized for statistical analysis directly influences the nature of TABLE 15. Contingency table for support model
association: height*diameter1
Support diameter
Height
Total
20 m 20 m
10 73.8 (32.7) 26.2 (21.6) (28.9)
2.3* 3.2*
10–20 54.5 (16.1) 45.5 (25.1) (19.3)
2.3* 3.1*
20 42.2 (8.2) 57.820.9) (12.7)
4.0* 5.4*
Mix 57.0 (8.4) 43.0 (11.8) (9.6)
1.2* 1.7*
Multiple10 75.8 (34.5) 24.2 (20.5) (29.6)
2.9* 3.9*
Total 65.0 35.0 100.0
1For explanation of table, see Table 9.
relationships found between variables. As a conse-quence of the detail in which field data were col-lected in this study, we were able to experiment with variable classifications ranging in complexity, and identify those which exposed the main multivariate
data trends, with some interesting results. Log-lin-ear models which combine subadult males with adult males consistently result in better-fitting mod-els than those which combine subadult males with adult females, or separate them into an individual category to highlight size-related trends. This sug-Fig. 3. Basic model interaction: age-sex * behavior * locomotion * no. of supports. Values in boxes are standardized cell residuals. Q, quadrupedalism; OS, oscillation; OR, orthograde suspension; PR, pronograde suspension; VC, vertical climb/descent.
Fig. 4. Support model association: age-sex * diameter. Values in boxes are standardized cell residuals.
gests that adult male locomotor patterns begin to develop prior to the development of transitional sec-ondary sexual characteristics such as cheek flanges and increased body mass, but after the onset of sexual activity.
Our results (“basic analysis”) also show that the number of supports used is best understood when multiple supports are combined into a single cate-gory. This suggests that while orangutans adopt a different approach to locomotion on multiple sup-ports from that used for one support, it does not change whether they are moving on two reasonably large supports or handfuls of foliage. This result further highlights the importance of analyzing all supports used, rather than focusing on the main weight-bearing support (as did Cant, 1987a) when addressing differences in support use of large-bodied arboreal animals: fully 59% of orangutan locomotion involves the use of more than one support.
We noted above that the three models of best fit for subset A (“age-sex”) and subset B (“height”) and the five overall models of best fit for the support analysis (Table 8) incorporate support diameters de-fined in 10 cm intervals, whereas the three models of best fit for subset C (“behavior”) incorporate the 4 cm demarcation. This implies that smaller supports are more critical to observed differences in behavior than they are to differences in the height of observed locomotion or to the differences in locomotor reper-toires of different age-sex categories.
Locomotion
Orthograde suspension dominates orangutan lo-comotion, as Cant (1987a) showed. It is used to resolve habitat problems associated with moving on both single and multiple small supports (⬍10 cm) (Table 10), and plays a slightly larger role in travel than in feeding (Tables 12 and 13). It is used in a comparable way above and below 20 m, except that the standardized cell residuals indicate that it plays a particular role in traversing multiple lianas below 20 m (Table 14).
Oscillatory locomotion is essentially a travel mode which is strongly associated with single and multi-ple supports of⬍10 cm in diameter (Table 10). How-ever, since it is reliant on support compliance, it is by definition restricted to these smaller-diameter supports. Orangutans oscillate both trees and lianas during locomotion. Tree and branch sway were pre-viously documented by Mackinnon (1974), Sugard-jito (1982), SugardSugard-jito and van Hooff (1986), and Cant (1987a,b, 1994). However, only Mackinnon (1974) previously recorded (although not quantified) liana sway, which is a “Tarzan”-type movement in which the orangutan swings horizontally on one or more vertical lianas with increasing amplitude to reach the next support. Orangutans tend to favor multiple tree supports for oscillatory locomotion both above and below 20 m, although above 20 m there is also a strong association with multiple li-anas (Table 14, column percentages). The use of
multiple supports enables them to distribute their weight onto a number of different supports to max-imize the magnitude of oscillation. This preference is likely to be influenced by support distribution. Below 20 m there are a multitude of young trees, which may be oscillated about the trunk, whereas, above 20 m, the number of compliant trunks is con-siderably reduced, and orangutans must oscillate parts of trees (boughs or branches) or vertical lianas. Levels of oscillation in travel are comparable to those observed by Cant (1987a) and by Sugardjito and van Hooff (1986), except that the latter authors found levels of oscillation for adult males to be over twice as high as in the present study. In our study, adult males tended to remain comparatively high in the canopy (Fig. 1), and since oscillation is predom-inantly associated with travel below 20 m (Table 13), our results show relatively low frequencies of oscil-lation in adult and subadult males. This contrast should be interpreted with some caution, however, as there are differences in methodology. Further-more, the results of Sugardjito and van Hooff (1986) referred to the locomotor behavior of a single adult male, whereas our data combine 3 subadult males and 2 adults. These show substantial difference be-tween individuals, with oscillation accounting for 16% of Bobby’s locomotor repertoire, 10% of the un-identified adult male’s (AM2’s), and an average of only 5.5% for the subadult males, which is less than that of adult females and immature individuals. It is therefore likely that the single adult male of Sug-ardjito and van Hooff (1986) exhibited a particular preference for this mode of locomotion.
Quadrupedalism is strongly associated with sta-ble single supports of⬎10 cm in diameter, occurring notably less than expected for single and multiple supports of⬍10 cm (Table 10). Its strong association with tree supports (Table 11) is presumably because of the lack of horizontally oriented lianas, and be-cause tree supports reach much larger diameters, which is clearly preferable for quadrupedal locomo-tion (indeed, this is one reason why captive orangu-tans appear more quadrupedal, as cage furniture is often rigid, e.g., as in Crompton et al., 2003). It is exhibited more in feeding than in travel (Table 12), and is performed twice as often above 20 m as below (Table 14). In the “basic model,” quadrupedalism is more associated with movement above 20 m than any other locomotor mode, for both travel and feed-ing, with the association being particularly strong for feeding above 20 m (Table 13).
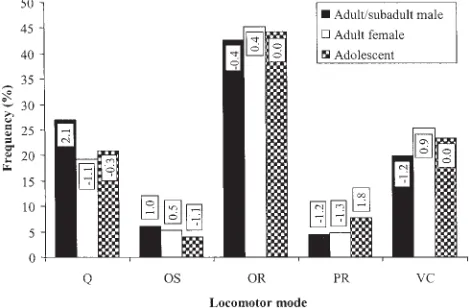
Pronograde suspension accounts for only 6.5% of overall locomotor repertoire and does not show a strong association with any particular support di-ameter, except for single supports of 10 –20 cm dur-ing feeddur-ing (Table 12). Theoretical predictions of the relationship between positional behavior and body mass, which imply that larger animals should sus-pend more than smaller ones (Cartmill and Milton, 1977), are not borne out by results for orthograde and pronograde suspension in this study. There are no age-sex-related differences in the use of ortho-grade suspension (Fig. 2, support analysis), and im-mature individuals use pronograde suspension sig-nificantly more than adult males and females. Indeed, in the “basic” analysis, during travel on one support, immature males and females exhibited nearly three times the amount that adult and subadult males did (Fig. 3). For feeding, the result is less clear. Immature subjects and adult/subadult males exhibited relatively similar levels of prono-grade suspension, both for one and multiple sup-ports, but adult females exhibited almost half as much for one support and over twice as much for multiple supports.
Vertical climb/descent accounts for almost a quar-ter of all observed locomotion, and is slightly more associated with feeding than with travel (Table 12). When feeding, orangutans show a stronger prefer-ence for ascending and descending on single and multiple supports of⬍10 cm in diameter than when travelling (Table 12), and exhibit a stronger associ-ation with lianas than does any other locomotor mode (Table 14). This may largely reflect an ob-served preference of orangutans to enter the emer-gent canopy of very large fruiting trees by approach-ing the tree on a relatively low level and ascendapproach-ing via associated vertical lianas and aerial roots. Note that Cant (1992) proposed that the ability of oran-gutans to access the canopies of large trees by as-cending associated vertical lianas identified orangu-tans as the most effective Sumatran primate in negotiating large vertical supports.
Overall locomotor classifications incorporating a larger number of categories result in higher levels of significance than those which identify fewer catego-ries, although conflating locomotor modes to suspen-sion or compressuspen-sion and orthograde or pronograde (Table 4) does result in reasonably well-fitting mod-els. Hunt et al. (1996) suggested that all ascent on supports angled atⱖ45° should be classified as ver-tical climb, in order to bring increased uniformity to locomotor classifications. However, our results im-ply that for orangutans, the relationship between support use and angled climb/descent (20°– 45°) dif-fers from that of climb/descent within 20° of true vertical, and is thus better classified as an extension of orthograde suspension. For smaller arboreal quadrupeds, differences in climbing behavior on an-gled and vertical supports are probably much less pronounced.
Cant (1987a) reported that in all apparent bouts of locomotor bipedalism, substantial weight was sus-pended from the forelimbs (although he did observe bipedal postures during feeding). He accordingly subsumed bipedal locomotion with “orthograde clamber.” In the present study, 46 bouts of bipedal behavior (1.7% of total locomotor repertoire) oc-curred where the forelimbs were only used to pro-vide balance and did not support more than their own body mass. Following the suggestion of Hunt et al. (1996) that identifying which limbs support the greatest proportion of body mass is crucial in loco-motor studies, we regard it as important to distin-guish “orthograde clamber” (a submode of “ortho-grade suspend”), where the majority of body mass is suspended from the forelimbs with some support from the hindlimbs, from “hand-assisted bipedal-ism,” where the majority of body mass is supported by the hindlimbs in compression, with some support from the forelimbs. Using this distinction, a further 158 hand-assisted bipedal bouts (5.6% of total loco-motor repertoire) were identified, giving a total 7% of bipedalism sensu lato.However, when we look at orangutan bipedalism interms of its relationship to support use and contextual behavior, it is indeed more accurately considered to be an extension of “orthograde clamber” rather than an independent locomotor mode: the locomotor classification we find is the best overall descriptor of the relationship of locomotion to other variables,Loco-Ccombines both angled vertical climb and bipedalism with ortho-grade suspension (because of their positional simi-larity to the submode orthograde clamber; see Table 1), suggesting that these locomotor modes do not differ substantially in their relationships with other variables in the study. Thus, the locomotor catego-ries one uses need to be defined in relation to the research questions to be asked in a given study. An ability to distinguish bipedalism from orthograde clamber at least in the raw dataset is important, since this study suggests that the functional precur-sor of hominid bipedalism may well have been or-thograde clamber (see Crompton et al., 2003).
Age-sex and body size