Enterprise Analytics
Optimize Performance, Process, and Decisions Through Big Data
Vice President, Publisher: Tim Moore
Associate Publisher and Director of Marketing: Amy Neidlinger Executive Editor: Jeanne Glasser Levine
Editorial Assistant: Pamela Boland Operations Specialist: Jodi Kemper Marketing Manager: Megan Graue Cover Designer: Chuti Prasertsith Managing Editor: Kristy Hart Senior Project Editor: Lori Lyons Copy Editor: Gayle Johnson
Proofreader: Chrissy White, Language Logistics, LLC Indexer: Cheryl Lenser
Compositor: Nonie Ratcliff Manufacturing Buyer: Dan Uhrig
© 2013 by International Institute for Analytics Pearson Education, Inc.
Publishing as FT Press
Upper Saddle River, New Jersey 07458
This book is sold with the understanding that neither the author nor the publisher is engaged in rendering legal, accounting, or other professional services or advice by publishing this book. Each individual situation is unique. Thus, if legal or financial advice or other expert assistance is required in a specific situation, the services of a competent professional should be sought to ensure that the situation has been evaluated carefully and appropriately. The author and the publisher disclaim any liability, loss, or risk resulting directly or indirectly, from the use or application of any of the contents of this book.
FT Press offers excellent discounts on this book when ordered in quantity for bulk purchases or special sales. For more information, please contact U.S. Corporate and Government Sales, 1-800-382-3419, [email protected]. For sales outside the U.S., please contact International Sales at [email protected].
Company and product names mentioned herein are the trademarks or registered trademarks of their respective owners.
All rights reserved. No part of this book may be reproduced, in any form or by any means, without permission in writing from the publisher.
Printed in the United States of America First Printing September 2012
ISBN-10: 0-13-303943-9 ISBN-13: 978-0-13-303943-6 Pearson Education LTD.
Pearson Education Canada, Ltd.
Pearson Educación de Mexico, S.A. de C.V. Pearson Education—Japan
Pearson Education Malaysia, Pte. Ltd.
Library of Congress Cataloging-in-Publication Data
Enterprise analytics : optimize performance, process, and decisions through big data / [edited by] Thomas H. Davenport.
p. cm.
ISBN 978-0-13-303943-6 (hardcover : alk. paper)
1. Business intelligence. 2. Decision making. 3. Management. I. Davenport, Thomas H.,
HD38.7.E557 2013 658.4’038--dc23
Contents at a Glance
Foreword and Acknowledgments
Jack Phillips
About the Authors
Introduction: The New World of Enterprise Analytics
Thomas H. Davenport
Part I Overview of Analytics and Their Value
Chapter 1 What Do We Talk About When We Talk About Analytics?
Thomas H. Davenport
Chapter 2 The Return on Investments in Analytics
Keri E. Pearlson
Part II Application of Analytics
Chapter 3 Leveraging Proprietary Data for Analytical Advantage
Thomas H. Davenport
Chapter 4 Analytics on Web Data: The Original Big Data
Bill Franks
Chapter 5 The Analytics of Online Engagement
Eric T. Peterson
Chapter 6 The Path to “Next Best Offers” for Retail Customers
Thomas H. Davenport, John Lucker, and Leandro DalleMule
Part III Technologies for Analytics
Chapter 7 Applying Analytics at Production Scale
James Taylor
Chapter 8 Predictive Analytics in the Cloud
James Taylor
Chapter 9 Analytical Technology and the Business User
Thomas H. Davenport
Chapter 10 Linking Decisions and Analytics for Organizational Performance
Thomas H. Davenport
Part IV The Human Side of Analytics Chapter 11 Organizing Analysts
Chapter 12 Engaging Analytical Talent
Jeanne G. Harris and Elizabeth Craig
Chapter 13 Governance for Analytics
Stacy Blanchard and Robert F. Morison
Chapter 14 Building a Global Analytical Capability
Thomas H. Davenport
Part V Case Studies in the Use of Analytics Chapter 15 Partners HealthCare System
Thomas H. Davenport
Chapter 16 Analytics in the HR Function at Sears Holding Corporation
Carl Schleyer
Chapter 17 Commercial Analytics Culture and Relationships at Merck
Thomas H. Davenport
Chapter 18 Descriptive Analytics for the Supply Chain at Bernard Chaus, Inc.
Katherine Busey and Callie Youssi
Contents
Foreword and Acknowledgments About the Authors
Introduction: The New World of Enterprise Analytics
Part I Overview of Analytics and Their Value
Chapter 1 What Do We Talk About When We Talk About Analytics?
Why We Needed a New Term: Issues with Traditional Business Intelligence Three Types of Analytics
Where Does Data Mining Fit In?
Business Analytics Versus Other Types Web Analytics
Big-Data Analytics Conclusion
Chapter 2 The Return on Investments in Analytics
Traditional ROI Analysis
The Teradata Method for Evaluating Analytics Investments An Example of Calculating the Value
Analytics ROI at Freescale Semiconductor
Part II Application of Analytics
Chapter 3 Leveraging Proprietary Data for Analytical Advantage
Issues with Managing Proprietary Data and Analytics Lessons Learned from Payments Data
Endnote
Chapter 4 Analytics on Web Data: The Original Big Data
Web Data Overview What Web Data Reveals Web Data in Action Wrap-Up
Chapter 5 The Analytics of Online Engagement
The Definition of Engagement
Engagement Analytics at PBS
Engagement Analytics at Philly.com
Chapter 6 The Path to “Next Best Offers” for Retail Customers
Analytics and the Path to Effective Next Best Offers Offer Strategy Design
Know Your Customer Know Your Offers
Know the Purchase Context
Analytics and Execution: Deciding on and Making the Offer Learning from and Adapting NBOs
Part III Technologies for Analytics
Chapter 7 Applying Analytics at Production Scale
Decisions Involve Actions Time to Business Impact
Business Decisions in Operation Compliance Issues
Data Considerations
Example of Analytics at Production Scale: YouSee Lessons Learned from Other Successful Companies Endnote
Chapter 8 Predictive Analytics in the Cloud
Business Solutions Focus Five Key Opportunities The State of the Market Pros and Cons
Adopting Cloud-Based Predictive Analytics Endnote
Chapter 9 Analytical Technology and the Business User
Separate but Unequal Staged Data
Multipurpose
Generally Complex
Premises-and Product-Based Industry-Generic
Business Unit-Driven Specialized Vendors
Problems with the Current Model
Changes Emerging in Analytical Technology Creating the Analytical Apps of the Future Summary
Chapter 10 Linking Decisions and Analytics for Organizational Performance
A Study of Decisions and Analytics Linking Decisions and Analytics
A Process for Connecting Decisions and Information Looking Ahead in Decision Management
Endnotes
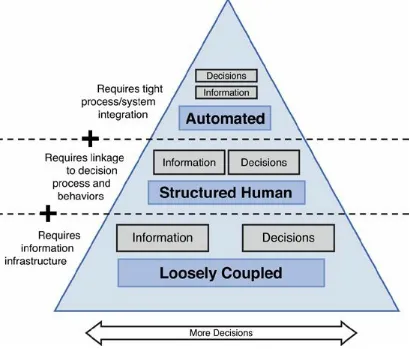
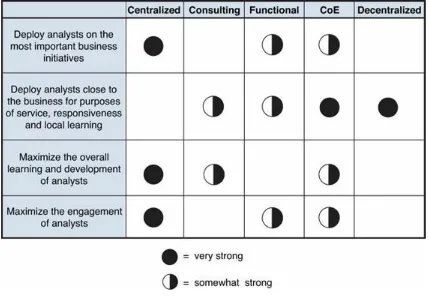
Part IV The Human Side of Analytics Chapter 11 Organizing Analysts
Why Organization Matters
General Goals of Organizational Structure Goals of a Particular Analytics Organization Basic Models for Organizing Analysts
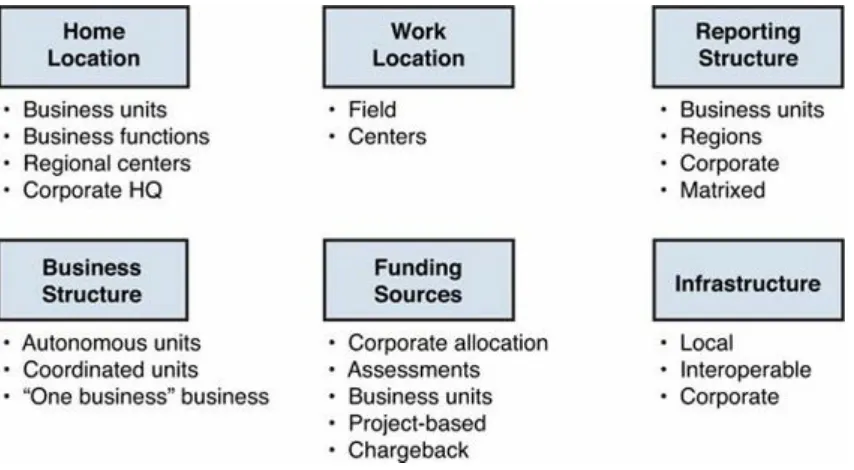
Coordination Approaches
What Model Fits Your Business? How Bold Can You Be?
Triangulating on Your Model and Coordination Mechanisms Analytical Leadership and the Chief Analytics Officer
To Where Should Analytical Functions Report? Building an Analytical Ecosystem
Developing the Analytical Organization Over Time The Bottom Line
Endnotes
Chapter 12 Engaging Analytical Talent
Four Breeds of Analytical Talent Engaging Analysts
Arm Analysts with Critical Information About the Business Define Roles and Expectations
Chapter 13 Governance for Analytics
Guiding Principles Elements of Governance
You Know You’re Succeeding When...
Chapter 14 Building a Global Analytical Capability
Widespread Geographic Variation
Central Coordination, Centralized Organization A Strong Center of Excellence
A Coordinated “Division of Labor” Approach Other Global Analytics Trends
Endnotes
Part V Case Studies in the Use of Analytics Chapter 15 Partners HealthCare System
Centralized Data and Systems at Partners
Managing Clinical Informatics and Knowledge at Partners High-Performance Medicine at Partners
New Analytical Challenges for Partners Centralized Business Analytics at Partners
Hospital-Specific Analytical Activities: Massachusetts General Hospital Hospital-Specific Analytical Activities: Brigham & Women’s Hospital Endnotes
Chapter 16 Analytics in the HR Function at Sears Holdings Corporation
What We Do
Who Make Good HR Analysts Our Recipe for Maximum Value Key Lessons Learned
Chapter 17 Commercial Analytics Culture and Relationships at Merck
Decision-Maker Partnerships Reasons for the Group’s Success Embedding Analyses into Tools
Future Directions for Commercial Analytics and Decision Sciences
Chapter 18 Descriptive Analytics for the Supply Chain at Bernard Chaus, Inc.
The Need for Supply Chain Visibility
Analytics Strengthened Alignment Between Chaus’s IT and Business Units
Foreword and Acknowledgments
The collection of research in this book personifies the contributions of a group of people who have made the International Institute for Analytics the success it is today. This book is the result of three cups of hard work, two cups of perseverance, and a pinch of serendipity that got our fledgling company started.
First, the hard work. Obvious thanks go to Tom Davenport for editing and compiling this initial collection of IIA research into book form. For the raw material Tom had to work with, thanks to all IIA faculty members who have contributed insightful research during IIA’s first two years,
particularly Bill Franks, Jeanne Harris, Bob Morison, James Taylor, Eric Peterson, and Keri
Pearlson. Marcia Testa (Harvard School of Public Health) and Dwight McNeil played key roles as we grew our coverage of health care analytics. Ananth Raman (Harvard Business School) and
Marshall Fisher (Wharton) were instrumental in forming our initial retail analytics research agenda. We look forward to additional books in these two areas. And, of course, thanks to all the practitioner organizations who volunteered their time to be the subjects of much of our research.
For their continued belief in IIA, thanks to the entire team at SAS, who validated our mission and direction early on and have shown their trust in us ever since. In particular, thanks to Scott Van Valkenburgh (for all the whiteboard sessions), Deb Orton, Mike Bright, Anne Milley, and Adele Sweetwood. We’re also grateful for the support of other IIA underwriters, including Accenture, Dell, Intel, SAP, and Teradata.
This book is also a credit to the perseverance of two great talents within IIA. Katherine Busey was IIA’s first employee in Boston and was the person who helped convince Jeanne Glasser at Pearson that IIA’s research deserved to be read by more than just our research clients. Thanks as well to Callie Youssi, who coordinates all of IIA’s faculty research activities, which is no simple task.
It’s hard to imagine Tom without his wife and agent, Jodi, to add vector to the thrust. Thanks to you both for betting on me as an entrepreneur, particularly during a challenging first year.
And for the pinch of serendipity, Tom and I are indebted to Eric McNulty for having the foresight to bring us together, be the first voice of IIA, and help set our early publishing and research standards. Jack Phillips
About the Authors
Thomas H. Davenport is co-founder and research director of IIA, a Visiting Professor at Harvard Business School, Distinguished Professor at Babson College, and a Senior Advisor to Deloitte
Analytics. Voted the third leading business-strategy analyst (just behind Peter Drucker and Tom Friedman) in Optimize magazine, Daven-port is a world-renowned thought leader who has helped hundreds of companies revitalize their management practices. His Competing on Analytics idea recently was named by Harvard Business Review one of the 12 most important management ideas of the past decade. The related article was named one of the ten must-read articles in HBR’s 75-year history. Published in February 2010, Davenport’s related book, Analytics at Work: Smarter
Decisions, Better Results, was named one of the top 15 must-reads for 2010 by CIO Insight.
Elizabeth Craig is a research fellow with the Accenture Institute for High Performance in Boston. She is the coauthor, with Peter Cheese and Robert J. Thomas, of The Talent-Powered Organization
(Kogan Page, 2007).
Jeanne G. Harris is a senior executive research fellow with the Accenture Institute for High Performance in Chicago. She is coauthor, with Thomas H. Davenport and Robert Morison, of
Analytics at Work: Smarter Decisions, Better Results (Harvard Business Press, 2010). She also cowrote the 2007 book Competing on Analytics: The New Science of Winning (also from Harvard Business Press).
Robert Morison serves as lead faculty for the Enterprise Research Subscription of IIA. He is an accomplished business researcher, writer, discussion leader, and management consultant. He is coauthor of Analytics at Work: Smarter Decisions, Better Results (Harvard Business Press, 2010),
Workforce Crisis: How to Beat the Coming Shortage of Skills and Talent (Harvard Business Press, 2006), and three Harvard Business Review articles, one of which received a McKinsey Award as best article of 2004. He has spoken before scores of corporate, industry, and government groups and has been a commentator on workforce issues on Nightly Business Report on PBS. Most recently executive vice president and director of research with nGenera Corporation, he earlier held management positions with the Concours Group, CSC Index, and General Electric Information Services Company.
Dr. Keri E. Pearlson is an expert in the area of managing and using information. She has worked with CIOs and executives from some of the largest corporations in the world. She has expertise in helping executives create strategies to become Web 2.0-enabled enterprises, designing and delivering executive leadership programs, and managing multiclient programs on issues of interest to senior executives of information systems. She specializes in helping IT executives prepare to participate in the strategy formulation processes with their executive peers. She’s a faculty member of the
International Institute for Analytics and the Founding Partner and President of KP Partners, a CIO advisory services firm.
Bill Franks is a faculty member of the International Institute for Analytics and is Chief Analytics Officer for Teradata’s global alliance programs. He also oversees the Business Analytic Innovation Center, which is jointly sponsored by Teradata and SAS; it focuses on helping clients pursue
Wave (John Wiley & Sons, Inc., April, 2012, www.tamingthebigdatatidalwave.com).
Eric T. Peterson is a faculty member of the International Institute for Analytics. He is the founder of Web Analytics Demystified and has worked in web analytics for over 10 years as a practitioner, consultant, and analyst. He is the author of three best-selling web analytics books: Web Analytics Demystified, Web Site Measurement Hacks, and The Big Book of Key Performance Indicators. He is one of the most widely read web analytics writers at www.webanalyticsdemystified.com.
John Lucker is a principal with Deloitte Consulting LLP, where he leads Deloitte’s Advanced Analytics and Modeling practice, one of the leading analytics groups in the professional services industry. He has vast experience in the areas of advanced analytics, predictive modeling, data mining, scoring and rules engines, and numerous other advanced analytics business solution approaches.
James Taylor is a faculty member of the International Institute for Analytics and is CEO of Decision Management Solutions. Decision Management Systems apply business rules, predictive analytics, and optimization technologies to address the toughest issues facing businesses today, changing how organizations do business. He has over 20 years of experience in developing software and solutions for clients. He has led Decision Management efforts for leading companies in
insurance, banking, health management, and telecommunications.
Stacy Blanchard is the Organization Effectiveness Services and Human Capital Analytics lead for Accenture Analytics. With over 15 years of experience in aligning strategy, culture, and leadership for organizations, she has worked globally across a multitude of client situations and industries. She integrates real-world experience with recognized approaches to coach and align the C-suite to drive transformational agendas. Prior to Accenture, she was the CEO of Hagberg Consulting Group, an organization consultancy specializing in the assessment, alignment, and transformation of strategy, corporate culture, and leadership.
Carl Schleyer is Director of Operations and Analytics for Sears Holdings Corporation (an IIA sponsor) and is responsible for gathering and analyzing large volumes of data in order to support talent and human capital strategies and tactics. As a part of this role, Carl created the first analytical team dedicated to purely human capital pursuits within Sears Holdings. His passion is unlocking the value of data through influencing decisions. Carl is a 20+ year veteran of the retail industry, having served various functions within HR.
Leandro DalleMule is Senior Director for Global Analytics at CitiGroup. Prior to this, he was a Senior Manager for Deloitte’s analytics consulting practice, a risk manager for GE Capital, and a brand manager for Exxon in Brazil.
Callie Youssi is Vice President of Research Operations for the International Institute for Analytics. In this role, she works to build, manage, and support IIA’s global faculty as they uncover the most compelling applications of analytics. She is responsible for aggregating and analyzing the areas of greatest interest to IIA clients and ensuring a strong faculty bench to address those focus areas.
Introduction: The New World of Enterprise Analytics
Thomas H. Davenport
The Rise of Analytics
Analytics aren’t new—I’ve found references to corporate analytical groups as far back as 1954— but they seem to be more important to business and organizational life than ever before. Analytical approaches to decision-making and management are on the rise because of several factors:
• The dramatic increase in the amounts of data to analyze from various business information systems
• Powerful and inexpensive computers and software that can analyze all this data
• The movement of quantitatively trained managers into positions of responsibility within organizations
• The need to differentiate products and offers, optimize prices and inventories, and understand what drives various aspects of business performance
As a result, many factors indicate that analytical initiatives, jobs, and organizations are taking off around the world. According to LinkedIn data, for example, the number of people starting analytics or data scientist jobs increased tenfold from 1990 to 2010. Every major consulting firm has developed an analytics practice. According to Google Trends, the number of searches using the term “analytics” increased more than twenty-fold between 2005 and 2012; searches for the term “big data” (defined in a moment) showed an even more dramatic rise beginning in 2010. The current era has been described as the “Age of Analytics,” the “Age of Algorithms,” and the “Money-ball Era,” after the book and movie about the application of analytics to professional baseball.
Enterprise Analytics
One important attribute of the increased focus on analytics is that it has become—at least for many organizations—an “enterprise” resource. That is, instead of being sequestered into several small pockets of an organization—market research or actuarial or quality management—analytical
capabilities are being recognized as something that can benefit an entire organization. Diverse groups are being centralized, or at least coordination and communication are taking place between them. Analytical talent is being inventoried and assessed across the organization. Plans, initiatives, and priorities are being determined by enterprise-level groups, and the goal is to maximize the impact on the enterprise.
Hence the title of this book. Many of the chapters relate to how analytics can and should be managed at an enterprise level. If there were a set of guidelines for a Chief Analytics Officer—and some people in this role are emerging, albeit still in relatively small numbers—this book would provide many of them. We are not yet at the point where analytics is a broadly recognized business function, but we are clearly moving in that direction.
The Rise of “Big Data”
concept refers to data that is either too voluminous or too unstructured to be managed and analyzed through traditional means. The definition is clearly a relative one that will change over time.
Currently, “too voluminous” typically means databases or data flows in petabytes (1,000 terabytes); Google, for example, processes about 24 petabytes of data per day. “Too unstructured” generally means that the data isn’t easily put into the traditional rows and columns of conventional databases.
Examples of big data include a massive amount of online information, including clickstream data from the Web and social media content (tweets, blogs, wall postings). Big data also incorporates video data from retail and crime/intelligence environments, or rendering of video entertainment. It includes voice data from call centers and intelligence interventions. In the life sciences, it includes genomic and proteomic data from biological research and medicine.
Many IT vendors and solutions providers, and some of their customers, treat the term as just
another buzzword for analytics, or for managing and analyzing data to better understand the business. But there is more than vendor hype; there are considerable business benefits from being able to analyze big data on a consistent basis.
Companies that excel at big data will be able to use other new technologies, such as ubiquitous sensors and the “Internet of things.” Virtually every mechanical or electronic device can leave a trail that describes its performance, location, or state. These devices, and the people who use them,
communicate through the Internet—which leads to another vast data source. When all these bits are combined with those from other media—wireless and wired telephony, cable, satellite, and so forth —the future of data appears even bigger.
Companies that employ these tools will ultimately be able to understand their business environment at the most granular level and adapt to it rapidly. They’ll be able to differentiate commodity products and services by monitoring and analyzing usage patterns. And in the life sciences, of course, effective use of big data can yield cures to the most threatening diseases.
Big data and analytics based on it promise to change virtually every industry and business function over the next decade. Organizations that get started early with big data can gain a significant
competitive edge. Just as early analytical competitors in the “small data” era (including Capital One bank, Progressive insurance, and Marriott hotels) moved out ahead of their competitors and built a sizable competitive edge, the time is now for firms to seize the big-data opportunity.
The availability of all this data means that virtually every business or organizational activity can be viewed as a big-data problem or initiative. Manufacturing, in which most machines already have one or more microprocessors, is already a big-data situation. Consumer marketing, with myriad customer touchpoints and clickstreams, is already a big-data problem. Governments have begun to recognize that they sit on enormous collections of data that wait to be analyzed. Google has even described the self-driving car as a big data problem.
This book is based primarily on small-data analytics, but occasionally it refers to big data, data scientists, and other issues related to the topic. Certainly many of the ideas from traditional analytics are highly relevant to big-data analytics as well.
IIA and the Research for This Book
analytics and analytical technologies. I had previously led sponsored research programs on analytics, and I knew they were a great way to generate relevant research content.
The earliest support for the Institute came from the leading analytics vendor SAS. We also worked with key partners of SAS, including Intel, Accenture, and Teradata. A bit later, other key vendors, including SAP and Dell, became sponsors of IIA. The sponsors of IIA provided not only financial support for the research, but also researchers and thought leaders in analytics who served as IIA faculty.
After recruiting other faculty with academic or independent consulting backgrounds, we began producing research outputs. You’ll see several examples of the research outputs in this book. The IIA produced three types of outputs: research briefs (typically three-to-five-page documents on particular analytics topics); leading-practice briefs (case studies on firms with leading or typical analytical issues); and write-ups of meetings, webcasts, and audioconferences. The emphasis was on short, digestible documents, although in some cases more than one brief or document has been combined to make one chapter in this book.
With some initial research in hand, we began recruiting corporate or organizational participants in IIA. Our initial approach was to focus on general “enterprise” topics—how to organize analytics, technology architectures for analytics, and so forth. We did find a good reaction to these topics, many of which are covered in this book. Practitioner companies and individual members began to join IIA in substantial numbers.
However, the strongest response was to our idea for industry-specific research. Companies seemed quite interested in general materials about analytical best practices but were even more interested in how to employ analytics in health care or retail, our first two industry-specific programs. That research is not featured in this book—we may do other books on analytics within specific industries—but we did include some of the leading-practice briefs from those industries as chapters.
The Structure of This Book
Part I: Overview of Analytics and Their Value
1. What Do We Talk About When We Talk About
Analytics?
Thomas H. Davenport
Every decade or so, the business world invents another term for how it extracts managerial and decision-making value from computerized data. In the 1970s the favored term was decision support systems, accurately reflecting the importance of a decision-centered approach to data analysis. In the early ’80s, executive information systems was the preferred nomenclature, which addressed the use of these systems by senior managers. Later in that decade, emphasis shifted to the more technical-sounding online analytical processing (OLAP). The ’90s saw the rise of business intelligence as a descriptor.
Each of these terms has its virtues and its ambiguities. No supreme being has provided us with a clear, concise definition of what anything should be called, so we mortals will continue to wrestle with appropriate terminology. It appears, however, that another shift is taking place in the label for how we take advantage of data to make better decisions and manage organizations. The new label is
analytics, which began to come into favor in the middle of this century’s first decade—at least for the more statistical and mathematical forms of data analysis.
Jeanne Harris, my coauthor on the 2007 book Competing on Analytics, and I defined analytics as “the extensive use of data, statistical and quantitative analysis, explanatory and predictive models, and fact-based management to drive decisions and actions.” I still like that definition, although now I would have to admit that they are still analytics even if they don’t drive decisions and actions. If a tree falls in the woods and nobody chops it up for firewood, it’s still a tree.
Of course, no term stays static after it is introduced into the marketplace. It evolves and accretes new meanings over time. Particularly if it is a popular term, technology vendors claim that their product or service is at least a piece of the term, and they often represent it as being squarely in the center of the term’s definition. That is certainly the case with analytics. The term also has many commonly used variations:
• Predictive analytics • Data mining
• Business analytics • Web analytics • Big-data analytics
I’ll attempt to shed more light on how the term analytics has evolved and the meanings of some of the key variations as well. Before doing that, however, I should remind you that analytics aren’t a new idea, and they don’t have to be tied up with analytical technology. The first writing on statistics was arguably by Al-Kindi, an Arab philosopher from the 9th century. It is believed that he possessed rather primitive computing tools. Even today, theoretically, analytics could be carried out using
Stata, and the much-larger firm SAS) to IT giants such as IBM, SAP, and Oracle. Because they involve data and computers, analytics also require good information management capabilities to clean, integrate, extract, transform, and access data. It might be tempting, then, to simply equate analytics with analytical information technology. But this would be a mistake, since it’s the human and organizational aspects of analytics that are often most difficult and truly differentiating.
Why We Needed a New Term: Issues with Traditional Business
Intelligence
Business intelligence (BI) used to be primarily about generating standard reports or answering queries, although many viewed it as incorporating more analytical activities as well. Today it has come to stand for a variety of diverse activities. The Wikipedia definition of BI (as of April 10, 2012), for example, is rather extended:
Business intelligence (BI) mainly refers to computer-based techniques used in identifying,
extracting, and analyzing business data, such as sales revenue by products and/or departments, or by associated costs and incomes.
BI technologies provide historical, current and predictive views of business operations. Common functions of business intelligence technologies are reporting, online analytical processing,
analytics, data mining, process mining, complex event processing, business performance management, benchmarking, text mining and predictive analytics.
Business intelligence aims to support better business decision-making. Thus a BI system can be called a decision support system (DSS). Though the term business intelligence is sometimes used as a synonym for competitive intelligence, because they both support decision making, BI uses technologies, processes, and applications to analyze mostly internal, structured data and business processes while competitive intelligence gathers, analyzes and disseminates information with a topical focus on company competitors. Business intelligence understood broadly can include the subset of competitive intelligence.
You know there is a problem when a definition requires that much verbiage! BI has always had its issues as a term. While surely preferable to “business stupidity,” it lacked precision as to what
activities were included. One business school faculty colleague of mine suggested that it was highly presumptuous for the IT field to claim “business intelligence” as its own. Aren’t all business
activities supposed to add intelligence? And how does business intelligence relate to such fields as competitive intelligence (which is described as a subset of business intelligence in the Wikipedia definition, but tends not to involve much quantified data at all) and customer intelligence?
The problems of BI multiplied when the term analytics began to gain favor around the middle of the last decade. There was much confusion about the difference between these two terms. The CEO of a software vendor in this category told me he thought that analytics was a subset of business
intelligence. Another CEO in the same industry argued that BI was a subset of analytics. Obviously neither term is entirely clear if each can be a subset of the other in educated executives’ minds.
There is little doubt, however, that analytics have become a more contemporary synonym for business intelligence, but with a more quantitatively sophisticated slant. The reporting-oriented activities that primarily characterized BI are now considered a part of analytics by many people and organizations. However, it’s fair to say that every form of analytics is in some sense a struggle
analytical approaches involving statistics and mathematical models of data. Therefore, it’s important to be clear about the different types of activities that are possible under the banner of “analytics.”
Three Types of Analytics
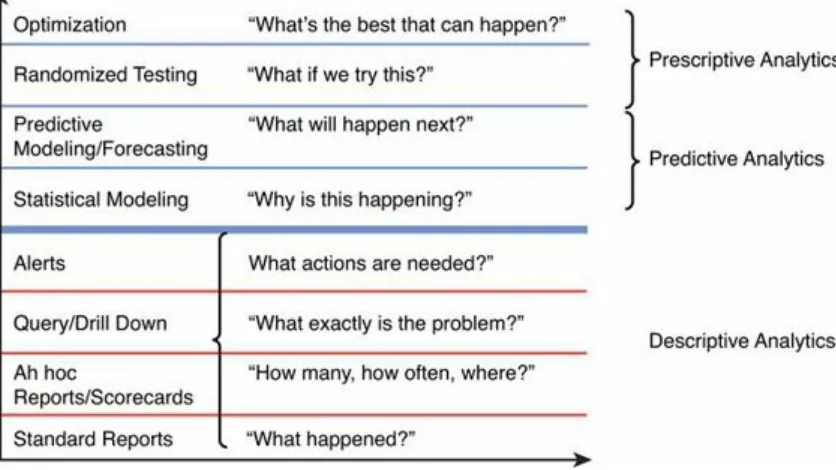
If the term analytics is to retain any real meaning with so much evolution in the term, we probably require some subdefinitions of analytics. For example, if we include the various forms of reporting— standard or ad hoc reports, queries, scorecards, alerts—in analytics, perhaps they should be called
descriptive analytics (see Figure 1.1). They simply describe what has happened in the past.
Descriptive analytics may also be used to classify customers or other business entities into groups that are similar on certain dimensions.
Figure 1.1. Three types of business analytics.
It would be difficult to argue that understanding what has happened is not a good thing for
organizations to do. What could be objectionable about it? Nothing, really, except that there are more sophisticated ways of using data to understand a business. Your statistics textbook didn’t end with means, medians, and modes, and you can go beyond descriptive analytics. The numbers from
descriptive analytics don’t tell you anything about the future, they don’t tell you anything about what the numbers should be, and they usually don’t tell you much about why they are what they are.
Predictive analytics use models of the past to predict the future. They typically use multiple variables to predict a particular dependent variable. Examples include using various measures of growing season rainfall and temperatures to predict the price of Bordeaux wine, or using variables about your credit history to predict the likelihood that you will repay loans in the future. Predictive analytics models are very popular in predicting the behavior of customers based on past buying history and perhaps some demographic variables.
Prescriptive analytics are less widely known, but I refer to them as prescriptive because, in effect, they tell you what to do. Randomized testing, in which a test group is compared to a control group with random assignment of subjects to each group, is a powerful method to establish cause. If you compare the two groups and find that one is better than the other with statistical significance, you should do the thing that’s being tested in the test group.
Optimization is another form of prescriptive analytics. It tells you, based on a statistical model, what the optimum level of key variables is if you want to maximize a particular outcome variable. If you want to maximize your profitability, for example, pricing optimization tells you what price to charge for your products and services.
Each of these three types of analytics is valuable, but in most organizations, descriptive analytics dominate in terms of frequency of use. Reporting tools are widely available and easy to understand. Managers often demand them, as do external regulatory bodies. Therefore, they tend to become so common that they drive out more sophisticated analytics. Companies that want to emphasize
predictive and prescriptive analytics sometimes have to control the demand and supply for descriptive analytics. One way to do this is by encouraging managers to do their own query and reporting work, rather than have quantitative analysts do it for them.
Where Does Data Mining Fit In?
Data mining can fit into any of the three categories just described, but it most commonly involves statistical and predictive models—predictive analytics in Figure 1.1. The Wikipedia definition (as of April 12, 2012) starts with the following:
Data mining (the analysis step of the knowledge discovery in databases process, or KDD), a relatively young and interdisciplinary field of computer science, is the process of discovering new patterns from large data sets involving methods at the intersection of artificial intelligence, machine learning, statistics and database systems.
As this definition suggests, data mining implies a discovery of trends and patterns in data—not by humans, but by the computer itself. Artificial intelligence (notably, neural networks) and machine learning approaches rely on computers and software to try a variety of models to fit the data and determine the optimal model. Traditional analytics rely on a human analyst to generate a hypothesis and test it with a model.
Data mining implies a lesser need for smart humans, but this is not the case in the companies I have studied. In fact, every company I have seen with an aggressive data mining initiative also has a large complement of sophisticated quantitative people. It is true that machine learning can increase the productivity of those smart humans, but they are still necessary to configure the machine learning programs, tune them, and interpret the results. In big data environments, machine learning is often necessary to create models for the vast and continuing amount of data; human analysts using hypothesis-driven analytics alone just can’t keep up.
Business Analytics Versus Other Types
Over the past several years, the term business analytics has become popular. It merely means using analytics in business to improve business performance and better satisfy customers.
analytics. In health care, for example, the use of the term health care analytics is growing in popularity, and you also are likely to hear informatics and clinical decision support used as synonyms.
Each industry and sector has its own orientations to analytics. Even what is called “health care analytics” or “clinical decision support” in health care is somewhat dissimilar to analytics in other industries. It is likely, for example, that the primary method for supporting decisions in health care will be a series of if/then rules, rather than statistical models or algorithms—although there is slow movement toward more quantitative data.
Web Analytics
Web analytics is about analyzing online activity on websites and in web applications. Perhaps obviously, it is one of the newer analytical disciplines. And perhaps because of its youth, it is relatively immature and rapidly changing. For most organizations, web analytics is really web reporting—counting how many unique visitors have come to the site, how many pages they have viewed, how long they have stayed. Knowing these details is certainly valuable, but at some point perhaps web analytics will commonly employ more sophisticated analyses. As Brent Dykes puts it in the fun book Web Analytics Action Hero, if all you do is count things, you will forever be stuck in “Setupland” as opposed to becoming an action hero.
The great exception to the web analytics = web reporting equation is the use of prescriptive analytics in the form of randomized testing, often called A/B testing in web analytics. This involves testing two different versions of a web page, typically to learn which receives more traffic.
Customers or users of the website need not even know they are participating in a test. More sophisticated testing is sometimes done using multiple variables and even testing across multiple channels (a website plus a print ad, for example).
Highly analytical companies such as Google and eBay typically run hundreds or thousands of tests at once. They have millions of customers, so it is relatively easy to create test and control groups and serve them different pages. eBay has an advanced testing platform that makes it easy for different groups within the company to run and interpret tests. However, there is still the issue of ensuring that the same customer is not participating in too many tests—participating in one test may confound the results from another—and determining for how long the learnings from a test remain relevant.
Big-Data Analytics
The newest forms of analytics are related to big data. This term usually refers to data that is either too big, too unstructured, or from too many different sources to be manageable through traditional databases. It is often encountered in online environments such as text, images, and video on websites. Scientific data, such as genomic data in biology, also usually falls into the big-data category in terms of both volume and (lack of) structure.
quantitative data that can be analyzed. For example, a company might be interested in understanding online consumer sentiment about the company or its brands. They might take text from blog posts, Twitter tweets, and discussion boards that mention the company as the input to an analysis. But before it can be analyzed, they need to classify the language in the text as either positive, negative, or neutral. The analysis typically just averages the resulting numbers (typically 1, 0, or –1).
Unfortunately, that relatively simple level of analysis is all too common in big-data analytics. The data management work needed to wrestle big data into shape for analysis is often quite sophisticated and demanding. But, as in web analytics, the actual analysis techniques used on the data are often underwhelming. There is a lot of counting and reporting of categories, as well as visual
representations of those counts and reports. There is very little predictive or prescriptive analytics performed on big data.
Perhaps this will change over time as the data management activities around big data become more routine and less labor-intensive. Certainly many of the “data scientists” who work with big data have highly quantitative backgrounds. PhDs in scientific or mathematics/statistics abound in this job
category. These people presumably would be capable of much more sophisticated analyses. But at the moment their analytical skills are being tested far less than their data management skills.
Conclusion
What’s in a name? Using the term analytics instead of prior terms may help inspire organizations to use more sophisticated mathematical and statistical decision tools for business problem-solving and competitive advantage. Just as the term supply chain management created a sense of process and interdependence that was not conveyed by “shipping,” a new term for the widespread analysis of data for decision-making purposes may assist in transforming that function. We live in a world in which many amazing feats of data manipulation and algorithmic transformation are possible. The name for these activities might as well reflect their power and potential.
2. The Return on Investments in Analytics
Keri E. Pearlson
Deciding to invest in an analytics project and then evaluating the success of that investment are complex processes. Often the decision is complicated by the complexity of the project, the time lag between the investment and the realization of benefits, and the difficulty in identifying the actual costs and actual value. However, most go/no-go decisions are made on the basis of a calculation of the return on investment (ROI), through either a formal ROI calculation or an informal assessment of the answer to the question “Will the value be greater than the investment?” The objective of this chapter is to summarize the traditional approaches to calculating ROI and then to describe a particular
approach to ROI analysis used by Teradata, a provider of technologies and services including data warehousing, BI, and customer relationship management (CRM). I’ll conclude with a case study on the business justification of analytics at the semiconductor firm Freescale.
Traditional ROI Analysis
The concept of calculating the ROI is simple, but the actual process to do so can be complicated. Despite this difficulty, ROI is useful in making the business case for the initial investment and also is used after the fact to evaluate the investment. We’ll begin this chapter by looking at the traditional method of calculating ROI and some of the considerations you face when doing so for investments in analytics.
A traditional ROI would have the analyst calculate a simple equation:
When it is part of the business case, this calculation is used in two ways. First, if the result of this simple calculation is a positive number, that means the cost of the investment is less than the value received. Therefore, the investment has a positive return and is potentially a “good” investment. Likewise, if it is a negative number, it is not a good investment. The second way this calculation is used is to compare investment opportunities. ROI calculations typically are expressed as this ratio to normalize the result and provide a basis for comparison with other investment opportunities. In many organizations, this ratio must exceed a minimum level to be considered for funding in resource
allocation decisions.
Let’s consider a simple example. Suppose a retail company is evaluating the potential return on the investment of an analytics project aimed at producing a more successful direct-mail campaign. The company plans to build a model of high-potential customers based on criteria selection and then mine its CRM data for these customers. Instead of sending a mailing to all customers who have spent $500 in the past year, the company will send the mailing only to customers who meet a selection of
Clearly, if a second project cost $100,000 and the expected benefit were $130,000, the ROI would be 30%.
What would we do with these ROI numbers? First, if budget permits, we might make both
investments, given both are projected to return more than they cost (we know this because the ROI is positive). Alternatively, the internal budget policy might be to invest only in projects with at least a 40% return. Therefore, the first investment passed this hurdle, but the second one did not.
If we can make only one investment (perhaps the resources or the people needed to do these
projects are the same and cannot do both at the same time), we could compare the investments to each other. A return of 50% is more than a return of 30%, so we might be more inclined to make the first investment. But at the same time, the actual benefit from the first investment is much less than the actual benefit from the second investment ($75,000 versus $150,000), supporting a decision to make the second investment. Given these calculations, it would take a budget committee or decision-maker to make the actual decision.
Cash Flow and ROI
In this simple example, the assumption is that the costs and benefits occur at the same time. That is rarely the case with an actual analytics project (or any business project). The ROI calculation must result from a realistic cash flow over the period of the project with the timing in mind. It’s beyond the scope of this chapter to explain this type of complex ROI calculation, but some websites have good examples, such as http://bit.ly/IIACashFlow.
Building a Credible ROI
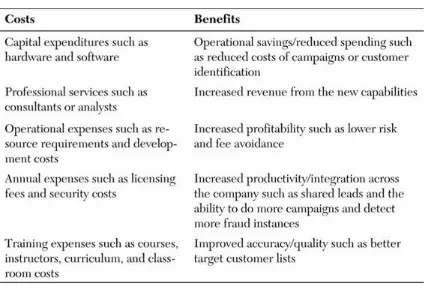
A credible ROI is based on a credible business case. Expected benefits must clearly be a result of the investment. All reasonable benefits and costs are bundled into the calculation. Table 2.1
summarizes sample components of the benefits and costs buckets.
Table 2.1. Comparing Costs and Benefits
Business managers spend much of their time calculating financial metrics to provide input into the go/no-go decision for projects. The ROI calculation is just one metric. Some of the other common metrics include the following:
• Cost of capital is the rate of return that a company would other wise earn (at the same risk level) as the investment being analyzed. This calculation depends on the use of the funds, not the source of the funds. Cost of capital is expressed as a percentage (%).
• Net present value (NPV) is the value, in today’s currency, of a stream of cash inflows and outflows. The NPV takes into account both the cash outflows and inflows to create a net value for the investment. To calculate NPV, you factor in an inflation rate, which makes cash in the future worth a bit less than cash today. NPV is expressed in currency ($).
• Internal rate of return (IRR) is the percentage of income in a discounted cash flow analysis of the investment. This calculation takes into account the cash outflows and inflows and creates the percentage return. Decisions often examine the IRR to make sure it is more than a hurdle rate— a minimum-acceptable rate of return for the company. IRR is expressed as a percentage (%) • Payback is the amount of time it takes for the cash inflows to equal the cash outflows. Payback
normally is expressed in terms of time (months or years). Other Considerations in Analytics ROI
A simple ROI works well when the costs and benefits are known and easily calculated and when the benefits are clearly a result of the investment. In analytics projects, however, the complexity of the actual business environment means that the inputs to the ROI calculation may not be as evident or as trustworthy as necessary to make the decision. Furthermore, it is often difficult to isolate the
investment in the analytics project from the actual business opportunity, further complicating the decision to make the investment. Analytics are often used to optimize or improve the returns from another business opportunity—for example, to provide better targeting in the direct-mail example described earlier. Finally, the different functions within the organization have different priorities, which often factor into the ROI discussions.
The complexity of the business environment makes it difficult to identify the investment’s actual costs and benefits. Inputs can be loosely defined as the people, the process, and the technology necessary to complete the project. Obvious inputs include the costs of the analytics model and the analyst’s/modeler’s time. Obvious benefits are the cost savings accrued by targeting the customers who come from the application of the model to the database and the additional revenue or accuracy that results from a more targeted group. But the list of actual items to be included in the bucket of inputs can grow quickly when you consider all the resources that go into the analytics program. Some additional questions to ask might include the following:
• What portion of the costs of the IT infrastructure software and hardware are directly part of this project?
• What will it cost to prepare the data for the project (such as building a data warehouse)? What fraction of those costs should be allocated to the analytics initiative?
• What experts or analysts will be needed for this project? What is the cost of including these experts?
timeliness to market, and so on offer value? Will additional revenue or customer retention result?
• What is the value of the additional efficiencies gained by this project? Is there value to a reduction in the data preparation, model development, or model deployment time? What is the value of the labor cost savings?
• Have the operating costs in the IT infrastructure (such as disk space, network, personnel needed to manage and support the efforts) been reduced?
Evaluation of the analytics investment is easily confused with investment in the business project itself because analytics and models can be integral to the business project. For example, in our hypothetical scenario of the direct-mail campaign, some costs of the targeted campaign (the mailing, the postage, the labor necessary to create the campaign) should not be charged to the analytics used to target the campaign (although the savings relative to an untargeted campaign might be credited to analytics). These costs can be a factor in the go/no-go decision about the direct-mail campaign. However, do not confuse the decision of whether to use the analytics modeling approach with the campaign decision itself. Carefully articulate the costs and benefits of both decisions to avoid this confusion. The question to ask is “How do we get value from an investment in analytics?” and not “What is the value of the analytics?” The first question is about the incremental value of the use of the models. The second question is about the overall business project.
The Teradata Method for Evaluating Analytics Investments
Teradata (an underwriter of IIA) has articulated a well-structured business value assessment process. The steps of this process are as follows:• Phase 1: Validate business goals and document best-practice usage. • Phase 2: Envision new capabilities.
• Phase 3: Determine ROI and present findings. • Phase 4: Communicate.
Let’s look at each phase in a bit more detail.
Phase 1: Validate Business Goals and Document Best Practices
This phase helps uncover strategic business initiatives and documents how business leaders measure progress. Business strategies to strengthen market advantage, fix weaknesses, and position the enterprise to take advantage of market opportunities are usually based on having an infrastructure of well-managed data and analytical tools. Understanding what the business wants to achieve and how it’s doing compared to those objectives highlights areas where value can be obtained.
Documenting best practices involves reviewing annual reports, strategic plans, investor
presentations, corporate reports, and other shared communications. It also includes interviewing business executives and management to understand business strategy, organizational metrics,
operational processes, business capabilities, and linkages between business objectives and data. The outputs of this phase are a clear picture of the current environment and the vision of the new
• Increased revenue • Increased savings • Reduced spending • Increased profitability
• Business impact of increased productivity • Business impact of improved accuracy • Business impact of increased quality • Fee avoidance from less risk
• Increased output • Reduced cycle time
Participants in this assessment are senior managers from the business, the information systems organization, operational units impacted by this investment, and the finance organization, to help validate the calculations.
Phase 2: Envision New Capabilities
In this phase, new capabilities are envisioned and documented, and their potential value is calculated. Managers are encouraged to think broadly about how this infrastructure might be used beyond the business problems at hand. Here are some areas where this value hides
• The ability to answer critical business questions beyond those on the table today • New ways to attract and keep profitable customers
• New capabilities to drive profitable customer behavior • Identification of unprofitable activities
• Additional business processes that can be improved
Creating this vision and quantifying the benefits is often the critical step in justifying a borderline infrastructure investment. It shows additional value to the organization beyond the problems and opportunities at hand today.
Phase 3: Determine ROI and Present Findings
Creating the business case is the key activity of this next phase. For each of the business
opportunities identified in Phases 1 and 2, a business case is made, articulating the financial impact and business value. The summary of all these cases, coupled with the costs of providing the service (the people, technology, and operating costs) over the term of the anticipated value, provides the data for calculating the investment’s ROI and NPV.
This business case is then shared with decision-makers and discussed to identify recommendations, concerns, additional ways to leverage the data, further improvements in processes, and
implementation methods to further increase business capabilities. Furthermore, this phase of the process creates a plan to regularly assess business value to ensure that value is obtained,
documented, and on track. Phase 4: Communicate
broader organization. The value created from analytics programs can be difficult to imagine. Skeptics abound until they are shown hard examples of the direct value from the investment. Therefore, a well-thought-out communications plan is essential to set a foundation for future value decisions. The goal of this step is to make visible, throughout the company, the value of the analytics investment and, ultimately, to fuel a culture that values data-driven decision-making.
An Example of Calculating the Value
1
Teradata shared this example to help make this process more concrete. Using the business value assessment process, the client validated the IT cost savings from migrating the technology to a new system and documented business value from performance improvements and business opportunities. The client estimated that it enjoyed a 30% performance improvement, resulting in a validated savings of $10 million in IT costs over five years.
In addition, the client found that deeper analysis of more-detailed data resulted in significant performance improvement, and new opportunities resulted from improved data management. In one case, the client found a pricing opportunity that recovered $37 million of direct margin and, in another case, an additional $12 million from increased productivity. The client was able to analyze three times as many complex business issues per year as it did prior to the investment. Strategic initiatives that required the analysis of integrated data were identified that enabled the client to compete more effectively. Processes were streamlined, missing data elements were uncovered, and management work was offloaded, all enabling the company to drive revenue and profitability through new initiatives.
Know Your Audience and Proceed Carefully
In our experience, the ROI analysis typically has three audiences: the finance group, the IT group, and the business group in which the analytical investment will take place. Each has a different
perspective and seeks a different angle on the issue of return on investment:
• The finance group prefers hard numbers in the calculation of cost and benefits. It takes a disciplined look at NPV, IRR, and ROI as part of a portfolio approach to investment
management. It seeks to answer the question “How does this investment compare to the other investments in our portfolio?”
• The IT group tends to see a more detailed calculation of operating costs—things such as floor space, people, additional servers and disk space, support costs, and software licenses. It seeks to answer the question “What are the additional costs to our data infrastructure?”
• The business group is most interested in the project’s business value. It seeks to answer the questions “What is the return on my investment?” and “What is the business value?”
When calculating the ROI of an analytics investment, the analyst must be prepared for all three angles. The complete picture is necessary to ensure that all functions are appropriately supportive of the investment and the project. In the following example at Freescale Semiconductor, each of these groups was involved in the financial assessment of analytics investments. But in this case the finance organization was more a user of analytics than an evaluator of investments.
Analytics ROI at Freescale Semiconductor
(www.freescale.com), he found an enterprise-wide data initiative under way, but at a very early stage. Having worked on a similar initiative in his previous role as chief information officer (CIO) at NCR Corporation, Coursen was able to apply lessons learned to help guide the transformation at Freescale. One of his initial top-three initiatives at Freescale was an “enterprise-wide data and analytics platform to enable faster and more informed business decision making,” according to an interview he gave to InformationWeek’s Global CIO columnist in April 2008.3 By December 2010, Coursen’s plans were well on their way to repeating the success he experienced at NCR.
Background and Context
Coursen is vice president and CIO of Freescale Semiconductor. Prior to Freescale, he was vice president and CIO at NCR, which owned Teradata at the time. While at NCR, Coursen led a seven-year journey to create a completely integrated enterprise-wide data warehouse to increase
operational efficiency and facilitate better decision-making at all levels of the company. At Freescale, he created similar processes using the lessons he learned at NCR. He is on target to complete a similar transformation in a short five years.
Beginning with High-Impact Areas
The journey at Freescale began with the identification of two areas where business analytics could have a big impact. Coursen sought out places in the organization where colleagues were already interested in getting value from their data. He also sought out projects where the value was quantifiable, in part so that he could show hard value, rather than soft value, to his colleagues.
He found willing partners in finance and manufacturing. In finance, all the sales orders were recorded in one place. Although rich with data, the team was missing efficiency in analyzing and using that data. Manufacturing was ripe for analytics since analyzing end-to-end processes required one-off projects to collect information from all the plants. It could take two weeks to answer
seemingly simple questions such as “What trends should we be managing across our plants?” and “We know we have a problem in our Asia plant. Do we have a similar problem in our Phoenix plant?” Similar questions that required data across processes or locations were equally difficult to answer.
Starting with these two applications, Coursen’s team identified the key objectives for investing in analytics. For manufacturing, because yields directly affected bottom-line revenue, there was a good measure of the effectiveness of the investment in analytics. The benefits in finance were harder to quantify. The time to close the books (man-hours) and similar metrics became the measures for identifying value. According to Coursen, “Some are hard benefits; others are soft. I don’t try to put a dollar amount on the soft benefits. Senior managers understand that. They appreciate that some
projects have a hard ROI while others are more subjective, based on management’s judgment.
Ultimately success translates into value, but making it more explicit isn’t really reasonable, and it can undermine efforts that will truly add value. I don’t do that.”
Getting Managers and Leaders Onboard
Next, Coursen’s team created a governance team. Senior-level managers from all divisions were rallied to form this team. Each group contributed at least one part-time member. The team assisted with tool selection, implementation, and promotion within their respective functional areas.
project’s objective was to source financial data and provide value-added finance solutions. Initial areas of focus were revenue, orders, profit and loss, and operating expenses. Because the information most chief financial officers (CFOs) require was housed in different systems across most companies, little integration occurred end-to-end. In internal meetings, everyone used different numbers to build the same metrics. The first phase was to get all the data into a data warehouse so that, as the reports were circulated, everyone would see the same numbers. Phase 2 was more about predictive analytics and looking to the future. “We now have a clear picture instantaneously about what just happened end-to-end and across entities,” Coursen said. “We didn’t have that visibility before. Some of our finance colleagues think it’s magic.”
In manufacturing, early initiatives included a factory data consolidation project and a corporate yield dashboard. These initiatives were chosen because the data was available locally, but not centrally, across factories and because it was directly related to the bottom line, so ROI was
relatively easy to calculate. According to Coursen, “We wanted to know how to increase yield from a batch of silicon chips we produced. But we couldn’t see end-to-end, so we couldn’t improve the process as effectively.”
The manufacturing organization audited actual savings and the incidents of savings on an ongoing basis. They recorded the real value they found on a monthly basis, rather than having the analytics group document savings. They found that it saved engineers a significant amount of time and gave capacity for things that couldn’t be done in the past.
Manufacturing told this story, not IT or the analytics group, and that added credibility to the investment. In fact, Freescale won several awards for this initiative. One was the Progressive Manufacturer of the Year High Achiever Award for 2010 from Managing Automation, an industry magazine. Freescale won this award for its Advanced Intelligent Manufacturing (AIM) project, which used advanced IT to significantly improve manufacturing efficiency. A key piece of the AIM project was its analytics capabilities. According to Managing Automation, the investment at the time was $39.9 million, and the ROI was reported to be $103 million. Since its implementation, the return has been much higher.
Coursen commented on his strategy of piloting to build momentum: “I could tell after a couple of years that my colleagues were onboard. No one wanted the analytics engine to go down. Everyone wanted to be next in line for development of a new application. We never talked about how long the journey was. We just moved along incrementally. We started with something doable and valuable. Then we leveraged that success into other areas.”
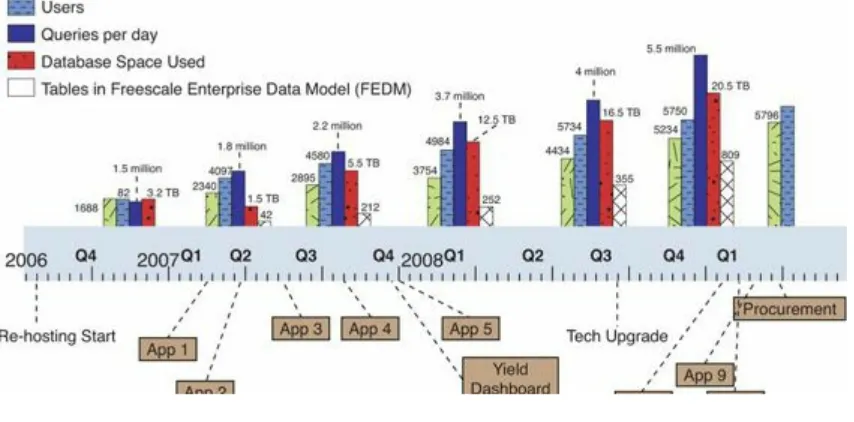
Incremental Growth
Figure 2.1. Freescale incremental growth. Lessons Learned
As finance and manufacturing saw success from the analytics projects, word spread quickly across the enterprise, and soon the analytics group was being asked to create applications for other
organizations. Here are some of the lessons learned from this experience:
• The sequencing of initial projects is important. Start with the high ROI project, not with the low or hard-to-quantify one. The first project normally bears the biggest cost because the start-up usually involves setting start-up the data warehouse. If it can be done with a large ROI project, future projects are much easier to justify because they have to cover only the incremental costs, such as additional data files.
• Pick an initial project that has a big pull, where information is scattered all over and a compelling, hard ROI can be calculated. For example, procurement is a good candidate. Global purchasing is impossible without a clear picture of what is being bought all over the world. When that picture is clear, better prices can be obtained from global suppliers. Applying analytics in the sales function can be soft. Everyone will agree that knowing the customer better is an important objective, but quantifying it is very difficult. Improvements in the supply chain, procurement, and service delivery are more easily quantifiable than better customer satisfaction and better decision-making. Cost is quantifiable, but benefits are not always quantifiable.
• Componentize the analytics investment as much as possible. At Freescale, Coursen didn’t want to ask for the investment necessary to do the entire enterprise model at the beginning. Instead, he started with a request for funding for the first piece—the pilots for the finance and manufacturing functions. Then, as the requests snowballed, he was able to justify additional investments with the projects that would use the analytics assets.
increased the quality of services; it would save some money and increase revenue. It was a conservative estimate and therefore believable, and it turned into an excellent use case that quickly spread across the company.
• Don’t expect an enterprise-wide business analytics program to happen overnight; it takes time. At NCR, the enterprise business intelligence program took seven years to become a well-accepted part of the business. At Freescale, it’s taking about five years.
• The leadership team sets the tone, but heavy client involvement makes it a success. IT should not go off in a corner and develop the solution. Every project needs a champion in the function. The leadership team at Freescale insisted on process improvements, standardization, and simplification, in addition to automation and system changes, making this a broader
program than just analytics. But requirements definitions, design reviews, testing, and
postmortems were done with heavy business-partner involvement, which increased value and quickened adoption.
Endnotes
1. The source of this example is the Teradata whitepaper titled “The Teradata Approach to Assessing the Business Value of Data Warehousing and Analytics Investments,” by Corinna Gilbert, Teradata Corporation, 2008. Used here with permission of Teradata.
2. More details on the Freescale example are available at these websites:
www.cio.com/article/print/152450 http://shashwatdc.blogspot.com/2007/07/sam-coursens-interview.html www.freescale.com/webapp/sps/site/homepage.jsp?
code=COMPANY_INFO_HOME&tid=FSH.
Part II: Application of Analytics
3 Leveraging Proprietary Data for Analytical Advantage 4 Analytics on Web Data: The Original Big Data
5 The Analytics of Online Engagement