Sanya Carley is associate professor in the School of Public and Environmental Affairs at Indiana University Bloomington. She received her doctorate in public policy from the University of North Carolina at Chapel Hill. Her research focuses on electricity policy, energy-based economic development, and public perceptions of emerging energy technologies.
E-mail: [email protected]
Sean Nicholson-Crotty is associate professor in the School of Public and Environmental Affairs at Indiana University Bloomington. He received his doctorate from Texas A&M University in 2003. His research focuses on fi scal federalism, the implementation and management of public programs, and policy diffusion.
E-mail: [email protected]
Eric J. Fisher received master’s degrees in public affairs and environmental science from the School of Public and Environmental Affairs at Indiana University Bloomington. His studies focused on energy policy and markets. He received a bachelor’s degree in geosciences from Earlham College.
E-mail: [email protected]
Public Administration Review, Vol. 75, Iss. 1, pp. 113–125. © 2014 by The American Society for Public Administration. DOI: 10.1111/puar.12294.
have found that approximately $90 billion went toward
“clean energy activities” (Aldy 2013, 142). Th is fi gure
includes approximately $24 billion for transportation activities such as high-speed rail, mass transit, and
advanced vehicles. Th e remaining $66 billion went
toward a variety of renewable energy, energy effi ciency
improvements, energy research and development, smart grid development and deployment, and workforce
training programs. Th e magnitude of public spending
from the Recovery Act is notable: passage of the act marked the largest federal infusion of fi scal resources into energy-related activities in modern history.
Several early reports have documented Recovery Act achievements to date. Some funds rescued renewable energy projects threatened by the fi nancial downturn, and in some cases, funds successfully leveraged fi scal support from private industry for energy projects
(EESI 2010; Hargreaves 2010). Th e Recovery Act
was found to produce approximately one new job per $107,000 in spending, with a multiplier between
T
he American Recovery and ReinvestmentAct (ARRA or Recovery Act) was passed in February 2009, two years into one of the worst economic recessions in U.S. history since the Great Depression. Over the course of just three years, from 2009 through 2011, the ARRA was designed to inject $840 billion into the U.S. economy. Primary spending areas included education, health care, unemployment assistance, family services, and energy, as well as a variety of other categories. A signifi cant portion of the spending under the act went toward tax expenditures such as the Making Work Pay tax credit and Alternative Minimum Tax relief.
Th e energy sector was one of the primary targets of
the ARRA because it is an industry in which there are signifi cant infrastructure needs, innovation-led development is possible, and there is the potential for the United States to gain market share and job growth in new sectors. Although estimates vary depending on which programs are included in the count, studies
Capacity, Guidance, and the Implementation of the American
Recovery and Reinvestment Act
Sanya Carley Sean Nicholson-Crotty Indiana University Eric J. Fisher
Abstract: Programs administered by the U.S. Department of Energy under the American Recovery and Reinvestment Act (ARRA) of 2009 were designed to spur investment in clean energy and jump-start the economy. Th ere was considerable variation, however, in the proportion of obligated funds that states spent during each year. A primary goal of the ARRA was to infuse as much money as possible into the struggling economy; however, there was signifi cant variation in the success with which states implemented these programs. Th is article draws on and extends the literature on intergovernmental implementation to explain such variation. Th e authors argue that jurisdictional capacity and federal guidance were important determinants of the rate at which states spent ARRA funds and, more important, that these factors interacted with one another in the implementation process. Th is assertion is tested using a mixed-methods approach that includes a regression analysis of state ARRA spending between 2009 and 2012, as well as an evaluation of interviews conducted with 46 state agency representatives responsible for spending ARRA energy funds.
Practitioner Points
• Federal guidance and jurisdictional capacity can both infl uence implementation success in intergovernmental programs.
• States with previous energy policy experience were more prepared to spend American Recovery and Reinvestment Act energy program funds.
• States with greater jurisdictional capacity were more prepared to spend American Recovery and Reinvestment Act energy program funds.
that guidance from the national government acts as an important substitute for capacity, and therefore that guidance should be expected to have a much larger impact on implementation success in jurisdictions with lower levels of human capital, managerial
acu-men, or relevant policy experience. Th is analysis tests this assertion
using a mixed-methods approach that includes regression analyses of state success in spending obligated ARRA funds, as well as evalu-ation interviews conducted with 46 state agency representatives responsible for spending ARRA energy funds.
ARRA and the Energy Sector
Th e Recovery Act disbursed funding through three mechanisms:
tax benefi ts; entitlements; and contracts, grants, and loans. All funds that went through state governments (the focus of the present
analysis) were in the contracts, grants, and
loans category.2 Several energy-related ARRA
programs were funded without the
involve-ment of state agencies. Th ose additional
programs included direct energy effi ciency
funding for large cities and counties in each state and small amounts of funding for public utility commissions to prepare for increased regulatory activity in response to other ARRA-funded initiatives. While these programs certainly are worthy of study, they are beyond the scope of this project.
Th e remainder of the article focuses on energy-related programs that
were funneled through state agencies. Th e majority of our
discus-sion focuses on the Weatherization Assistance Program (WAP), State
Energy Program (SEP), Energy Effi ciency Conservation Block Grant
(EECBG) program, Appliance Rebate (AR) program, and Energy Assurance and Planning (EAP) program. Some states had additional energy programs, but because these fi ve programs were common to all states and made up the bulk of state energy funding, we focus
our attention on them. Th e data set used for the statistical analysis
includes several other state energy programs as well, as discussed later.
Th e Weatherization Assistance Program provides energy effi ciency
upgrades for low-income residential dwellings. Recovery Act fund-ing for weatherization activities fl owed through existfund-ing federal
WAP networks. Congress established the WAP in 1976. Th is
program is distinct from the others studied in this analysis because WAP programs are often handled by agencies other than state energy agencies, usually a housing and urban development agency. In some states, such as Alaska and Minnesota, one agency is respon-sible for weatherization as well as all other related energy programs covered in this analysis.
Th e SEP, which existed before the Recovery Act, provided state
agencies with funds for technical advising and outreach related to energy issues. Under the Recovery Act, SEP funding involved
new constraints and programming opportunities. Th ese diff
er-ences were signifi cant enough that many states treated the SEP as a completely new program during the ARRA funding period. Under ARRA, agencies used SEP funds for a variety of purposes, including demonstration and installation of renewable energy infrastructure, improvements to state-owned facilities such as jails and schools, and
public education related to renewable energy and energy effi ciency.
0.47 and 1.06 for contracts, grants, and loans projects (Feyrer and Sacerdote 2011).
Other assessments of Recovery Act performance, however, sug-gest that there may be cause for concern regarding the speed at which the funds were translated into measurable recovery or energy investment because of implementation delays (Perlman 2009), despite President Barack Obama’s stated goal to obligate and outlay 70 percent of all funds by the end of September 2010 (Lew 2011). While this fi nding holds across all programs, several published reports have highlighted the problems associated with energy programs in particular (U.S. Department of Energy 2010). Recovery Act funds were intended to be spent between 2009 and 2011, with extensions allowed for most programs through 2012 and a few programs through 2013. For those
funds that expired and were not allowed any further extensions, states had to send the
funds back to the national government.1
Following passage of the Recovery Act and the beginning of fund allocation in 2009, there was signifi cant variation in the rate at which states spent their funds, both energy and
nonenergy related. For example, in 2010, a year after ARRA pro-grams began distributing funds, Alaska, Delaware, and Utah each spent less than 10 percent of the energy funds obligated to them under state energy programs. In that same year, Idaho, Minnesota, and Montana each spent more than 40 percent of obligated energy funds. Figure 1 displays the average and the 25th, 50th, and 75th percent quartiles for annual energy funds spent. It is unrealistic to expect any state to have spent 100 percent of funds in any given year because the states were not required under the ARRA to fund only projects that could be completed in a single year. Nonetheless, the high variation across states suggests that some states were much more successful at meeting the goals of the program.
Th is study draws on the intergovernmental implementation
literature to develop and test a theory of implementation success of the ARRA energy programs and to examine which factors led some states to spend a larger proportion of their ARRA funds than
others. Th is analysis suggests that jurisdictional capacity and federal
guidance are both important parts of explaining the effi ciency with
which states spent their ARRA funds. It also off ers the argument
Figure 1 Averages and Quartiles for Share of Annual Energy Funds Spent under ARRA, 2009–12
Th
e Recovery Act disbursed
funding through three
mechanisms: tax benefi ts;
entitlements; and contracts,
identifi es program characteristics—such as complexity, clarity, and commitment of resources—as well as nonstatutory factors—such as problem tractability and the capacity of the implementing agent—
as dominant infl uences in shaping implementation eff orts. Th ese
factors have remained central as more recent literature has acknowl-edged the increasingly networked and intraorganizational way in which modern policy is implemented (see Hill and Hupe 2002), including the challenges of intergovernmental implementation (see, e.g., O’Toole and Christensen 2013).
Th e work on intergovernmental implementation has been
particu-larly focused on the role of mandate clarity and the importance of jurisdictional capacity in determining implementation success. In terms of the fi rst, authors have suggested that the amount of guidance that the federal government gives subnational jurisdic-tions regarding the goals of a program and the best way to achieve those goals has a signifi cant infl uence on implementation success. Guidance documents, often negotiated with states, are an increas-ingly common tool for the federal government to shape implemen-tation (Conlan and Posner 2011; Galston and Tibbetts 1994), and studies typically have found that subnational recipients of federal mandates and grants want more guidance (Conlan and Posner
2011). Th e Recovery Act appears not to have been an exception to
this rule (Wyatt 2009).
Federal guidance and technical assistance have been shown to infl u-ence the way in which jurisdictions defi ne goals and engage in the day-to-day implementation of federal programs (see, e.g., Grogan and Rigby 2009; Harris 2010). More interestingly, perhaps,
guid-ance also seems to infl uence the way that states and localities think
about the implementation process. For example, guidance has been demonstrated to facilitate collaboration and interagency coopera-tion in the development of hydroelectric power (Kerwin 1990), reduce competition among recipients (Posner 2007), and promote
adherence to grantor values (Conlan and Posner 2011). Th e
litera-ture suggests that an absence of guidance creates uncertainty and inaction among subnational jurisdictions (Balducchi and Wanderer 2008), as well as variability and instability in the implementation of federal programs (Klarman 1976).
In addition to guidance and clarity, scholars have long recognized that the capacity of subnational governments is essential to the implementation of federal programs (Derthick 1970; Elazar 1984; Gamkhar and Pickerill 2012; Hall 2012; Jennings, Hall, and Zhang 2012). Capacity, defi ned in various ways, has been shown to correlate with implementation success in federal, state, and local mandates (see, e.g., May 1993, 1995; McDermott 2004; Spillane
and Th ompson 1997). It has also been associated with the eff
ective-ness with which jurisdictions receive and spend intergovernmen-tal grants-in-aid (see, e.g., Collins and Gerber 2008; Hall 2008; Handley 2008; Manna and Ryan 2011).
The Interaction between Subnational Capacity and Federal Guidance
Previous work has clearly demonstrated that federal guidance and jurisdictional capacity can both infl uence implementation success in intergovernmental programs. However, these infl uences have typi-cally been treated as independent of one another, which may have limited our understanding of the impact of each. As an alternative,
Th e Energy Independence and Security Act of 2007 established the
EECBG program. Congress fi rst allocated funding for the program,
however, through the Recovery Act. Th e EECBG program
pro-vided nonentitlement communities with funds for energy effi ciency
improvements. Entitlement communities were designated as the largest cities and counties in each state. Communities eligible for EECBGs applied for the grants through a competitive bidding process administered by the state agency. Other funds were allo-cated through a formulaic process based on population. Typical projects included local government building improvements, such as
effi ciency upgrades for lighting or HVAC systems, and traffi c light
replacements using more effi cient lights.
Th e AR program subsidized private consumer purchases of effi cient
home appliances such as washing machines and refrigerators. State agencies had discretion in choosing how to administer the subsidy. In many states, consumers paid full price for qualifying appliances, then submitted the required documentation to state agencies. Following verifi cation, agencies then transferred the subsidies directly to the consumers, as is typical for rebate programs. In some states, however, such as Illinois, agencies transferred subsidy funds directly to appli-ance retailers after the appliappli-ances were sold in a special sale.
Th e EAP program was designed to allow state agencies to create or
update state energy resource plans. Th ese plans provided statewide
energy risk assessment, contingency planning, and responses to energy supply disruption scenarios. Agencies also used these funds for “smart grid” planning. Funding for energy assurance and planning was only used for plan development and not for implementation.
It is important to note that in many of the programs discussed here, funds ultimately were allocated to or spent by local governments, nonprofi ts, and private sector contractors. However, state capacity
was still crucial to the effi ciency with which that money was spent,
for a number of reasons. First, states exercise considerable discretion in these types of “pass-through” decisions, and work suggests that state government capacity has a signifi cant infl uence on how they exercise that discretion (Nicholson-Crotty and Nicholson-Crotty 2014). Research has also demonstrated that the manner in which competitive grants are awarded to and spent by subgrantees is partly a function of state-level administrative characteristics (Collins and Gerber 2006). For those funds awarded by contract, there is also signifi cant evidence that state capacity to write and monitor service contracts has an impact on the performance of federal programs (see Johnston and Romzek 1999). Finally, our interviews with state
offi cials suggest that there was signifi cant variation in the amount of
guidance regarding ARRA requirements that state agencies were able to give to contractors and other subgrantees.
A Theory of Implementation Success for ARRA Energy Programs
Our key research question in this project is why some jurisdictions were able to spend a larger portion of ARRA funds each year and therefore were better able to realize one of the key goals of the pro-gram. In this section, we draw on and extend the large literature on intergovernmental implementation to begin answering this question.
Research Design
Th is analysis employs a mixed-methods research design. First, this
analysis relies on an empirical model of the statistical relationship between state capacity, federal guidance, and states’ ARRA spend-ing. Second, this analysis presents in-depth interviews conducted with state agency representatives responsible for spending energy-related ARRA funds.
Estimation Strategy
Th is analysis fi rst estimates an empirical model to predict which
factors are correlated with states’ ability to spend their energy funds.
Th e data run between 2009 and 2012, which captures all four years
in which ARRA funds were to be spent, with the exception of those few programs that were allowed extensions through 2013.
Th e dependent variable is the percentage of a state’s obligated funds
available in a year that were actually spent each year. Th is fi gure,
therefore, is the total annual amount obligated divided by the total annual amount received, where the states do not actually receive
their funds until they are ready to spend it.4 Because one of the
pri-mary goals of the Recovery Act was spending effi ciency (Aldy 2013),
a measure of percentage of funds spent should accurately represent
spending performance. Th e data are extracted from the Recovery.gov
Web site and represent contract, grant, and loan funding for energy programs overseen by the U.S. Department of Energy (DOE) under
the Energy Effi ciency and Renewable Energy program (Recovery.
gov 2013a).5 Th is includes all energy programs reviewed in earlier,
except the EAP program, and includes a range of other smaller
pro-grams as well.6 Th e fi ve programs reviewed earlier, however, made
up the bulk of state-level energy-related program funding.7
In order to ensure that our operational choices do not drive our results, we use two separate measures of state capacity. First, we create a measure of relevant policy experience that captures the existence and character of renewable portfolio standards (RPS) policy within a state. An RPS is a mandate that a certain percentage of a state’s electricity must come from renewable energy by a specifi c date (e.g., 25 percent renewable energy by 2025). An RPS policy is the most prevalent energy policy used across the U.S. states, present as either a manda-tory or a voluntary policy in 37 states as of the end of 2013 and also cited as one of the primary drivers of renewable energy development
(Carley 2011). Th erefore, it should represent not only policy
experi-ence relevant to the goals of the ARRA’s energy programs but also
state commitment and the capacity to develop such policies. Th e
spe-cifi c measure included in models discussed here is the number of years that a state had a renewable portfolio standard in place, weighted by
the stringency of that standard.8 Th e RPS
pol-icy data were extracted from the Database for
State Incentives for Renewables and Effi ciency
(North Carolina Solar Center 2013).
As a second measure of implementation ity, we use the fi nancial management capac-ity measure developed by the Government
Performance Project (GPP). Th e Pew Charitable
Trusts (2008), in association with a group of public management and planning scholars, uses thousands of interviews with state offi cials, documentary sources, and data on government we suggest that guidance and capacity likely interact in the
determi-nation of implementation success, including in the implementation of the ARRA.
We are obviously not the fi rst to suggest that factors from dif-ferent levels or stages in the implementation process are jointly responsible for the success of failure of that process. As an example, Van Meter and Van Horn’s (1973) conceptual model argues that “interorganizational communication,” which sounds a lot like guidance in the authors’ description, infl uences and is “fi ltered through” the perceptions of implementers to, ultimately, determine implementation performance. Goggin et al. (1990) deal explicitly with intergovernmental implementation and posit a communications model in which federal-level inducements and constraints, such as the clarity and consistency of the policy, work through the state’s capacity to act in the production of implemen-tation outcomes.
We build on these earlier models of intergovernmental implementa-tion in a couple of ways. First, we off er precise hypotheses about the ways in which federal guidance and state capacity work together in determining implementation success. Previous work has touched on related concepts, but it has not explicitly theorized about the rela-tionship between guidance and capacity. Previous studies also have not explicitly tested for a relationship between federal infl uences such as guidance, state infl uences such as capacity, and implementa-tion success. Our second contribuimplementa-tion is to off er such a test, which will allow us more precise insights into the ways in which guidance and capacity may act as substitutes for one another in the imple-mentation of intergovernmental programs.
As noted earlier, defi nitions of capacity vary but typically contain some combination of relevant technical skills, the existence and leveraging of relevant organizational experiences, adequate resources, the cognitive skills necessary to learn and adapt, and human capital or adequate personnel resources (see Howlett 2009 for a review). Additionally, the research suggests that prominent subnational actors must support programs, and have the confi dence to make decisions that enhance implementation, if those programs are to succeed (Krause 2012; McCarty 2009). Technical skills, knowledge of relevant laws and regulation, and the clarity needed by recipient jurisdictions to make good implementation decisions are exactly what guidance is intended to provide (see Galston and Tibbetts 1994; Harris 2010). Because of the conceptual overlap between fed-eral guidance and the factors that make up “capacity,” it is likely that these contributors to implementation success may best be conceived of as substitutes for one another.
Jurisdictions that have the human capital, management acumen, and relevant policy experience should make sound implementa-tion decisions even in the absence of federal information, while those jurisdictions with limited capacity may not. Substantial guid-ance that can help low-capacity jurisdictions navigate the complexity of federal programs should narrow that gap, however, and decrease the observed importance of interjurisdictional
capacity for program success.3
even in the absence of federal
information, while those
jurisdictions with limited
issued by the DOE were gathered from Federal Funds Information for States (2013). Obviously, this variable is highly correlated with the passage of time; in order to isolate the impact of guidance, therefore, we include a year counter in the models discussed later.
Th at allows us to interpret the guidance variable as the impact of
federal information on implementation success after controlling for the passage of time.
Because the key hypothesis is interactive, the model presented here includes a multiplicative interaction between the measure of DOE guidance and the relevant measure of capacity.
One must also control for other economic and demographic factors
that could aff ect a state’s ability to spend their ARRA funds effi
-ciently, as well as its government capacity. For example, one might expect that states with more dense populations would spend money
more effi ciently because these factors correlate with greater
capac-ity on dimensions other than those captured in our specifi c capaccapac-ity measures. Similarly, states with less wealth should have spent a greater proportion of their funds because the need to stimulate the economy and off set the impacts of the great recession was more acute. We also believe that the unemployment rate likely infl uenced the expenditure rate, although the direction of that infl uence is debatable. On the one hand, we might expect unemployment to be negatively correlated with implementation success because fewer people out of work signals a more vibrant economy and, hence, more “shovel-ready” projects to which funds could be funneled. Alternatively, we might expect it to be positively correlated, as states feel the pressure to spend money quickly in order to get people back to work.
Th e controls that we include in the models are measures of
popula-tion density, gross state product (GSP) per capita, and unemployment
rate.9 Population density was derived using land area published by
the National Atlas (2013). GSP per capita and unemployment rate were obtained from the U.S. Bureau of Economic Analysis (2013) and the U.S. Bureau of Labor Statistics (2013), respectively. We also include an indicator of gubernatorial partisanship on the assump-tion that Democratic governors may have had higher goal alignments with the Obama administration’s stimulus program and, therefore,
sought to implement the programs more effi ciently. Th is hypothesis
is also driven by the fi ndings of Jennings, Hall, and Zhang (2012) that gubernatorial partisanship was one of the most important fac-tors determining whether states adhered to strict transparency and accountability procedures with their ARRA program reporting. Table 1 presents the summary statistics for the sample.
We use panel data on all U.S. states to estimate the following equation:
Yit= α0 + β1C1it + β2Git * C1it+ β1C2it + β2Git * C2it + β2Git + γ1Xit + εit,
where Y represents the percentage of
obli-gated funds spent in state i and in year t,C1
and C2 represent the two measures of
capac-ity, G represents guidance, X is a vector of control variables that includes the time trend,
and ε is the error term.10 Th e GPP measure is
only available for 2008 and therefore is time invariant in our sample. As a result, we can-not include state fi xed eff ects in the model. performance to grade the states on their capacity to manage resources
and programs for the public good. Because we are most interested in the ability to manage ARRA funds, we use the fi nancial management
scores. Interviews with state offi cials, discussed at length in subsequent
sections, reveal that much of the delay in spending ARRA funds arose from limited capacity among state actors to negotiate requirements such as the Davis-Bacon Act prevailing wage standards tied to the funds, limited capacity to assist subcontractors who were also unfamiliar with the requirements, and the absence of transparency of accounting
and reporting procedures required by the Recovery Act. Th e “money”
score in the GPP measures, among other things, the transparency of the budgeting process, the capacity and rationality of state fi nancial management activities, the presence of sound internal controls for procurement and other state spending activities, and the regularity and eff ectiveness of a state’s audits of its fi nancial activities. In other words, it provides a measure of capacity based on many of the things that were directly related to a state’s ability to plan for, spend, and measure the impact of large quantities of ARRA funds.
Although the GPP grades have been criticized, particularly by states that score poorly (see Coplin, Merget, and Bordeaux 2002), the measures have been validated as a sound indicator of management capacity in numerous studies (Coggburn and Schneider 2003; Hou
2006; Knack 2002). Th e model discussed here includes only the
2008 fi nancial management scores, which are the latest available and, conveniently, were calculated in the year immediately prior to
the Recovery Act. Th eoretically, the variable ranges from 0 (F) to 12
(A), but in our sample, the lowest grade received was a D+, which corresponds to a value of 4.
Th e next key variable of interest is federal guidance, which is a
cumulative count of all Recovery Act guidance and technical
trainings off ered by the DOE in each year. Th e U.S. Offi ce of
Management and Budget and other agencies off ered a small amount of guidance relevant to energy programming during the Recovery Act, but we focus on information from the DOE, for a couple of
reasons. First, it was the only guidance mentioned by the
numer-ous state offi cials we spoke with about their role in spending these
funds. Second, the volume of relevant DOE guidance was signifi -cantly higher than from other agencies, and, based on our theoreti-cal story, it should therefore be responsible for the largest share of any observed impact on state behavior. Any impact from the small amount of guidance from other agencies should bias the results toward the null or away from our expectations.
We choose the cumulative measure rather than an annual count because, of course, states were able to use guidance to improve their programs at any time after it was issued. By the end of the disburse-ment period, the DOE had issued 19 guidance and technical train-ing publications or webinars, but the pace of
federal information was very uneven. Only six pieces of guidance were off ered to the states
and their partners in 2009. Th e second year
of the program was the most active for federal information, with the release of 11 guidance documents, followed by three fi nal pieces in
2011. Th is variable does not vary across states,
only over time. Data on the number and characteristics of energy program documents
By the end of the disbursement
period, the DOE had issued 19
guidance and technical training
publications or webinars, but
the pace of federal information
Nebraska, and Oklahoma, a single agency was responsible for both programs. Most respondents were employed by their agencies before the ARRA funding period, but a small portion of respondents were
hired during the ARRA funding period. Th e most common job title
carried by recipients was program manager or coordinator. Other common titles included division or agency director, technical special-ist, or grant administrator. In Maine, a public–private partnership was responsible for administering SEP projects; therefore, respond-ents in Maine were not strictly public employees, as in other states.
Respondent states’ energy offi ces were located in various divisions
of government. It was most common for respondent agencies to be
independently organized energy offi ces or departments. It was also
common for respondent agencies to be located within state govern-ment divisions for commerce, community and economic develop-ment, or the environment and natural resources.
Of those individuals whom we contacted to participate in the interviews, 48.6 percent responded to our request with some com-munication, and 51.4 percent did not. Within the overall group of potential respondents, 20.8 percent participated in interviews.
When more than one respondent from a given state participated in our interview, we weighed the responses equally. Some
inter-views involved conference calls with a group of state offi cials who
all worked on the same set of programs; responses in this case were quite homogeneous. In some other cases, respondents from the same state worked on diff erent programs, and we spoke with these individuals separately. We did not fi nd any cases of confl icting
infor-mation provided by offi cials within the same state.
Because the dependent variable is a ratio, traditional ordinary least squares can produce unrealistic predictions that fall outside the actual values of 0 and 1. In order to avoid this, we estimate the equation using a fractional logit approach. Specifi cally, we use a generalized linear model for panel data that can accommodate a binomial distribution.
In-Depth Interviews
While our rationale for including diff erent capacity measures is to account for some of the inaccuracies associated with using any one specifi c variable as a proxy for capacity, it is still the case that the collection of quantitative results cannot provide a complete picture of the capacity and guidance dynamics that occurred throughout the implementation of energy-related ARRA programs. To buttress and add nuance to the regression results, we also rely on an analysis of in-depth interview data. Results of the mixed-method approach are presented together in the Results section.
Interviews were initiated by e-mail and conducted over the phone
between May and October 2013. Th e participants were state agency
representatives who handled ARRA funds and were actively involved in energy-related ARRA programs. Participants were identifi ed online using state-level ARRA reports on the Recovery.gov Web site,
the National Association of State Energy Offi ces’ Web site, and
indi-vidual state agency Web sites. When possible, we relied on snowball sampling to identify other participants.
All interviews were guided by an interview template, which was
provided to respondents ahead of the interview upon request. Th e
interview template included questions on, among other things, the types of ARRA activities in which a respondent’s agency was involved; perceived diff erences in activities, funding, and person-nel before, during, and after the ARRA implementation period; the degree to which federal guidance was clear; which factors made it
more or less diffi cult to comply with requirements; and which
out-comes were achieved through Recovery Act programs. Th e interview
protocol also included questions specifi cally related to the respond-ent, such as work history, professional title, work responsibilities, and tenure at the organization.
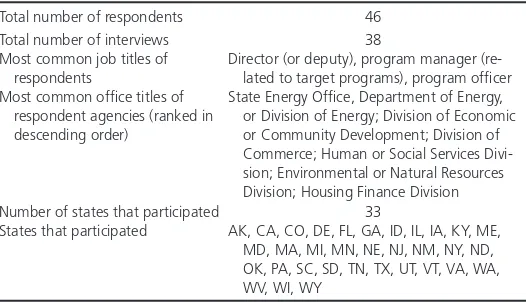
Table 2 provides an overview of the interview sample, including
information on the total number of respondents,11 interviews, and
states represented by respondents; the most common job titles of respondents; and the most common titles of respondent agencies. All respondents worked in a state agency that the DOE had des-ignated as responsible for the SEP or WAP. In Alaska, Minnesota,
Table 2. Interview Sample Descriptive Information
Total number of respondents 46
Total number of interviews 38
Most common job titles of respondents
Director (or deputy), program manager (re-lated to target programs), program offi cer Most common offi ce titles of
respondent agencies (ranked in descending order)
State Energy Offi ce, Department of Energy, or Division of Energy; Division of Economic or Community Development; Division of Commerce; Human or Social Services Divi-sion; Environmental or Natural Resources Division; Housing Finance Division Number of states that participated 33
States that participated AK, CA, CO, DE, FL, GA, ID, IL, IA, KY, ME, MD, MA, MI, MN, NE, NJ, NM, NY, ND, OK, PA, SC, SD, TN, TX, UT, VT, VA, WA, WV, WI, WY
Table 1 Descriptive Statistics
Variable Description Obs. Mean SD Min. Max.
Percentage DOE funds spent Percentage of state’s obligated funds that were actually spent each year 200 35.09% 0.266 0.0029 0.954
DOE guidance Count of federal DOE ARRA guidance documents 200 15 5.35 6 19
RPS Number of years that a state had a renewable portfolio standard, weighted by the stringency of the standard (% new generation/number of years)
200 375.30% 463.63 0 2101.5
Implementation capacity Government Performance Project measure of fi nancial management capacity 200 8.00 1.90 4 12
Population density State population divided by state area 200 194.78 257.77 1.22 1195.17
GSP per capita Gross state product per capita 200 0.467 0.00895 0.0314 0.0719
Unemployment rate Percentage of state workforce that is unemployed 200 8.14% 1.98 3.10 13.80
Democratic governor State has a Democratic governor 200 47.50% 0.500 0 1
funding period, and “all the states were clamoring for the same few
manufacturers in the United States.”13
The Importance of Capacity
Not surprisingly, given the high administrative burdens associated with the ARRA, many respondents discussed the importance of
existing administrative capacity in the implementation process. Th e
sources of this capacity varied, but, consistent with the literature, they often centered on leveraging human capital. One respondent shared, “I was already retired, but they called me to come back and participate in the management process and project oversight.” Many respondents reported respondent agency staff experience as a reason for successful implementation of ARRA programs. One respondent shared this experience:
We’re fortunate to have an offi ce here with numerous people
with 20 or more years of experience in this fi eld. So certainly, having a windfall of money, there were people who had thought of diff erent programs and ideas for years but simply never had the funding before. I think we were able to hit the ground running with programs we had always wanted to run but could never aff ord.
In addition to existing personnel, most respondents who spoke of capacity focused on the growth of staff during the funding period. Almost 60 percent of respondents (20) reported that their agencies had hired additional staff during the funding period.
Th e remaining 40 percent of agencies did not report increasing staff
size. In these cases, it seemed as if a lack of management capacity
or acumen prior to the arrival or ARRA funds was to blame. For
example, the most frequently cited barriers to staff expansion were state hiring rules or the unwillingness of personnel managers to adapt those rules. One respondent explained that “in state govern-ment it’s very hard to move quickly. For example, I put in a request for a modest add of staff —I think it was fi ve or six additional fi eld staff to monitor projects—and that took about six or eight months to get that approved.” Some respondents also reported that agency leadership slowed or prohibited staff expansion during the funding period. As one explained, “Even though we had funding, we did not have the support to hire additional staff .”
Although personnel was a frequently cited source of capacity, many respondents also noted the importance of relevant policy experience. As an example, one respondent whose agency reported considerable success in administering ARRA funds off ered this: “We have a lot of experience with this program. We were one of the leaders. We had a lot of infl uence on the way the program was structured historically, before ARRA. We [also] did have a lot of administrative resources
that came with the money, which was a big help.” Th at
respond-ent quickly added, “We had good managemrespond-ent in place. We had a
strong network of energy effi ciency providers in the fi eld across our
state. I can’t overlook that.”
A respondent from a diff erent state similarly attributed part of her state’s success to existing policy experience. She noted that in 2009,
We had recently closed and started awarding grants for programs called [redacted 1] and [redacted 2]. Both of those were programs for [clean and renewable energy] deployment projects. We had
Results
Setting the Context: Recovery Act Implementation
Many ARRA programs existed before 2009 but grew dramatically in size and funding as a result of the Recovery Act. For example, although the SEP existed as a formula grant for many years before ARRA, one respondent said that before 2009, her agency’s SEP “annual allocation was very insignifi cant.” Similarly, respondent agencies responsible for WAP programs also reported that weath-erization budgets increased by as much as a factor of 50 during the Recovery Act funding period. A respondent involved in admin-istering EECBG programs described Recovery Act funding as “a hundred times our normal federal operating budget.”
In addition to increases in the size of allocations, respondents also suggested that the Recovery Act dramatically increased the require-ments that accompanied federal funds. In the interviews, the most commonly discussed requirements were fl ow down requirements. Flow down requirements take their name from the fact that they apply not only to grantees but also subgrantees. Examples of fl ow down requirements include compliance with the prevailing wage and Buy America provisions of ARRA, the National Environmental
Policy Act, and various historic preservation acts.12
Numerous respondents suggested that the process of collecting and processing information necessary to comply with these requirements aff ected program implementation. As one respondent explained,
With the Davis-Bacon [prevailing wage requirements], you have to rely on the subcontractors to send in their reports to make sure that the plumbing contractor or the furnace con-tractor was paying the correct wage … and do their monthly reports. Any time you have to wait to do your report, if you’re waiting for somebody else to get you the information, it slows down the process quite a bit.
Th e reporting burden also fell on subgrantees, including
contrac-tors who may not have had the capacity to comply. A respond-ent said that “we actually had some contractors say that we don’t want to do the work for you if we’ve got to do these reports.” While such a reaction is extreme, it demonstrates that the reach of prevailing wage requirements extended well beyond respondent agencies.
Th e Buy America provisions of the ARRA required that certain
products purchased with grant funds be produced domestically.
Typical energy effi ciency improvement products covered by these
requirements included furnaces, industrial heating and cooling equipment, and light bulbs. Compliance with the Buy America requirements created signifi cant challenges for some grantees. One respondent recalled that “prior to 2009, you couldn’t buy an indus-trial chiller in the United States. It was all done in India. We had a couple projects within state government where we had to go get special provisions to go to India to buy the chiller to bring it back to install.”
Another explained,
Within the state weatherization program, we waited a whole year to be able to expend any of those funds because we were waiting on some clarifi cation on the Davis-Bacon language and what wages to pay for Davis-Bacon. Finally, a year after that, we still didn’t have an answer, and they said, “Why don’t you just start paying them the 2008 Davis-Bacon wages?”
Many respondents reported that the DOE guidance improved over the ARRA funding period. A respondent said that “at the very beginning of the program the guidelines were very unclear,” but they “started to become somewhat clear as it progressed.”
Model Results
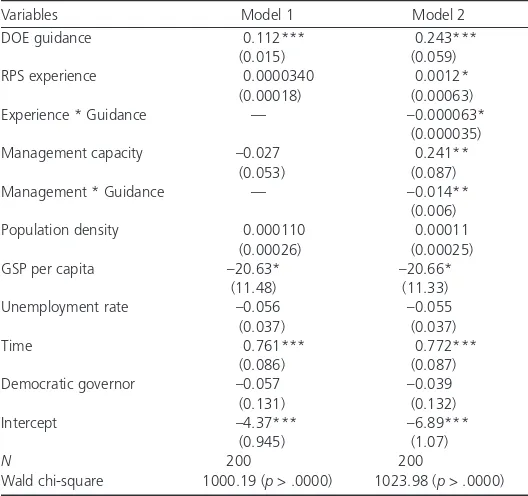
Th e results from the quantitative model are presented in table 3;
model 1 does not include interaction terms, and model 2 does. We focus our discussion on the model 2 results. Before moving to the results of theoretical interest, we take a moment to examine the
control variables. Th e passage of time had by far the largest eff ect
on state success in spending ARRA funds. We include this measure to allow us to partial out the impact of federal guidance, which
increased over time, but the large positive coeffi cient suggests that,
all else being equal, states got signifi cantly better at spending clean energy money as they gained more experi-ence with ARRA programs. As expected, state wealth was negatively correlated with expen-ditures, suggesting that economically strug-gling states may have had greater incentives to stimulate the economy with Recovery Act
funds. Th e unemployment rate fell just short
of traditional levels of statistical signifi cance but was negatively signed, which might recently funded a bunch of projects, and ARRA came along.
Typically, those programs were way oversubscribed, so there were always good projects that we just couldn’t fund because we never had enough money. So, the Recovery Act came, and we said, let’s get this money out the door.
Federal Guidance
Because of the size and administrative complexity of the ARRA awards, numerous respondents also talked about the importance of federal guidance on issues of program design, implementation, and
compliance. Th e prevailing wage requirements associated with the
ARRA projects in particular were cited as a signifi cant impediment to implementation because many of the contractors and subcontrac-tors receiving funds had little or no experience with federal contracts
(Wyatt 2009). Our interviews with state offi cials revealed that some
states did not have the capacity to help subgrantees negotiate require-ments or educate private sector partners about the need and practice for calculating wages and benefi ts in accordance with prevailing wage requirements. Recognizing this fact, the DOE published “Frequently
Asked Questions on Davis-Bacon Compliance”in December 2009.
Six months later, it expanded that eff ort with the “Desk Guide to the Davis-Bacon Act,” which provided a signifi cantly abbreviated and relatively user-friendly reference for both states and
contrac-tors spending ARRA money.14As another example, some states had
limited experience with performance contract-ing—the preferred method for distributing ARRA energy program funds—and lacked the resources to hire experienced personnel. In response, the DOE hosted a series of webinars
for state offi cials on the subject in December
2009.15 Th e contracting webinars were focused
not only on the technical aspects of perform-ance contracting but also on the experiences of other states with the tool.
Indeed, federal ARRA guidance was often targeted at helping states without signifi cant experience in energy policy learn from those that had such experience. For example, in November 2009, the DOE hosted a webinar on “State Policy Aff ecting Renewable Energy
Technology.” Th e purpose of the meeting was to provide a review
of current state policies regarding markets for renewable energy
technologies and off er some assessment of their eff ectiveness.16 As
another, and more ambitious example, the DOE created a State Energy Resources Program, which maintains an archive of publica-tions and publishes a bimonthly newsletter highlighting state
experi-ence with the SEP.17
Several interview respondents highlighted the fact that a signifi cant portion of this guidance was not available for grantees at the begin-ning of the funding period. Regarding federal guidelines, one pair of respondents recalled,
We would like to say that they [the DOE] were kind of a
mess. Th e only reason we say that is that a lot of times, we
wouldn’t get guidelines until like nine months after we imple-mented something. … Some of the guidelines that would come out would be a one-page document and some of the guidelines that would come out would be like eight to ten and it would be nine months after we had implemented.
Table 3. Model Results for Dependent Variable: Percentage of State DOE Funds Spent
Note: Numbers in parentheses are robust standard errors. *p < .1; **p < .05; ***p < .001.
Federal American Recovery and
Reinvestment Act guidance was
often targeted at helping states
could help to close the gap in implementation success between high- and low-capacity recipients. In order to see whether that was the case in ARRA energy programs, we can look at the interaction from a diff erent perspective. Figures 4 and 5 graph the marginal eff ects of suggest a positive correlation between employment and ongoing
projects that could be quickly infused with Recovery Act funds. Our other controls failed to reach statistical signifi cance.
Both the measure of previous renewable energy policy experience and the GPP variable measuring fi nancial management capacity were positively associated with the proportion of obligated energy funds spent in each state annually. Similarly, the measure of federal guidance was positively related to the dependent variable. Because of the presence of the interaction terms, however, the only way to conclusively test for the impact of DOE guidance and any mod-erating eff ect that state capacity may have had on that impact is to plot the relationships (see Brambor, Clark, and Golder 2002; Kam and Franzese 2009). Figures 2 and 3 present the marginal eff ects of DOE guidance on the proportion of obligated Recovery Act energy funds spent across the measures of state capacity.
Figure 2 presents the moderating impact of RPS policies; as the fi gure suggests, guidance had a signifi cant eff ect on the proportion
of obligated funds spent across the entire range of that variable. Th e
plot also indicates, however, that the eff ect of information from DOE diminished as relevant policy experience increased. Specifi cally, it indicates that guidance had approximately a 20 percent smaller impact in states one standard deviation above the mean for the duration and stringency of RPS policies compared with those one standard deviation above the mean on that level of capacity.
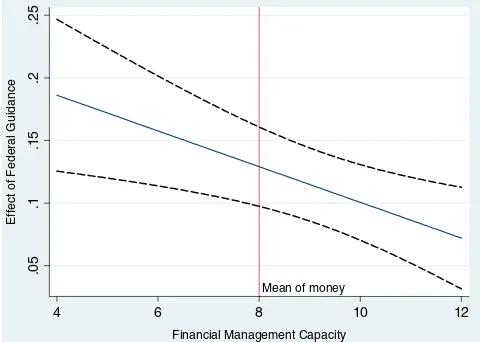
Figure 3 plots the marginal eff ects of guidance with the GPP fi nancial management score on the x-axis. Again, plotting the eff ects reveals that guidance was signifi cant across the range of the capac-ity measure and that the impact of federal information decreased as state-level ability increased. In this case, the substantive impact is considerably larger, with the marginal eff ect of guidance decreasing by 50 percent as we move from states that received a grade of C for fi nancial management (–1 SD) to those that received a B+ (+1 SD).
Th e results discussed so far support our theoretical assertion that
federal guidance should matter more in those jurisdictions that did not already possess the capacity to implement complex intergovern-mental programming. We also argued, however, that such guidance
Mean of rpswghtyrs
Figure 2 Effect of Federal Guidance on Expenditure Ratio at Different Levels of Prior Policy Experience
Mean of money
Figure 3 Effect of Federal Guidance on Expenditure Ratio at Different Levels of Financial Management Capacity
Mean of doeguid
Figure 5 Effect of Financial Management Capacity on Expenditure Ratio at Different Levels of Federal Guidance
Mean of doeguid
onerous, the respondent said, “I think [transparency requirements were] easy to comply with. I don’t necessarily think it was a barrier. It was something diff erent….One of the things that helped with the transparency was to understand where the money was going and what entities were eligible to receive it.”
Conclusion
Th is analysis began with a puzzle—why were some states more
effi cient than their peers at spending clean energy funds allocated
under the ARRA? Drawing on and extending the large literature on intergovernmental implementation, we suggested that administra-tive capacity was a key predictor of success, but federal guidance should have helped close the gap between high-and low-capacity jurisdictions as the implementation process went along. We explored this assertion suing a mixed-methods approach that mod-eled empirically expenditures of ARRA energy funds in the states between 2009 and 2012 and drew on interviews with more than three dozen state agency personnel who were directly responsible for the administration of energy funds.
It is important to note that this analysis focused specifi cally on the proportion of obligated funds that states spent in each year as
a measure of implementation success. Th ere are obviously other
avenues of inquiry and, thus, other measures that one could use to examine the success that states experienced with their ARRA programs. For example, one could study the cost-eff ectiveness of individual programs and use program outcome measures, such as the number of homes weatherized through the WAP program. Nonetheless, because stimulating the economy through an infusion
of federal funds was one of the key goals of the ARRA, the effi ciency
with which states spent that money is a plausible measure of success.
Th e regression results confi rm that implementation capacity,
meas-ured as relevant policy experience and management quality, had a positive impact on the speed with which jurisdictions were able to
spend ARRA monies. Th ey also suggest, however, that increased
fed-eral guidance eliminated the impact of experiential capacity by the
end of the second year of the program. Th e interview results help set
the context for that fi nding by confi rming that the ARRA repre-sented an often unprecedented increase in the amount of money states had to spend on energy projects and that the strict reporting, fl ow down, and administrative requirements that accompanied those funds posed serious challenges to successful implementation
in some states. Th e interviews also suggest that there was signifi cant
variation in the capacity that respondents believed their states had to deal with the complexities of the ARRA and that some states thought that federal guidance for the programs came too late and was more limited that it could have been. Finally, the interviews lent some credence to the patterns observed in the quantitative analyses regarding the interaction of guidance and capacity in the determina-tion of implementadetermina-tion success.
Although the results presented in this analysis are specifi c to energy projects funded under the ARRA, we believe that they are worthy of note for a couple of reasons. First, the WAP, SEP, EECBG, AR, and EAP programs, as funded under the Recovery Act, represented an enormous investment in renewable energy and conservation by the federal government. As such, the sheer magnitude of this attempt to promote national energy policy goals through grants to subnational relevant policy experience and fi nancial management capacity across
the range of the guidance variable. Th is allows us to see whether
states with high capacity continued to spend ARRA funds more
effi ciently as the level of federal guidance went up.
Consistent with expectations, the plotted eff ects suggest that, all else being equal, they did not. Specifi cally, they suggest that hav-ing more experience with RPS policies had a positive but dimin-ishing eff ect on the ratio of obligated ARRA energy funds spent by a state when guidance was low. By the time the DOE had issued 12 pieces of program guidance, however, the impact of policy
experience became statistically insignifi cant. Th e same pattern
holds in fi gure 5, which suggests that fi nancial management capac-ity was a signifi cant contributor to implementation success until the federal government had issued roughly 12 pieces of guidance. At that point, the advantage that high-capacity states had over those with less fi nancial acumen in spending ARRA energy funds disappears.
Capacity, Guidance, and Effi ciency
Our interviews with the Recovery Act administrators confi rm that the funding was accompanied by a host of requirements, and for some, complying with these requirements delayed
imple-mentation. Th ey also suggest that delays in federal guidance
on how to spend the money created signifi cant administrative challenges in some jurisdictions, including delays in program development and implementation. All respondents reported that some degree of administrative change was necessary for success-ful program implementation, but the interviews reveal that in some cases, existing administrative capacity greatly facilitated that process.
Th e interviews also confi rm our assertion that federal guidance was
more important for some types of jurisdictions. Specifi cally, we found that respondents who spoke positively of capacity, because of existing personnel, staff growth, or contracting, were less likely than others to complain about either the burdens associated with ARRA requirements or the quality of federal guidance.
Of course, there were states that had or built substantial capac-ity and were nonetheless highly critical of DOE guidance, but the perceived lack of federal assistance did not have as substantial an impact on these jurisdictions’ ability to negotiate ARRA require-ments or spend funds in a timely fashion. As an example, one respondent criticized the DOE’s lack of planning, suggesting that “if they spent some more time defi ning those objectives at the beginning, I think a lot of these programs could have been more successful and they could have achieved more of the goals the federal government wanted them to achieve.” He went on, however, to laud his own state’s fl exibility and capacity in the management of ARRA funds. Specifi cally, he indicated that “a lot of it was just good management; hiring good, quality staff ; and realizing that we have a purpose of what we need to do.”
3. It is important to note one additional factor that might infl uence the effi ciency with which states spent they obligated ARRA energy funds. Nicholson-Crotty (2012) demonstrates that states sometimes intentionally leave federal grant money “on the table” for partisan and electoral reasons. It is possible that some states strategically chose to spend less of their obligated stimulus money for these same reason. To the degree that this is the case, however, it should simply bias the results against our expectations because if states chose not to spend ARRA money for political reasons, then federal guidance, state capacity, or the interac-tion of the two should not have any impact on that choice.
4. Th e majority of ARRA funds were obligated by 2009, with smaller amounts trickling in thereafter. Once a state spent a dollar, that dollar would no longer appear in the denominator of the next year’s dependent variable calculation. Th erefore, technically, a state could spend 100 percent of its funds in each year, assuming that the federal government obligated new funds to that state each year and the state exhausted those funds before the year’s end. More likely, however, a state would spend a small percentage of its funds in early years and carry over the unspent obligated funds in later years but increase the percentage by which it spent those funds in each subsequent year.
5. Annual estimates were obtained by selecting fi gures from the last week of the year, as all dollar values are cumulative over the course of a year. Th e database manager at Recovery.gov helped confi rm the accuracy of our approach. 6. Additional programs include Community Facilities Loans and Grants;
Environmental Quality and Protection Resource Management; Offi ce of Science and Financial Assistance Program; Conservation Research and Development; Renewable Energy Research and Development; Energy Effi ciency and Renewable Energy Information Dissemination, Outreach, and Training and Technical Analysis; Electricity Delivery and Energy Reliability, Research, Development and Analysis; Energy Effi ciency and Renewable Energy Technology Deployment, Demonstration and Commercialization; and Advanced Research and Projects Agency.
7. One should note that the programs that are captured under the same dependent variable may diff er in important ways. For example, the mechanisms for disburs-ing these funds varied across programs: some programs relied on loans, others on grants, and others yet on contracts. Th is variation in funding mechanism, as well as other variations in program design, administrative complexity, and network for technical assistance, was likely important and may have required greater levels of capacity or more frequent federal guidance for some programs. Th e data used for this analysis, however, do not allow one to disaggregate funding by individual program below the general DOE Energy Effi ciency and Renewable Energy program level. We used agency-reported data. Alternatively, if recipient-reported data were used, specifi c energy programs could be isolated, but at a signifi cant loss of data quality and reliability. Recipient-reported data vary greatly in reporting protocol, where some estimates are cumulative and others are one-time payments, and reporting does not always coincide with the one-time period in which the funds were actually spent. Given these limitations, we elected to use agency-reported data and forgo the ability to draw inferences from specifi c energy programs. Future studies could revisit this analysis with a research design that focuses specifi cally on individual programs and the diff erences among them, perhaps again through focused interviews but with interview questions aimed at extracting information about program diff erences. For case studies on specifi c Recovery Act energy programs and the implementation delays associated with each, refer to Carley and Hyman (2014).
8. Th is variable only considers RPS policies to exist if the policy was both enacted and requested compliance by qualifi ed utilities. Stringency is defi ned as the total new renewable energy needed to comply with the policy divided by the number of years in which a state has to reach this limit.
9. Additionally, it would be ideal to include a measure of the importance of the energy sector to a state’s economy, such as the percentage of GSP from fossil fuel manufacturing and extraction out of a state’s total GSP. Data for such a variable, however, are not available through 2012.
governments makes it important to understand the factors that infl u-enced eff ectiveness. Given the salience of clean and renewable energy, it is also unlikely that this will be the last signifi cant attempt by Washington to stimulate state and local policy in these areas, which makes an understanding of eff ective intergovernmental energy policy implementation even more important moving forward.
Th e results are also signifi cant, we believe, because they further our
understanding of intergovernmental implementation more gener-ally. Previous work has suggested that federal and state factors might be jointly responsible for the success of these programs (see Goggin et al. 1990), but it has not articulated precise theoretical expecta-tions about the ways in which factors like guidance and capacity might interact in the implementation process. Moreover, guidance
and capacity have been treated as independent infl uences in
empiri-cal studies of implementation success. Our results suggest, however, that doing so will cause analysts to underestimate the importance of, and need for, guidance in some jurisdictions. Given the admin-istrative complexity of the ARRA, we are most confi dent in this conclusion for programs that have signifi cant reporting, fl ow down, and transparency requirements.
Because these types of requirements are far from rare in intergov-ernmental programming, however, we believe that the fi ndings regarding the factors that condition implementation success in the intergovernmental programs studied here are likely applicable to numerous other programs. Obviously, however, more research is necessary to confi rm that supposition. One fruitful design to assess the extent to which the results generalize would compare imple-mentation success in administratively complex program areas like renewable energy with areas such as infrastructure construction, where states have a great deal of experience spending federal money. For a more controlled comparison, it would also be useful to disag-gregate WAP, SEP, EECBG, AR, and EAP spending to see whether the diff erences in complexity and prior state experience with these
individual programs infl uenced the effi ciency with which states were
able to spend these funds. As noted earlier, parsing out program specifi c expenditures is currently very challenging, but we plan to pursue this design and encourage others to do the same in future studies.
Notes
1. Although the data cannot be disaggregated by state, the total amount of energy-related DOE contract, grant, and loan funds that expired, as of the end of 2012, was $690,743,991 (Recovery.org 2013a), which suggests that a great deal of “stimulus” went unadministered. Th e majority of these funds, however, likely were associated with the 1705 loan guarantee program.