ISSN
1916-9728
(Online)
International
Journal
of
Ecortornics
and
Finance
:: -,_.r \ t\-:--"rZ:- 1:ur1 y 5 -1 ::-:u7 ;-tr1t 1 \sl.nDU[rroEr\
PIPUI 'IIIIBD \PIIA Prs iirltrl\'rsrx luiBrril
ue rlrf 'aa'I oeH-;unJ
BurqJ';r|a-8ues rusl
uBduf 'nA uaI(I-8uuJ ,\ueu:ag'ue,{nig uelsr:1 ,tueutreS'asse[l selqol oJuerc' rnoeJno g lilJnoel eluuetPnD'IeszeI g srloquzs ,{ueru.tag'asno5 pue^S
,(ay:n1'ueru:t3a1t uetur(al nS
erpul'rEIBUelPd uesB \ tu LIs eruuu.roU'nttu:u(nclP 1 1:,Lrllt'q
yil'slpuE) :rl'jr
tlr \\II-'I qlq-) : :
rtnqJ Su"\ :
-YS
r?rullu(lu lllrPuf
Ili:aUlrPUl rlUarUd etpul 'eirloq :rut:6 etpq 'c,iuoureg eu:er6 $r-ll 't[Buta,\ PesP:d pllulod'lElzslr\l ]lold vso 'naIUlnSN s.Lletd
aJe:r,tD'se8oc sl1)Lled euIqJ'ollqz oelqled pue1o4'e1su(zc1o5-1,(zo1e,uoy e [r[:lud ecuel'{'JeIT.leqJ 0ll-ued
EuaBrN'e{nuo r,(uue;1 ulnntug BrJeirN'O I elourrnlo urueluoU'rq8:r5 ete1orr51 erpul'eture a hl N Brsi(epr{'qBUttv wl+roN ptlor\ ErJaEtV'lt[[anD .uqie5 peruureqola,l upeuPJ'urBSSnH lnN peultueqor\l )n'JFstts peueqotr l )n'peppeql-J,{ paureqol\ eruPurou'nlei8 n.sauollttls BIatsqll\
{1ut1't11a3 ouetlttutssL'[\ '(1e]1'rur;-ir; t"t 1 1'1 1 utcrl5 'ttntttcl't;'n ' '
L ,' o.ll\31|i:I' -l "
-l:l: - :
-PuElrld t\iUt'.' 1rf z<i: -.:il ersie1c11 iuory ta.n Surl aLr:.q
Brsrunf -llIag Jesul )n 'auuuBJrr\l UBI
crs,(uler{ i}eqlag V ulessnH VSn ';uoC uurhnH erlu.usny'ruerq6g uos SuoH rd,{39'rryq1apqv H ueqslH
avn 'aeuuqoN urBqllBH erlBl]snv'3uo'I leH d1et1'eunpuurg eddasnrD
,i.Iet1'or:9,9 ruuu^olD ecuelg'sryu:e1iuz1 e8loa3 nr8.roa9'azptlasnqy l3.roa9
1n3nuo6 .1llP.1 !lJLIql-'D
IItLII]LLI!rH l.1r.U . ._l_.:-'
ll
1.il
\\ I u
lrlqr'lru
rr",l
, TiiI
rll n nil'lI(
:
€peueJ 'uoI)Bcnpa pue .lJuells
|i_l!: _; BluBtuotl'url!rlS Ee'llFuY
1?IIEllSnV'lpuEulol-JV .lltxY etuuulou'nlselnpeg eutlv llzeJg'lluouledlu arpuexalv eue8rS'ePuqtlY lae:s1 r[ePePY Brs[elu!\'peuqv Iezeu-pqv sJa/ha&all
Jo retueJ uetpuueJ 'SueqT lcuqrllN luDlslssv lDl.tollpz
uop8uI) pellun 'loodre^l-I .Jo ,(1tsre,^.tu11 tst{ereluIIleX
lllg
soIallsBA EurqJ 'looqrs sseulsng SssH ,(lrsle,trun iur-'104'lluPu
'l
Burql '8uo) 3uo11 ',{1rs,re,tlun rruq.cl,{lod;uo)
iuog
rq1'lnl
UEI\ tulYerlertsnv ',tlts.t.r rtu-l tll)'lEac 'ullll.Ir
\
,(1e11 'ut.rn1 1.r (lt<rl
\lu-l r":
:C
--\JQ1tp1 )10
vso'Ir(x,{\eN.Jo
,,(1tsla.rru1iltl
ruI - ''
E
Contents
l:r:r..n of the Long-RunDeterminants of U.S.-Canada S..i,,..-c.; Lu::-.::r
^::je
.-:--,ri & Xinya Wang
::ilrt]
of Bitcoin=" 3enefits Accounting, Its Impact on the Market Share Price. the \iolume of Credit Facilities
- .: -.i:S
.
'
- -.i' If andan, Marie Bany Khaled & Sakhr Bany Khaled,-
-:
--a.,t"t
the Implementation of Good Corporate Govemance in Control of Operation and: . :'.', anto & Aminullah Assagaf
.,::11
cf
the Cross-Sectionof
Overnight and Intraday Abnormal Returns: Evidence from the--:.:
R.IIT \Iarketr.- --i;;,;
*
Tiichiro Kawaguchi::: trr.;:r:1rilal Transmission of Authoritative Parenting Style: Evidence from Japan
-
.. ::r
Si:nsuke lkeda'
-:.
.::
::
Interest Rate Models and Its Effect on Bank Capital Requirements Regulation and..
Si:bllrn-
I
';ri_g. Reto Signer & Klaus Spremann:r-:es in fusk Tolerance and Asset Allocation among White, Black, and Hispanic Households in ai
-:::;
States. .1:soda
" ,
-::;-r
of Imports and Exports Performance on the Economic Growth of Somalia.
:.: : "t. "t;dir Ali, Ali Yassin Sheikh Ali & Mohamed Saney Dalmar- .';
::
C-\\IEL R:,ting Framework: A Comparative Performance Evaluation of Selected Baneladesl-r I*:
::e Commercial Banks' !
:
Z-;hidur Rahman & Md. Shohidul Islaml'1: je:atLng Effect of Political Risk on the Relationship between Capital Expenditure and Sectoral
::
r::mrc Growth in Kenya-i -:r:,ir llolonko & Samuel Nathaniel Ampah
i.::.rrs
that In{luence the Rate of Unemployment in Indonesia:
-,:,; -{. R. Puspadjuita--:,:La-Pakistan Economic CorridorAgreement: Impact on Shareholders of Pakistani Firms
' - -,;"
I
Ghani & Rajneesh Sharma,
::*::r
Effect Revisited: Evidence from Borsa Istanbul and Bucharest Stock Exchangei. ".--,; Sahin, Emre
Esat Tbpaloglu & Ilhan Eger. talonical Analysis on the Relationship between Banking Sector and Stock Market Development
-r: Bangladesh
S:ntan Biswas, Altaf Hossain, Arnqb Kumar Podder & Md. Nasd Hossain
Frnancial Constraints and Firm Capital Structure in Kenya
Benard Kipyegon Kirui & Seth Omondi Gor
Factors Affecting Consumer Attitude towards Financial Adverts in Ghana's Banking Industry J[bawuni Joseph & Nimako Gyasi Simon
t3
z)
32
46
64
/4
l -10
148
159
167
t77
International Journal of Economics and Finance; Vol. 10, No. 1; 2018 ISSN 1916-971X E-ISSN 1916-9728 Published by Canadian Center of Science and Education
Factors Affecting the Implementation of Good Corporate Governance
in Control of Operation and Finance
Hadi Sugiyanto1 & Aminullah Assagaf2
1
Faculty of Administration, Universitas DR. Soetomo Surabaya, Indonesia
2
Faculty of Economics and Business, Universitas DR. Soetomo Surabaya, Indonesia
Correspondence: Priyono, Graduate Program Master of Management, University Bina Darma, Palembang, Indonesia. Tel: 0812-1697-4878. E-mail: [email protected]
Received: October 7, 2017 Accepted: October 31, 2017 Online Published: December 5, 2017 doi:10.5539/ijef.v10n1p32 URL: https://doi.org/10.5539/ijef.v10n1p32
Abstract
This study aims to examine the effect of independent variables of inflation rate (X1Inf), install capacity consumer consumptive (X2ICKs), and install capacity productive consumer groups (X3ICPr) to the dependent variable of GCG implementation in controlling efficiency of operating and financial (YGCGEf), to prove the hypothesis, this research used linear regression model and its calculation using SPSS software. The result of this study found that the inflation rate variable (X1Inf) has a positive effect and does not affect the dependent variable of GCG implementation in controlling the operation and financial efficiency (YGCGEf). While the variable Instal capacity consumer consumptive group (X2ICKs) and install capacity consumer productive group (X3ICPr) significant effect on the dependent variable GCG implementation in control of operating and financial efficiency (YGCGEf). The X2ICKs variable has a negative effect and X3ICPr has a positive effect on the dependent variable of GCG implementation in controlling the efficiency of operation and financial (YGCGEf). This research recommends that management policy of PT. PLN (Persero) prioritize variable X2ICKs and X3ICPr, because both of these variables are significant so that significant effect on the dependent variable of GCG implementation in controlling the efficiency of operating and financial (YGCGEf).
Keywords: Good Corporate Governance (GCG), financial accounting, accounting management
1. Introduction
Since the issuance of the decision of the Ministry of State Owned Enterprises (SOE) number SK-16 / S.MBU / 2012 dated June 6, 2012 on Good Corporate Governance (GCG), the management of State Electricity Company Ltd. (Persero) or PT. PLN (Persero) started to perform specific attention to indicators or parameters of the application of GCG.
The GCG assessment or evaluation is focused on the criteria and factors tested for compliance with its application covering 6 aspects of testing, 43 indicators, 154 parameters consisting of (a) commitment to the implementation of good corporate governance in a sustainable manner, consist of 6 indicators, 15 parameters and 7 integrities, (b) shareholders and GMS or owners, there are 6 indicators, 25 parameters and weight 9, (c) board of commissioners or supervisory board there are 12 indicators, 44 indicators and weight 35, (d) directors, there are 13 indicators, 52 parameters and weight 35, (e) information disclosure and transparency, there are 4 indicators, 16 parameters and weight 9, and (f) others, there are 2 indicators, 2 parameters and weight 5. The quality of GCG implementation in SOE environments such as PLN will be given excellent classification
when it reaches scores or scores above 85, good classification (75 <value ≤ 85), good enough (60 <value ≤ 75),
good rate (50 <value ≤60), and not good (value ≤ 50).
The management of PLN in the implementation of GCG is assessed, among others, the ability to implement operational and financial control policies on the implementation of the company's plans and policies. This will be reflected in the main indicator of achievement is the amount of success to achieve the cost efficiency of basic electricity perunit or KWh from time to time. As a reflection of the operation and financial control of PLN, it will be represented by an indicator of the cost of providing KWh each unit which is produced or sold to consumers.
The cost of electricity supply per KWh is formed by a large group of related activities that must be controlled operationally and financially from management's decision to invest in the construction of power plants as stated by the government above, the construction of networks and supporting supporting facilities needed, the selection of types of plants due to the cost of materials fuel that will be used in the long term until the economic life of the plant, for example PLTU for 30 years. Other costs of focus that must be studied are maintenance costs, personnel costs, depreciation costs and administrative costs as well as bank interest to be paid to finance investment funding. In this efficiency pursuit is used variable fuel costs, engine rental and purchase of electricity from private power companies, on the grounds that other costs have become given or in existing conditions are no longer controlled significantly by management if it wants to improve efficiency in the management of corporate financial operations.
In addition, the composition of electric power consumption by the customers greatly affects the cost efficiency of the main provision is mainly related to the fluctuations in the electricity consumption of the customers concerned.
Broadly speaking there are two groups of customers by type of usage is the consumer sector and productive sectors. Consumer sectors consist of household customers, social customers, building customers or government offices, street lighting and temporary lighting. While the productive or commercial sector consists of industrial and business customers. Industries are classified as type of use for the purposes of production processes such as raw material processing factories, semi-finished goods and finished goods. While business customers are used for distribution business, shops, restaurants, hotels, trade and others.
There are differences in the characteristics of the use of electricity, especially when associated with installed capacity or VA installed in the location of consumers, which on the power capacity likely to consume electricity to optimally match the limits of its power VA.
For consumer sector customers tend to stabilize their electricity consumption from time to time, while productive sector consumers tend to fluctuate in accordance with the magnitude of fluctuations in production or demand faced by the customer concerned.
This is what distinguishes power consumption patterns of both sectors, so it is important for management to know the magnitude of both indicators of the use of both sectors, especially to prepare a projection of cost efficiency targets that can be achieved by the company.
In addition, the inflation factor also influences the achievement of cost efficiency of basic electricity supply, because this inflation rate is a reflection of the ups and downs of operational costs incurred by PLN, both investment and operating costs.
Investment costs are primarily for the construction of power stations, the construction of transmission and distribution networks, the provision of other supporting facilities, and the overhead large-scale maintenance costs of power generation installations. While inflation-induced operating costs are fuel costs, routine maintenance costs, purchasing power from the private sector, machine rentals, personnel costs, administrative costs, and depreciation costs. Other costs other than operating costs that are affected by inflation are borrowing costs and foreign exchange differences, but these two costs are not calculated as an assessed operating cost even if reported in the profit and loss statements.
1.1 Significance of Research
In the relationship between the interests of shareholders or the ministry of SOEs as the principal and the interests of the management of the company or PLN as an agent, the research becomes significant to examine the important factors affecting the efficiency of operational and financial PLN.
ijef.ccsenet.org International Journal of Economics and Finance Vol. 10, No. 1; 2018
In terms of principal, shareholders should be concerned to the agent or management to take steps to control the efficiency of operations and corporate finance.
Furthermore, as an agent, management needs to understand the factors that must be controlled so that the achievement of GCG values from the operating efficiency and financial components can be optimized.
Based on the relationship between the pricipal and the agent, this research becomes significant and important not only for PLN in corporation but also to help ease the burden of the state budget subsidy, so it has the opportunity to divert the fund for other sectors need especially the infrastructure development that encourages the absorption of manpower, resources, and other social interests such as health, education, and others.
1.2 Research Problems
Based on the background mentioned above, the scope of the study is concerning aspects of operations and financial control by the management that is focused on cost efficiency of electricity supply and the factors that influence.
Operational and financial efficiency impacts involves all aspects of the company's routine activities and greatly determines the achievement of corporate GCG values set by the shareholders in this case the ministry of SOEs.
Based on this view, the main problems in the research can be formulated in the form of questions that need to be answered in this research that is:
a. How is the influence of inflation factor on the implementation of Good Governance (GCG) in the operation and financial control of PT PLN (Persero)?
b. How is the influence of installed capacity factor of consumer sector consumptive to the implementation of Good Corporate Governance (GCG) in the operation and financial control of PT PLN (Persero)?
c. How is the influence of installed capacity factor of consumer sector productive to the implementation of Good Corporate Governance (GCG) in the operation and financial control of PT PLN (Persero)?
1.3 Research Objectives
The main purpose of this research is to answer the main problems faced by the company in the implementation of corporate governance (GCG) in the operation and financial control, ie:
a. Studying and analyzing the influence of inflation factors on the implementation of Good Corporate Governance in the operation and financial control of PT PLN (Persero).
b. To study and analyze the effect of install capacity factor to the consumer sector customers on the implementation of Good Corporate Governance (GG) in the operation and financial control of PT PLN (Persero).
c. To study and analyze the effect of install capacity factor to the productive sector customers on the implementation of Good Corporate Governance (GCG) in the operation and finance control of PT PLN (Persero)?
1.4 Contribution of Research
The results of this study are expected to contribute as follows:
a. Enriching the literature and study results related to the implementation of Good Corporate Governance (GCG) in operational and financial control of PT PLN (Persero).
b. Providing input to the management of PT PLN (Persero) in the implementation of Corporate Governance (GCG) for operational and financial control of PT PLN (Persero).
c. Provides information for practitioners interested in the application of Good Corporate Governance (GCG) for operational and financial control within the PT PLN (Persero).
d. Be a reference for researchers who will examine the implementation of Good Corporate Governance (GCG) for operational and financial control of both the PT PLN (Persero) as well as other companies that are relevant to this study.
2. Literature Review and Hypotheses Development
2.1 Literature Review
2.1.1 Agency Theory
owners and management. Agency theory bases contractual relationships between shareholders/owners and management/managers. According to this theory the relationship between owner and manager is intrinsically difficult to create due to conflicting interests.
In agency theory, agency relations arise when one or more people (the principal) employ other people (the agent) to provide a service and then delegate decision-making authority to the agent.
The relationship between principal and agent can lead to the condition of information imbalance (asymmetrical information) because the agent is in a position that has more information about the company than the principal.
Assuming that individuals act to maximize self-interest, then with its asymmetry information it will encourage agents to hide some information that the principal does not know. Under such asymmetric conditions, the agent may affect the accounting figures presented in the financial statements by means of earnings management. One way to monitor contract issues and limit opportunistic management behavior is corporate governance. The main principles of corporate governance that need to be considered for the implementation of good corporate governance practices are; transparency, accountability, fairness, and responsibility. Corporate governance is directed at reducing information asymmetry between principals and agents, which in turn is expected to minimize profit management action.
According to Jensen and Meckling (1976) in Randhy Ichsan (2013) suggests “agency relationship as a contract under which one or more person (the principals) engage another person (the agent) to perform some service on their behalf which involves delegating some decision making authority to the agent”.
According to agency theory, conflicts between principals and agents can be reduced by aligning interests between principals and agents. According Bathala (1994) in Randhy Ichsan (2013), there are several ways in which to reduce conflicts of interest, namely a) increase ownership by management (insider ownership), b) increase the ratio of dividends to net income (earnings after tax), c ) increase the sources of funding through debt, d) ownership by institutions (institutional holdings).
Wan Fauziah Wan Yusof and Idris Adamu Al Haji (2012. P.53-55) in his study argued that much of the research into corporate governance derives from agency theory.
2.1.2 Good Corporate Governance
In the Ministry of State-Owned Enterprises or State-Owned Enterprises, there has been a good corporate governance or GCG assessment consisting of 43 indicators of capture covering 154 parameters such as SK-16/S.MBU/2012 dated June 6, 2012 attached. Assessment of SOEs is done every year with the criteria of assessment, that is:
- Value above 85: Very Good
- 75 < Value ≤ 86: Good
- 60 < Value ≤ 75: Good Enough
- 50 < Value ≤ 60: Not Good
- Nilai ≤ 50: Bad
Furthermore, the Encyclopedia in Wajam (2004), suggests Principles of Corporate Governance describe the responsibilities of the board.
2.1.3 Cost Theory
According to Warren, Reeve, Duchac, 2014, P. 964-969, cost behavior is the manner in which a cost changes as a related activity changes. The behavior of costs is useful to managers for a variety of reasonss. For example, knowing how costs behave allows manager to predict profit as sales and production volumes change.
2.2 Development of Hypothesis
Based on the literature review as above, the hypothesis proposed in this study is as stated below.
The influence of inflation factor on the implementation of Good Corporate Governance (GCG) in the operation and financial control of PT PLN (Persero)
Inflation is an annual percentage increase in the general price level measured by consumer prices or other indices, whereas deflation occurs because if prices and costs are generally down (Samuelson & Nordhaus in Adi Juardi, 2008).
ijef.ccsenet.org International Journal of Economics and Finance Vol. 10, No. 1; 2018
increase in price due to greater consumer preference for reduced goods, (c) any increase in government debt which may affect prices, (d) Any increase in the effective amount of money that exceeds the need for money, (e) the circumstances in which the public loses confidence in goods or assets deemed to have a steady value (Winardi, 1995; Adi Juardi, 2008). In PLN's operations, inflation will encourage the increasing cost of basic electricity supply especially to variable cost such as fuel, engine rental cost and purchasing power from private power company or Independent Purchasing Power (IPP). In connection with Cost theory as described above shows that in the short term variable costs will increase, while fixed costs have an effect on capacity development or long-term investment.
Based on the description above, the hypothesis proposed in this study are as the following hypothesis H1. H1: Inflation factor significantly influences the implementation of Good Corporate Governance (GCG) in the operation and financial control of PT PLN (Persero).
Effect of consumer consumptive install capacity on the implementation of Good Corporate Governance (GCG) in the operation and financial control of PT PLN (Persero).
Install Consumer Consumptive consumer capacity has a relatively small economical scale and relatively stable consumption or does not fluctuate in significant amounts for a certain period of time. Consumer location of this sector is relatively spread to wide operational area, so that impact on investment cost, network, maintenance cost and others. As the decision of Ministry of SOEs numbers SK-16/S.MBU/2012 dated June 6, 2012, then in terms of connecting the electricity service consumer sector has been asserted that the Board of Directors PLN carry out the work program corresponding action plan of the company or CBP and take the necessary decisions through analysis that is adequate and timely.
Based on the above description, the hypothesis proposed in this study is as hypothesis H2 below.
H2: The factor of install capacity consumer consumptive group has a significant effect on the implementation of Good Corporate Governance (GCG) in the operation and financial control of PT PLN (Persero).
Effect of install capacity of productive group to the implementation of Good Corporate Governance (GCG) in controlling operation and finance of PT PLN (Persero).
Install Capacity of the productive sector as the power limit owned by industrial and business consumers to use electric power according to their needs. KWh consumption of this sector fluctuates according to the development of demand faced by this sector. Unlike the consumer sector are likely to be stable in the short term. KWh consumption depends on the amount of install capacity and hours of power utilization, so the consumption of KWh can be calculated with the following formula.
KWh = (Install Capacity (VA) x hours of power utilization)/1000
Thus, the Install capacity of consumers of this sector will be more effective use and provide opportunities for consumers to use electricity flow in a more fluctuating amount. From the aspect of investment cost and operational cost used by PLN to serve this sector is relatively lower to the installed power, because the required power is bigger and the location is more concentrated or only concentrated in certain PLN operational areas such as trading area, urban area and industrial area.
Based on the above description, then the hypothesis proposed in this study is as hypothesis H3 below.
H3: The factor of install capacity of productive group consumers significantly influences the implementation of Good Corporate Governance (GCG) in the operation and financial control of PT PLN (Persero).
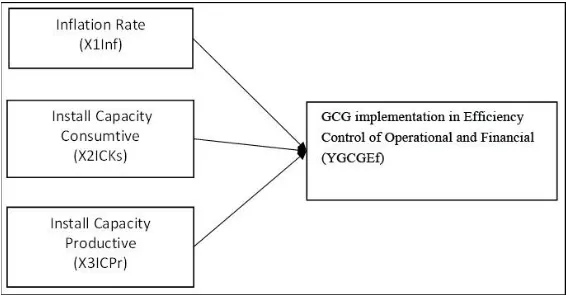
3. Conceptual Framework
Based on the problems presented above, then to perform the analysis and test the hypothesis used a conceptual framework as illustrated below. The dependent variable (YGCGEf) that will be studied in this research is GCG implementation in controlling the operation and financial efficiency of PT PLN (Persero), that is how the company's management policy in applying GCG principle as a strategic step to improve control of operating and financial efficiency in order to achieve company target. Through the application of GCG principles that is transparency, accountability, responsibility, independency and fearness then the overall intellectual capital owned by the company can be integrated well so that efficiency can be improved in the operational management of companies that provide optimal financial performance results.
principles is required if the policy is to avoid inflation risks, especially operational policies and financing policies using foreign loans and others. If the policy is not based on the GCG principles, the management policy can have a negative impact on the company's performance because the operational and financial controls are less oriented to GCG principles such as the financial statements look healthy but in reality the company still needs a relatively large funding fund from APBN every year both for operational needs as well as investment. If the financial information is presented in accordance with the company's financial reality and transparent to all stakeholders including the general public, the tariff adjustment will be supported and accepted by the customer or society in general. Based on this, the inflation rate (X1Inf) variable is related to the implementation of GCG in the control efficiency of operations and finance (YGCGEf) as illustrated in the following conceptual framework. Independent variable install capacity consumer consumptive groups (X2ICKs) such as household, social, public road lighting, government buildings and temporary lighting as the most subsidized consumer groups, but for companies less openly informed about matters related to structure fees and tariffs paid by this group, so tariff adjustment is difficult because the gap between fees and tariffs charged to this sector is further away. This is where the role of transparency, accountability, responsibility, independence and fairness that should be upheld by the management company, so that the operational continuity and service companies and finance no longer burden the state budget annually. Therefore, this productive productive capacity install variable (X2ICPr) is related to GCG implementation in operating and financial efficiency control (YGCGEf) as illustrated in the following conceptual framework.
Independent variable install capacity productive consumer group (X3ICPr) such as industry and business that should be a support to ease the burden of APBN because this sector operates in favorable condition. The company should apply a relatively economical tariff to the choice of using PLN electricity or using electricity with its own generator. PLN management needs to apply information based on the principles of transparency, accountability, responsibility, independence and fairness, so stakeholders understand appropriately PLN's financial and operational information. If this happens then the tariff adjustment for the commercial sector customers can be accepted and understood by all parties and no resistance occurs. Under this condition, the variable install capacity of productive consumer groups (X3ICPr) is related to the implementation of GCG in operational and financial control (YGCGEf) as illustrated in the following conceptual framework.
Figure 1. Conceptual framework
4. Research Methodology
4.1 Research Data
The data used in this research is the kind of secondary data in the form of annual time series data using historical data for the period 2005 to 2015 or 11 years using secondary data based on annual reports, statistics presented by the company and financial statements that have been audited by Public Accounting Firm or KAP and has been published through the website http://www.pln.co.id.
ijef.ccsenet.org International Journal of Economics and Finance Vol. 10, No. 1; 2018
The data required in this study are investment cost, fuel cost, maintenance cost, machine rental cost, electricity purchase cost, employee cost, administrative cost, production or electricity sales (KWh), install capacity of customer type divided into consumptive group and productive groups.
Consumptive group customers consist of household consumers, social consumers, consumers of government-owned office buildings, streetlights and temporary usage. While productive consumer groups consist of industrial consumers and business consumers. industrial consumers, especially for consumers in the process of producing raw materials, semi-finished goods, and finished goods. While the business group includes consumer groups trade, hospitality services, workshops, crafts, etc.
4.2 Definition and Measurement of Variables
The variables used in this study can be defined and measured by the formulation as described below.
a. Operational efficiency in operations and financial management (YGCGEft), which describes the level of achievement of efficiency in the management of company operations. Measurements are made based on measurement standards conducted in the environment of State-Owned Enterprises which have been established through Decree of the Ministry of State-Owned Enterprises (SOEs) on Good Corporate Governance (GCG), No. SK-16 / S.MBU / 2012, June 6, 2012. This variable measurement is based on variable cost growth from period (t-1) to period (t), then divided by GWh sales growth from period (t-1) to period (t), or by the following formula.
𝑌𝐺𝐶𝐺𝐸𝑓 =𝐺𝑊ℎ 𝑠𝑜𝑙𝑑 𝑜𝑢𝑡 (𝑡) − 𝐺𝑊ℎ 𝑠𝑜𝑙𝑑 𝑜𝑢𝑡 (𝑡 − 1)𝑉𝑎𝑟𝑖𝑎𝑏𝑙𝑒 𝑐𝑜𝑠𝑡 (𝑡) − 𝑉𝑎𝑟𝑖𝑎𝑏𝑙𝑒 𝑐𝑜𝑠𝑡 (𝑡 − 1)
b. Inflation rate (X1Inft)
Inflation is a tendency to rise in the price of goods and services in general that continues on a continuous basis. If inflation increases, the price of goods and services in the country increases. Rising prices of these goods and services causes a decline in the value of the currency. Thus, inflation can also be interpreted as a decline in the value of the currency against the value of goods and services in general. The inflation rate used in this study is the tendency of the development of inflation rate over time reported by Bank Indonesia or the Central Bureau of Statistics from 2005 to 2015. The measurement of the inflation variable or X1Inft is comparing or measuring the change of inlation between period (t) and period (t-1), or by the following formula.
𝑋1𝐼𝑛𝑓 = 𝐼𝑛𝑓𝑙𝑎𝑡𝑖𝑜𝑛 (𝑡) − 𝐼𝑛𝑓𝑙𝑎𝑡𝑖𝑜𝑛 (𝑡 − 1) c. Install capacity consumer consumptive sector (X2ICKst)
Variable Install capacity or mega-volt ampere (MVA) consumer consumption sector (X2ICKst), is describing the amount of power installed or available for consumer consumer sector consisting of household group consumer, consumer social group, consumer group government building, general street lighting and consumer of the temporary connection group. The measurement of this variable is based on the growth of the installed consumer power connection from period (t-1) to period (t), then divided by GWh sales growth from period (t-1) to period (t), or with the following formula.
𝑋2𝐼𝐶𝐾𝑠 =𝑀𝑉𝐴 𝑝𝑜𝑤𝑒𝑟 𝑐𝑜𝑛𝑠𝑢𝑚𝑝𝑡𝑖𝑣𝑒 (𝑡) − 𝑀𝑉𝐴 𝑝𝑜𝑤𝑒𝑟 𝑐𝑜𝑛𝑠𝑢𝑚𝑝𝑡𝑖𝑣𝑒 (𝑡 − 1)𝐺𝑊ℎ 𝑠𝑜𝑙𝑑 𝑜𝑢𝑡 (𝑡) − 𝐺𝑊ℎ 𝑠𝑜𝑙𝑑 𝑜𝑢𝑡 (𝑡 − 1)
d. Install capacity of productive sector consumers (X3ICPrt)
Variable Install capacity or mega volt amperes (MVA) productive sector consumers (X3ICPrt), is describing the amount of installed or available power for productive sector subscribers consisting of industrial group consumers and business group consumers. The measurement of this variable is based on the growth of the installed power supply of productive group consumers from period (t-1) to period (t), then divided by GWh sales growth from period (t-1) to period (t), or by the following formula.
𝑋3𝐼𝐶𝑃𝑟 =𝑀𝑉𝐴 𝑃𝑜𝑤𝑒𝑟 𝑃𝑟𝑜𝑑𝑢𝑐𝑡𝑖𝑣𝑒(𝑡) − 𝑀𝑉𝐴 𝑃𝑜𝑤𝑒𝑟 𝑃𝑟𝑜𝑑𝑢𝑐𝑡𝑖𝑣𝑒 (𝑡 − 1)𝐺𝑊ℎ 𝑠𝑜𝑙𝑑 𝑜𝑢𝑡 (𝑡) – 𝐺𝑊ℎ 𝑠𝑜𝑙𝑑 𝑜𝑢𝑡 (𝑡 − 1)
4.3 Model Analysis
4.3.1 Linear Regression Model
The analysis model used to test the hypothesis in this research is multiple linear regression models as presented below.
Description:
- YGCGEft = Implementation of GCG in controlling operating and financial efficiency as measured by proxy
average variable cost per kWh period t - X1Inft = inflation rate growth in period (t)
- X2ICKst = development of install capacity to consumers of consumer sector in period t - X3ICPrt = development of install capacity on productive sector consumers in period t 4.3.2 Descriptive Statistics
Descriptive statistics are methods related to the collection and presentation of a data cluster so as to provide useful information. Descriptive statistics provide information such as the size of the data center, the size of the data spread, the minimum size, the maximum size, the mean, the standard deviation, and the tendency of a group of data that has been collected in the study. Descriptive statistics are a type of analysis that includes data collection, data presentation, and data summary. This type of analysis is limited to process data and present it, so it can not be used to take a conclusion from what has been studied.
4.3.3 Correlation Analysis
Correlation is a statistical technique used to measure the strength of the relationship of 2 variables and also to be able to know the relationship between the two variables with the results of a quantitative nature. The strength of the relationship between the two variables in question here is whether the relationship is close, weak, or not tight, while the form of the relationship is whether the correlation form linear positive or linear negative. In SPSS there are three simple correlation methods (bivariate correlation) such as Pearson Correlation, Kendall's tau-b, and Spearman Correlation. Pearson Correlation is used for interval or ratio data, whereas Kendall's tau-b, and Spearman Correlation are more suitable for ordinal data. In this research will be used simple correlation analysis with Pearson method or often called Product Moment Pearson. The correlation value (r) ranges from 1 to -1, the value closer to 1 or -1 means the relationship between two variables is stronger, otherwise the value close to 0 means the relationship between the two variables is getting weaker. A positive value indicates a one-way relationship (X rises then Y rises) and a negative value indicates an inverse relationship (X rises then Y falls).
4.3.4 Classic Assumption Test
The classical assumption test used in this research is (a) multicollinearity test, (b) autocorrelation test, and (c) heteroscedasticity test. If there is a violation of this assumption, then the regression model is not valid used in the predictions or estimates in the study.
Multicollinearity, ie the relationship between independent variables in one regression. The assumption used in the OLS (ordinary least square) method or linear regression is that there is no linear relationship between the independent variables. Autocorrelation, ie testing the correlation between variables of the observation interference with other observations. Autocorrelation means the correlation between one observation member and another different time observation. In the assumption of the OLS method or linear regression is the absence of a relationship between the interference variable one with the other interference variables. Heteroscedasticity, ie, in the OLS method or linear regression model assumes that the interference variable (ei) has a mean of zero
or E (ej) = 0, has a constant velocity (homoscedasticity) or Var (ei) = 2 and non-interference variables
connected between one observation with another observation or Cov (ei , ej) = 0 resulting in OLS estimators are
Blue. While Heteroscedasticity shows that the variable of disorder has a variant that is not constant, and this is contrary to the assumption of linear regression.
4.3.5 Hypothesis Testing a. F-Test
The F-test is used to test the coefficient hypothesis (slope) of regression simultaneously. How to test both in regression using Anova or Analysis of Variance Table and after obtained F Count, then the next step is compare with F table with df of k and (n-k-1).
If F count > Ftab (n-k-1) then reject H0 or in other words that there is at least one statistically significant regression
slope. b. T-test
ijef.ccsenet.org International Journal of Economics and Finance Vol. 10, No. 1; 2018
jj
b e s
b t
.
The value of t count will be compared with the value of t table. When it turns out, t count∣t∣> tα/2, then the
value of t is in the rejection region, so the hypothesis is zero (j= 0) rejected at the level of trust (1-) or
hypothesis H1 accepted and H0 rejected. c. Coefficient of determinant (Adjusted R2)
The coefficient of determination or adjusted R2 describes the accuracy of the regression model used. The value is the maximum one, which means getting closer to the value of the greater ability of a regression model to explain the phenomenon studied. Conversely getting closer to zero then the regression model used the smaller the ability to explain changes in the dependent variable caused by changes in independent variables.
5. Results and Discussion
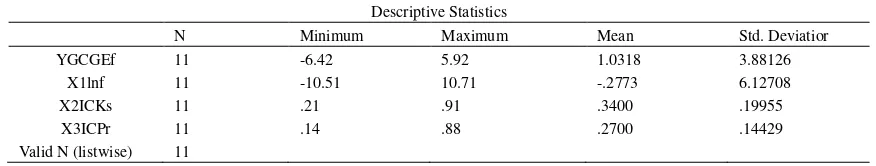
5.1 Descriptive Statistics
Descriptive statistics as the following table shows the composition of statistical data obtained in this study. The dependent variable of GCG implementation in operational and financial control (YGCGEf) shows the variation of data in the minimum range of -6.42 and maximum of 5.92 and the average of 1.0318 which means that the observed value of each sample under study is in the range negative development up to positive but with a positive average of about one unit, although the standard deviation or deviation rate from the average of 3.88126, which means the rate of positive and negative changes of the average number is in the range of numbers such deviation.
The independent variable of inflation rate (X1Inf) shows the variation of data in the minimum range of -10.51 and the maximum of 10.71 and the average of -0.2773 which means that the observed value of each sample under study is in the range of negative development up to positive but with a negative average smaller than one unit, although the standard deviation or deviation rate from the average of 6.12708 which means the rate of positive and negative changes of the average number is in the range of numbers such deviation.
The independent variable install capacity consumer consumptive group (X2ICKs) shows the variation of data in the minimum range of 0.21 and maximum of 0.91 and the average of 0.3400 which means that the observed value of each sample under study is in the range of positive development and the positive rate is less than one unit. While the standard deviation or deviation rate from the average of 0.19955 which means the rate of change of the average number is in the range of numbers such deviation.
The independent variable install capacity productive consumer group (X3ICPr) shows the variation of data at a minimum range of 0.14 and a maximum of 0.66 and an average of 0.2700 which means that the observed value of each sample under study is in the range of positive development and positive average is smaller than one unit. While the standard deviation or deviation rate from the average of 0.14429 which means the rate of positive change of the average number is in the range of numbers such deviation.
Table 1. Standard deviation
Descriptive Statistics
N Minimum Maximum Mean Std. Deviatior
YGCGEf 11 -6.42 5.92 1.0318 3.88126
X1lnf 11 -10.51 10.71 -.2773 6.12708
X2ICKs 11 .21 .91 .3400 .19955
X3ICPr 11 .14 .88 .2700 .14429
Valid N (listwise) 11
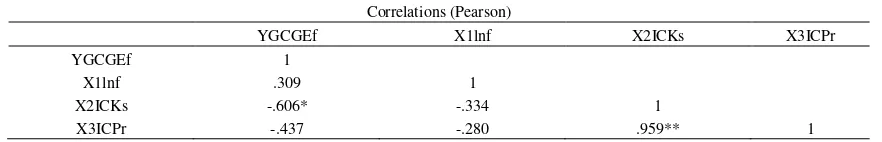
5.2 Correlation Analysis
Correlation analysis is used to determine the degree or strength of the linear relationship between one variable to another variable. It is said a variable has a relationship with other variables if the change of a variable followed by changes in other variables. Changes can occur in the same direction or positive correlation and negative opposite or correlation changes. The correlation coefficient of a variable is stated to have strength or degree of relationship with other variables, and does not distinguish between the independent variable with the dependent variable.
or close to -1, the higher the value of X the lower the value of Y, vice versa if the correlation coefficient of or near 1, the higher the value of X the greater the value of Y. If the percentage change of the variable followed by the change with the same percent then both variables have perfect correlation or 1. Therefore, if a variable is correlated with the variable itself, a correlation coefficient of 1.
In relation to regression analysis, correlation analysis is usually used to describe the level of line accuracy or regression equation. The method used in the following correlation analysis. correlation analysis used to know degree or strength of linear relationship between one variable with other variable, so correlation analysis do not differentiate between free vaiabel with dependent variable. Correlation measurements in the study using product moment correlation (Pearson) with the results as the following Corelations table.
The correlation between the dependent variable YGCGEf and the independent variable X1Inf = 0.309 and X3ICPr = -0.437 which means that these two independent variables have a linear relationship with YGCGEf dependent variable at a degree of less strength or less than 0.50 or respectively 730.9 % and 43.7%. While the correlation between the dependent variable YGCGEf with independent variable X2ICKs = -0.606 which means that this independent variable has a linear relationship with YGCGEf dependent variable at a degree of strength or greater than 0.50 or 60.6%. Furthermore, the correlation between independent variables with each other shows that the X1Inf variable correlates with X2ICKs and X1Inf variable correlation with X3ICPr respectively -0.334 and -0.280 which means having a degree of less strong relation or less than 0.5. While the correlation between X1ICKs variable with X3ICPr of 0.959 shows both of these variables have a strong degree of linkage. This is mainly because both of these variables are growing from time to time, which is in line with the demand of consumptive and productive sectors which are still in the process of fulfilling the demand because PLN service is still limited compared to the number of requests, so the waiting list of connection requests or install capacity is still in the process of long queuing and at the end of the current government period is expected customers or consumers can be met or with electrification ratio close to 100% or the Indonesian people have been enjoying electricity or have fulfilled their request. Indication of multicollinearity statistically occurs in correlations greater than 0.5 but in this study there is no multicollinearity due to reality and theoretically these two variables are unrelated, but occur at the same growth conditions over time.
Table 2. correlation between independent variables
Correlations (Pearson)
YGCGEf X1lnf X2ICKs X3ICPr
YGCGEf 1
X1lnf .309 1
X2ICKs -.606* -.334 1
X3ICPr -.437 -.280 .959** 1
5.3 Classic Assumption Test
5.3.1 Multicollinearity
Multicollinearity, is the occurrence of a high linear correlation or near perfect between independent variables. The consequences or consequences of multicollinearity, ie the least squares estimator can not be determined (indeterminate). To detect the presence of multicollinearity in regression model, this research use multicollinearity test with Tolerance (TOL) and Variance Inflation Factor (VIF). If the value of TOL> 0.2 or greater is 0.2 and VIF <10 or not more than 10 then otherwise there is no symptoms of multicolinearity.
ijef.ccsenet.org International Journal of Economics and Finance Vol. 10, No. 1; 2018
Table 3. consequences of multicollinearity
Coefficientsa
Model Unstandardized Coefficients Standardized Coefficients t Sig. Collinearity Statistics
B Std. Error Beta Tolerance VIF
1 (Constant) 3.319 1.939 1.712 .131
X1lnf .025 .157 .040 .162 .876 .869 1.151
X2ICKs -44.813 16.330 -2.304 -2.744 .029 .075 13.286
X3ICPr 47.984 22.178 1.784 2.164 .067 .078 12.813
a. Dependent Variable: YGCGEf.
5.3.2 Autocorrelation
Autocorrelation, is a condition in which the correlation of residuals for observations of one with other observations arranged in order of time. The autocorrelation test is intended to determine whether there is a correlation between the members of a series of time-series and cross-sectional observational data. The consequence when there is an autocorrelation problem, that is, the t-statistic value and the F-statistic value can not be trusted, because it will be misleading. In this study using Durbin Watson (Durbin Watson Test). This autocorrelation test was introduced by J. Durbin and GS Watson in 1951 as in Gujarati (1995). The formula used for the Durbin-Watson test:
DW = (∑e – et-1)2/ ∑ei2
Comparing the DW formula with the DW table, in conclusion, that is (a) there is a positive autocorrelation: DW <dL, (b) without conclusion or uncertainty; DW is between dL to dU, (c) no autocorrelation; DW is between dU to 4-dU, (d) without conclusion or uncertainty; DW is between 4-dU to 4-dL, (e) there is a negative autocorrelation DW> 4-dL.
SPSS output as table Model Summary below shows that DW count = 2.728 as the table of the following
Summary Model. While DW table obtained with n = 11 and k = 3 with α = 0,05 or 5% error tolerance that is;
value dL = 0,5948 and dU = 1.,9280, so it is stated that regression model used in this research can not confirmed as autocorrelation, since DW count (2,728) is in position between 4-dU (2,072) and 4-dL (3,4052).
Table 4. This autocorrelation test
Model Summaryb
Model R R Square Adjusted R Square Std. Error of the Estimate Durbin-Watson
1 .793a .629 .469 2.82706 2.728
a. Predictors: (Constant), X3ICPr, X1lnf, X2ICKs. b. Dependent Variable: YGCGEf.
5.3.3 Heteroscedasticity
Heteroscedasticity, is a state where variant inequalities occur from the residuals in the regression model. Heteroscedasticity means that there are variant variables in the regression model that are not equal or constant. In contrast, Homocedasticity means that variant variables in the regression model have the same or constant value. The problem of heteroscedasticity often occurs in cross-saction data. The heteroscedasticity consequence is the hypothesis test based on t test and F distribution is not reliable. To test heteroscedasticity, this research used Glejser method. This method regresses all the independent variables against its absolute residual value. If there is a significant independent variable influence to the absolute value of residual, then in the regression model there is a problem of heteroscedasticity. The equations used to test the heteroscedasticity of the Glejser method are:
│µi│ = α + βXi+ έi
Description:
│µi│= absolute residual value and Xi = independent variable
The reference is that if the probability value (sig) > 5% alpha value, then certainly does not occur Heteroscedasticity.
there was no heteroscedasticity in the regression equation. Level Sig. each independent variable is greater than 0.10 or not significant, ie X1Inf = 0.385 or 38.5%, X2ICKs = 0.159 or 15.9% and X3ICPr = 0.203 or 20.3%.
Table 5. heteroscedasticity in the regression equation
Coefficientsa
Model Unstandardized Coefficients Standardized Coefficients t Sig.
B Std. Error Beta
1 (Constant) 1.955 .984 1.986 .087
X1lnf -.074 .079 -.317 -.927 .385
X2ICKs -13.074 8.291 -1.831 -1.577 .159
X3ICPr 15.814 11.261 1.602 1.404 .203
a. Dependent Variable: ABRESID.
5.4 Hypothesis Testing
The coefficient determinant(Adjusted R2)
The coefficient determinant or adjusted R2 = 0,469 shows that the regression is able to explain the phenomena studied about 46.9% which means the research model is able to explain the change of YGCGEf dependent variable by 46.9% caused by the change of independent variables X1Inf, X2ICKs and X3ICPr, while 53.1% (100% -46.9%) is explained by other factors beyond the research.
Table 6. coefficient determinant
Model Summary
Model R R Square Adjusted R Square Std. Error of the Estimate
1 .793a .629 .469 2.82706
a. Predictors: (Constant), X3ICPr, X1lnf, X2ICKs.
Statistic-F Test
Analysis of variance or ANOVA as the following table describes Statistic-F = 3.950 and Sig levels = 0.061 or 6.1%, which means that the independent variables X1Inf, X2ICKs and X3ICPr simultaneously have a significant effect on the YGCGEf dependent variable on the degree of error <0.10 or less than 10%.
Table 7. Analysis of variance or ANOVA
ANOVAa
Model Sum of Squares df Mean Square F Sig.
1 Regression 94.696 3 31.565 3.950 .061b
Residual 55.946 7 7.992
Total 150.642 10
a. Dependent Variable: YGCGEf.
b. Predictors: (Constant), X3ICPr, X1lnf, X2ICKs.
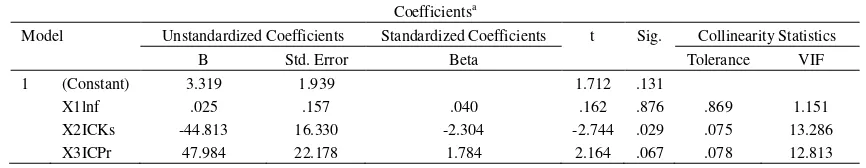
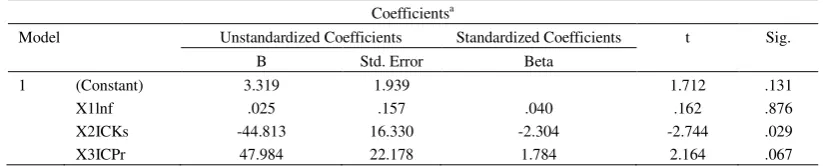
Coefficients and Statistic-t Test
Based on the analysis model used in this study and in accordance with the results of data processing research, then obtained the regression results as in the following table coefficients.
Table 8. the regression results
Coefficientsa
Model Unstandardized Coefficients Standardized Coefficients t Sig.
B Std. Error Beta
1 (Constant) 3.319 1.939 1.712 .131
X1lnf .025 .157 .040 .162 .876
X2ICKs -44.813 16.330 -2.304 -2.744 .029
X3ICPr 47.984 22.178 1.784 2.164 .067
ijef.ccsenet.org International Journal of Economics and Finance Vol. 10, No. 1; 2018
The regression coefficients obtained and proved the proposed hypothesis, ie.: (a) H1 hypothesis does not occur in accordance with the hypothesis proposed because the variable X1Inf have no significant effect on the dependent variable YGCGEf with statistic-t = 0.162 and Sig. 0.876 or 87.6%. (b) The H2 hypothesis corresponds to the proposed hypothesis because the X2ICKs variable significantly influences the dependent variable YGCGEf with statistic-t = -2.744 and Sig. 0.029 or 2.9%. (c) H3 hypothesis corresponds to the proposed hypothesis because the X3ICPr variable has a significant effect on the dependent variable YGCGEf with statistic-t = -2.164 and Sig. 0.067 or 6.7%.
The result of the calculation as the coefficients table can be written in the form of the regression equation as follows:
YGCGEf = 3,319 + 0,025 X1Inf-44,813 X2ICKs + 47,984 X3ICPr
The independent variable X1Inf with 0,025 coefficient means that this variable has positive effect on the dependent variable YGCGEf, which means that each additional variable X1Inf of one unit, then the dependent variable YGCGEf will increase by 0,025 units. While the value of statistic-t = 0.162 and Sig = 0.876 or 87.6% means that the X1Inf variable has an insignificant effect on the YGCGEf dependent variable with an error tolerance greater than 10%.
The independent variable X2ICKs with the coefficient of -44.813 means that this variable has a negative effect on the dependent variable YGCGEf, which means that each X2ICKs variable adds a unit, then the dependent variable YGCGEf will decrease by 44.813 units. While the value of statistic-t = -2.744 and Sig = 0.029 or 2.9% means that the X2ICKs variable has a significant influence on YGCGEf dependent variable with error tolorensi less than 5%.
The independent variable X3ICPr with coefficient of 47,984 means that this variable has positive effect on the dependent variable YGCGEf, which means that each addition of X3ICPr variable is one unit, then the dependent variable YGCGEf will increase by 47.984 units. While the value of statistic-t = 2.164 and Sig. = 0.067 or 6.7% means that the X3ICPr variable has a significant influence on YGCGEf dependent variable with error tolerance of less than 10%.
6. Conclusion and Recommendation
6.1 Conclusion
Based on the analysis and discussion, the results of this study can be summarized as follows:
a. The independent variable X1Inf has positive and insignificant effect on the dependent variable YGCGEf with regression coefficient of 0.025 which means that each increase of this variable for one unit will increase YGCGEf dependent variable by 0,025 units. The results of the analysis are not supportive or not in accordance with the proposed hypothesis that independent variable X1Inf significant effect on the independent variable YGCGEf. This means that PT PLN (Persero) does not need to pay attention to X1Inf variable seriously or priority scale, because this variable did not have a significant effect on GCG implementation in controlling operation and financial efficiency or YGCGEf.
b. The independent variable of X2ICKs has a negative and significant effect on the dependent variable YGCGEf with regression coefficient of -44.813 which means that each increase of this variable for one unit will cause the reduction of YGCGEf dependent variable of 44.813 units. The results of the analysis support or in accordance with the proposed hypothesis that independent variables X2ICKs significant effect on independent variables YGCGEf. This means that PT PLN (Persero) needs to pay attention to variable X2ICKs with priority scale, because this variable has a significant effect on GCG implementation in controlling of efficiency to operation and financial or YGCGEf.
c. The independent variable X3ICPrs has a positive and significant effect on the YGCGEf depended variable with regression coefficient of 47.984 which means that each increase of this variable for one unit will cause the dependent variable YGCGEf variable is 47,984 units. The results of the analysis support or in accordance with the proposed hypothesis that independent variables X3ICPr significant effect on independent variables YGCGEf. This means that PT PLN (Persero) needs to pay attention to variable X2ICKs with priority scale, because this varaiabel has a significant effect on the implementation of GCG in operating and financial efficiency control or YGCGEf.
6.2 Recommendation
Based on the above conclusions, the research is recommended as follows:
management policy of PT PLN (Persero) does not need to prioritize the handling of X1Inf variable since this variable does not significantly affect the implementation of GCG in the operation and financial efficiency control or YGCGEf.
b. The independent variables of X2ICKs have a negative and significant effect on YGCGEf, it is suggested that PT PLN (Persero) management policy prioritizes the handling of X2ICKs variable because this variable has a significant effect on the implementation of GCG in controlling the operation and financial efficiency or YGCGEf.
c. The independent variables of X3ICKs have positive and significant effect on YGCGEf, it is suggested that PT PLN (Persero) management policy will prioritize handling X3ICPr variable since this variable has significant effect on the implementation of GCG in the operation and financial efficiency control or YGCGEf.
References
Anonymous. (2012). Decision of the Ministry of State Owned Enterprises (SOEs) About: Good Corporate Governance (GCG). Number SK-16 / S.MBU / 2012. June 6, 2012.
Ardi, J. (2008). Influence of Operating Cash Flow, Inflation, Interest Rates and Changes in Foreign Exchange Rates Against Stock Return with Profit Persistence As Moderating Variables. University of Indonesia, Jakarta.
Carls, S. W., Jems, M. R., & Jonathan, E. D. (2014). Accounting. South-Western Cengage Learning (pp. 964-967). United States, United Kingdom, Singapore.
Damodar, N. G., & Dawn, C. P. (2010). Basic Econometrics. Mc Graw Hill, Dasar- Dasar Ekonometrika, Penerbit Salemba Empat, Jakarta.
Moch, D. A. (2002). Econometrics - Essence and application using Eviews. Jakarta: Publisher Erlangga.
Pauline, W. (1999). Financial and Management Accounting – An Introduction (2nd ed., pp. 606-632). Prentice Hall, New York.
Setiawan, D. E. K. (2010). Econometrics. Publisher Andy, Yogyakarta.
Wan, F., Wan, Y., & Idris, A. A. (2012). Insight of Corporate Governance Theories. Journal of Business and Management, 1(1), 53-55. Published by Science and Education Center of North America.
Copyrights
Copyright for this article is retained by the author(s), with first publication rights granted to the journal.