Jejak Vol 10 (2) (2017): 412-428. DOI: http://dx.doi.org/10.15294/jejak.v10i2.11305
JEJAK
Journal of Economics and Policy
http://journal.unnes.ac.id/nju/index.php/jejak
Impacts of Government and Household Expenditure
on Human Development Index
Niken Sulistyowati1, Bonar Marulitua Sinaga2, Novindra3
1Economics and Business Faculty, Magister Management Programme, Post Graduate Programme,
Mercu Buana University, Jakarta
2Economics and Management Faculty, Bogor Agricultural University 3 Economics and Management Faculty, Bogor Agricultural University
Permalink/DOI: http://dx.doi.org/10.15294/jejak.v10i2.11305
Received: February 2017; Accepted: May 2017; Published: September 2017
Abstract
The objective of this reseach are to: (1) analyze the factors affecting human development index and household expenditures for health, education and others, (2) predict the impacts of government expenditure policy in the field of education, health, and infrastructure on human development index in Central Java. The model was built using econometric approach in the form of a system of simultaneous equations, including five blocks i.e. government's revenue, expenditures, input, output, and performance. The system of simultaneous equations consisted of 26 equations (19 structural equations and 7 identity equations). The estimation method used Two Stage Least Squares with SYSLIN procedure. Prediction simulation used the stepwise Autoregressive method. The model simulation used Newton's method and SIMNLIN procedure. The results of policy simulation concludes that the combination of the increase in government expenditure for education and infrastructure lead to better performance in increasing income per capita, disposable income and HDI compared to the combination of the policy of the increase in government expenditure for education and in both municipalities and district, but municipalities receive greatest impact compared to the district.
Key words : government expenditure on education, government expenditure on health, government expenditure on infrastructure, household expenditures, human development index.
How to Cite: Holik, Sulistyowati, N., Sinaga, B., & Novindra, N. (2017). Impacts of Government and Household Expenditure on Human Development Index. JEJAK: Jurnal Ekonomi Dan Kebijakan, 10(2), 412-428. doi:http://dx.doi.org/10.15294/jejak.v10i2.11305
© 2017 Semarang State University. All rights reserved Corresponding author :
Address: Jalan Meruya Selatan No.1, RT.5/RW.1, Joglo, Kembangan, Kota Jakarta Barat, Daerah Khusus Ibukota Jakarta 11650
E-mail: [email protected]
INTRODUCTION
The 21st century is marked by the improvement of human resources quality. Challenging development in 21st century according to the Human Development Report is concerning aspects of social justice and greater access to the better quality of human life (United Nations Development Program, 2016). Basically, quality of life boils down to the recognition of human dignity. Human being is one of factors of production
determining nation welfare. Natural
resources will be worthless if there is no human being who is able to manage it. Effective human resource is a prerequisite for attaining economic growth and welfare.
The basic idea of development is to increase the welfare of human life but not only economic welfare where human being lives in. Howeer, the deveoplment should pay more attention to the increase in human life quality. According to (Sen, 2001), economic growth is not ultimate goal of the development. Sen analysis is often called as Human Development Index (HDI). HDI is of indicators describing Human Resources potential. HDI is one of measuring instrument that is able to reflect the status of human development. Nowadays, HDI is greatly used as one of instrument to measure the success of regional development. HDI is composite index covering three areas of
human development considered as
fundamental basis, whcih are age of life
(health), knowledge (education), and
standard of proper life. Health is measured by life expectancy; education is measured by the literacy rate and the average of how long people get the education at school, as well as standard of living measured by per capita expenditure (Central Bureau of Statistics,
2017). Education and health is the
fundamental goal of development. Health is
the core of welfare, while education is the key to achieve proper and precious life. Both factors are fundamental to shape human capability, in which this is the core of development significance. (Todaro and Smith, 2006). It is essential to have educated and trained labor
force for sustainable economic growth.
Everything may only be achieved by the presence of good health and education. When children are given proper nutrition, hence their health will automatically improve. A healthy childeren may improve his performance in school. It is characterized by the decrease number of their absence at school, decrease number of drop out rate, increase in children's learning abilities, and increase in children's school performance. A
good education will affect workforce
productivity; it does not only improve knowledge on entrepreneurship, but also on the importance of familiy planning and the impact on the decline of birthrate. All of them would provide benefit for the development process and produce the productive and qualified generation. (Hess and Ross, 1997).
2015). Human development approach is relevant to government objectives, which is to embody public welfare. The core of human development is measured by its impact on the individual lfe. Principally, human being needs better access to obtain knowledge, health, livelihood, security, recreation, political freedom as well as participation in community activities. This opinion is in line with the Mahbub ul Haq, founder of the human development report, stating that the fundamental purpose of development is to enlarge people's choices (United Nations Development Program, 2016). The aims of the development are to achieve a complete human development and a complete society development. In his research, (Myers, 1963) came to a conclusion that a high correlation between composite human development index and GDP per capita is equal to 0.89. Moreover, (Nanga, 2006), stated that HDI is positively affected by the GDP, population density, the ratio of teachers on students and the percentage of households that have access to clean water.
Human being is acted simultaniously as a subject and an object of development. This implies that people are involved in the development process, they are not just a tool but they are also as the ultimate goal of
development. The (United Nations
Development Program, 2016) (UNDP) under the 2016 Human Development Report notes that Indonesia's Human Development Index (HDI) in 2015 is ranked 113, down from 110 of 188 countries in 2014. This HDI increased by about 30.5 percent in the last 25 years.
The number of poor people in Indonesia is around 140 million people, living on less than Rp20 thousand per day and 19.4 million people suffering from malnutrition. Health and mortality rates, as many as two million
children under the age of one year have not
received complete immunization. Then,
maternal mortality as many as 305 deaths per 100 thousand live births. Access to basic services indicates that nearly five million children are not in school and children in Papua have high levels of school expenditure. In the furture, this situation is a challenge for Indonesia to face global competition as a basis for the development of a knowledge-based economy.
Human development gap (HDI) between districts and municipalities in Central Java was evenly on the upper middle class, ranging from 63.98 to 81.19 points. The highest HDI was in the city of Semarang, while the lowest was in Brebes district. Most of the highest HDI in Central Java was still in region compared to the district. (Central Bureau of Statistics, 2017).
The improvement of human resources quality is one of effective ways in reducing inequality of income distribution and poverty in Indonesia. Health investment can reduce poverty by a greater percentage if it is compared to education investment (Nanga, 2006). Furthermore, in relation to income distribution, (Albanesi, 2007) in his study stated that there was a positive relationship between the inequality of income distribution on a cross-country data and inflation. According to (Sulistyowati, 2013), a decrease in inequality of income distribution provided positive effect in reducing the number of poor people, where every 10% reduction in the Gini index caused poverty to decrease by 4.2%.
which concluded that Indonesia's economic growth is strongly affected by the investment and workforce. The problem of poverty cannot be solved by simply only increasing economic growth and expecting trickle down effect. (Siregar and Wahyuniarti, 2007), used the econometric analysis on the impact of economic growth on poverty and he also used panel data, aggregation of a series of data from 1995-2005 and cross section in 26 provinces in Indonesia, then he concluded
that: (1) economic growth provided
significance effect in reducing poverty, but the magnitude of the effect is relatively not large, (2) inflation and population also provded significance effect to poverty, but the magnitude of the effect is relatively small, (3) increase in share in agriculture sector and share in industrial sector also significantly reduced poverty, (4) education was significant variable and proivide the most significant effect in reducing poverty.
Government expenditure and economic growth had a positive correlation. The Increase in government expenditure would lead to the increase in economic growth (Gould, 1983). This was similar to (Ram, 1986), who examined the relationship between
economic growth and government
expenditure. The result also showed a positive
correlation between the increase in
government expenditure and economic growth. However, it was contrary to (Saunders, 1985) and (Smith, 1985) who showed a negative correlation between
government expediture and economic
growth, where the higher government expenditure, the lower the rate of economic growth of a country. Likewise (Landau, 1986), he found a negative and significant effect
between government expenditure and
economic growth. While, the effect of education expenditure is positive, although it
is not significant. This was confirmed by the results of research conducted by (Sulistyowati et al., 2010), she concluded that in the regional scale, education expenditure, which was 20 percent from regional expenditure could increase the GDP in Central Java at 9,45 percent. Input of workforce and capital are important determinants for economic growth of a region. Capital accumulation shall occur when a half of income is saved and invested to increase the output and income in the future. It is necessary to do Investment to improve the physical capital and increase the output area. On the other hand, the investment also needs to be supported by supporting facilities, which is often referred to infrastructure. Without a good infrastructure, then the investment effect will not provide much benefit in increasing output. Research conducted by (Yudhoyono, 2004), concluded that the increase in government expenditure on infrastructure positively affect economic growth and employment. Government expenditure on infrastructure is able to reduce poverty, but relatively, it less effective when compared to its ability to reduce unemployment. The impact of infrastructure expenditure is most widely enjoyed in the non-agricultural sector. This can occur as a result of government policy that is still biased in urban areas compared to rural. This is reinforced by the results of research conducted by (Sulistyowati, 2013) for the case in Central Java, which stated that the increase in infrastructure expenditure by 20 billion rupiah could increase the GDP by 9 percent and reduce poverty by 21 percent.
The increase in government expenditure on education and health provided positive effect in reducing poverty, although it is less effective compared to government expenditure on infrastructure. The increase in government expenditure on education and health can promote economic growth and employment in
(Yudhoyono, 2004). Furthermre, research conducted by (Utami, 2007), (Sumas, 2012) stated that government expenditure on education and health provded positive effect in increasing HDI. By using the general equilibrium economic model, (Sitepu, 2007) concluded that increase in investment of human resources directly impact the increase in workforce productivity ecouraging the increase in real gross regional domestic product indicated by the increase in the capital stock, the trade balance and private consumption.
Achievement of the human
development quality requires participation of government and public (in the form of household expenditures), either addressed directly or indirectly to the IPM-forming component. At the regional scale, increase in education expenditure by the government can improve education (often, length of school period). Increasie in public education is able to improve health (life expectancy), then it can increase labor productivity, employment, the GDP, and reducing unemployment, inequality income and poverty (Sulistyowati et al., 2010). Government policy in improving the quality of human resources is in line with the objective to reduce inequality of income distribution and poverty, yet it is still necessary to assess further the achievement of development of human life quality. In this article, the authors broaden the scope of the
research by including elements of
government and household expenditure linked to the achievement of human development index. Government expenditure is represented by expenditure on education, health and infrastructure, while household expenditure is represented by expenditure on education, health and other household expenditures. In this article the authors
wanted to examine about 1) the factors that affect the HDI, household expenditures on education, health and others household expenditures and 2) how are the impacts of government expenditure policy (sectors of education, health, and infrastructure) on human development index of districts and municipalities in Central Java.
RESEARCH METHODS
This research used poled data; it is a combination of time series data and cross section data in 29 districts and 6 municipalities during 2004 to 2011 in Central Java. The Model built by
econometric approach in simultaneous
equations system, covered 5 blocks, which were government’s revenue, expenditure, input, output, and performance. It consisted of 26 equations (19 structural equations and 7 identity equations) are as follows:
Block of Government Receipt
First, Equation of Tax Revenue
TAX = a0 + a1PDRB+ a2 TPP+ a3 INV + a4 TREND+
a5 LTAX+ u1...(1)
The expected sign is: a1, a2, a3 >0 and 0< a5 <1
TAX is tax revenue (billion rupiah /year), TPP is total local government expenditure (billion / year), PDRB is gross regional domestic product (billion / year), INV is investment (billion / year), and LTAX is tax last year.
Second, Equation of Non Tax Revenue
NTAX = b0 + b1PDRB+ b2 TPP+ b3 POV + b4 PTK
+ b5 INV+ b6 TREND + b7 LNTAX+ u2...(2)
The expected sign is: b1, b2,b3, b4, b5 >0, and 0< b7
< 1
Third, Equation of Total Government Revenue
PENPEM = TAX +
NTAX...(3)
Where PENPEM is government revenue (billion / year), TAX is tax revenue (billion rupiah/ year), and NTAX is non tax revenue (billion / year).
Block of Expenditure
First, Equation of Government Expenditures for Health
PKESP = c0 + c1PENPEM + c2 POP+ c3
TREND+ c4 LPKESP +
u3...(4)
The expected sign is: c1, c2 >0, and 0<c4 < 1
Where PKESP is government
expenditures for health (billion / year), PENPEM is government revenue (billion / year), and POP is population (thousand people).
Second, Equation of Government
Expenditures for Education
PPENP = d0 +d1PENPEM+ d2 TREND + d3
LPPENP +
u4...(5) The
expected sign is: d1 >0 and 0<d3 < 1
PPENP is government expenditures for education (billion / year) and PENPEM is government revenue (billion / year).
Third, Equation of Government Expenditures for Infrastructure
PINF = e0 + e1 PENPEM + e2 PPL+ e3 POV+ e4
LPINF + u5...(6)
The expected sign is: e1, e3, >0, e2 < 0 and 0<
e4 < 1
PINF is government expenditures for infrastructure (billion / year), PENPEM is
government revenue (billion / year), and POV is poverty (people).
Fourth, Equation of Other Government Expenditures
PPL = f0 + f1PENPEM + f2 POP+ f3 TREND + f4
LPPL + u6...(7)
The expected sign is: f1, f2, >0, and 0<f4 < 1
Where PPL is government expenditures for other sectors (billion / year), PENPEM is government revenue (billion / year), and POP is population (people).
Fifth, Equation of Total Government
Expenditure
TPP = PKESP+ PPENP+PINF+ PPL...(8)
TPP is total local government expenditures (billion / year), PINF is government spending for infrastructure (billion / year) , PKESP is government spending for health (billion / year), PPENP is government spending for education (billion / year), and PPL is government expenditures of other sectors (billion / year). Sixth, Equation of Household Expenditure for Health
PKESRT = g0 + g1YD + g2 LIPM+ g3POP+
g4TREND + g5LPKESRT+ u7...(9)
The expected sign is: g1, g2, g3 >0, and 0<g5< 1
Where PKESRT is household expenditure for health (billion / year), YD is disposible income (billion / year), and POP is population (people).
Seventh, Equation of Household Expenditure for Education
PPENRT = h0 + h1YD + h2 LIPM+ h3POP+h4
TREND + h5LPPENRT+ u8...(10)
The expected sign is: h1, h2, h3 >0 and 0<h5< 1
income (billion / year), and LIPM is lag human development index.
Eighth, Equation of Other Household Expenditures
PRTL = i0 + i1YD + i2 LIPM+ i3 POP+ i4 TREND
+ i5LPRTL+
u9...(11) The
expected sign is: i1, i2, i3 >0 and 0<i5< 1
PRTL is other household expenditures (billion / year), YD is disposible income (billion / year), LIPM is IPM last year, and POP is population (people).
Ninth, Equation of Total Household
Expenditure
TPR = PKESRT + PPENRT + PRTL ...(12)
WTPR is total household expenditure (billion / year), PKESRT is household expenditure for health (billion / year), PPENRT is household expenditure for education (billion / year), and PRTL is other household expenditures (billion / year). Tenth, Equation of Investation
INV = jo + j1SB + j2 PINF+ j3 LINV + u10...(13)
The expected sign is: j1 <0, j2 >0 and 0<j3< 1
INV is investation (billion / year), SB is interest rate (percent), and PINF is government spending for infrastructure (billion / year).
Block of Input
First, Equation of Physical Capital
PC = k0 +k1 INV + k2 PINF+ k3 PPENP + k4LPC+
u11...(14)
The expected sign is: k1, k2, k3 > 0, and 0<k4< 1
Where PC is phisical capital and PINF is government spending for infrastructure (billion / year).
Second, Equation of Absorption of Agricultural Workers
PTKA = m0 + m1PDRBA +m2 UMK + m3 TREND +
m4 LPTKA + u12...(15)
Expected sign of the parameter m1 >0, m2< 0 and
0< m4<1
PTKA is absorption of agricultural labor (people) and UMK is district minimum wage (million / month).
Third, Equation of Absorption of Industrial Labor
PTKI = n0 + n1PDRBI + n2UMK + n3 TREND +
n4LPTKI+ u13...…(16)
Expected sign of the parameter n1>0, n2< 0 and
0<n4<1
PTKI is industrial employment (people), PDRBI is gross regional domestic product of industry (billion / year), and LPTKI is absorption of industrial employment (people).
Fourth, Equation of Absorption of Manpower Services
PTKS = o0 + o1PDRBS + o2UMK + o3 TREND+ o4
LPTKS+ u14...(17)
Expected sign of the parameter o1>0, o2< 0 and
0<o4<1
PTKS is absorption of service labor (people) and PDRBS is gross regional domestic product of services (billion / year).
Fifth, Equation of Total Labor Absorption PTK = PTKA + PTKI+ PTKS ...(18) Where PTK isTotal employment (people).
Block of Output
First, Equation of Gross Regional Domestic Product of Agriculture
PDRBA = p0+ p1 PC + p2 PTKA+ p3 TREND+ p4
LPDRBA+ u15...(19)
PDRBA is gross regional domestic product of agriculture (billion / year), PC is phisical capital, and PTKA is absorption of agricultural labor (people).
Second, Equation of Gross Regional Domestic Product of Industry
PDRBI = q0 + q1 PC + q2 PTKI+ q3 TREND+ q4
LPDRBI+u16...(2
0) The expected sign is: q1, q2 > 0 and 0<q4 <1
PDRBI is gross regional domestic product of industry (billion / year), PC is phisical capital, PTKI is absorption of industrial employment (people), and PPENP is government spending for education (billion / year).
Third, Equation of Gross Regional Domestic Product of Services
PDRBS = r0 + r1 PC+ r2PTKS+ r3 TREND + r4
LPDRBS + u17...(21)
The expected sign is: r1, r2 >0 and 0<r4< 1
PDRBS is gross regional domestic product of services (billion / year), PC is phisical capital, PTKS is absorption of service abor (people), and PPENP is government spending on education (billion / year). Fourth, Equation of Gross Regional Domestic Product
PDRB = PDRBA + PDRBI + PDRBS ...(22)
PDRB is gross regional domestic product (billion / year), PDRBA is gross regional domestic product of agriculture (billion / year), PDRBI is gross regional domestic product of industry (billion / year), and PDRBS is gross regional domestic product of services (billion / year).
Block of Performance
First, Equation of Gross Regional Domestic Product per Capita
YCAP = PDRB/ POP ...(23)
YCAP is gross regional domestic product per capita (billion / year), PDRB is gross regional domestic product (billion / year), and POP is population (people).
Second, Equation of Disposable Income
YD = PDRB – TAX ...(24)
YD is disposable income, PDRB is gross regional domestic product (billion / year), and TAX is tax.
Third, Equation of Poverty
POV = s0 + s1TPR + s2 UNEMP + s3 PL + s4 POP+
s5 STKA + s6 INF+s7 LPOV + u18...(25) The
expected sign is: s1< 0 , s2, s3, s4, s5, s6> 0, and 0<s7
<1
POV is poverty (person), TPR is total household expenditures (billion / year), UNEMP
is unemployed (people), PL is poverty line (million / month), and STKA is share of agricultural labor (percent).
Fourth, Equation of Human Development Index IPM = t0 + t1 YCAP + t2 POV+ t3 LIPM+ u19....(26)
Expected sign of the parameter t1 >0, t2< 0, and
0<t3<1
IPM is human development index, YCAP is gross regional domestic product per capita (milion / year), and POV is the number of poor (people).
Structural model identification was
conducted based on order condition: if (K-M) = (G-1) then the equation is exactly identified
(exactly identified), if (K-M) <(G -1) then the
equation will not be identified (under identified),
and if (K-M) > (G-1) then equation in model
consitutes over identified. Where K is total
variable in the model (variabel endogenous and predetermine variables), M is total of
equation and G is total of equation in the
model (total endogenous variable)
(Koutsoyiannis, 1977). Method of model
estimation used method two stage least
squares (2SLS), because each structural
equation in model is over identified.
Estimation used Statistical Analysis System/
Econometric Time Series (SAS/ETS) program
version 9.2 and linier system procedur (SYSLIN).
To test whether the explanatory variables simultaniously describe the diversity of the endogenous variables in each equation, then F statistical test was used, with significance level (
) of 1%. In addition, to test whether or not each explanatory variable individually provides real effect on the endogenous variable in each equation, then t statistical test was used, with a significance level (
) of 1%.To find out if the model is valid enough to be used for policy simulation, thus the estimted value validation of econometric model used is the Percent Root Mean Squares Error (RMSPE) and Theil's Inequality coëficient (U Theil). The results of model validation on 26 equation showed that 25 (96%) equation have RMSPE value below 25%, while based on the prediction deviation of U Theil, all of equations have value below 16%. These results indicated that, overall, the model is valid enough to be used in the prediction simulation. By considering model validity for both areas (district and municipal), then prediction simulation was performed for both areas. Prediction Simulations on exogenous variables was performed for period of 2015 to 2020, using the method of prediction of forecasting Autoregressive Integrated Moving Average
(ARIMA) and Stepwise Autoregressive
(STEPAR). Results of exogenous variables
prediction are used to estimate the value of endogenous variables. Prediction simulation is useful as an alternative reference of government policy in the future with respect to the expenditure policies of education, health and infrastructure in order to improve the Human Development Index. The result of prediction
simulation can be used as policy
recommendations for local governments in Central Java for the period 2015-2020. Model validation was performed using non linear simulation procedures (SIMNLIN) and Newton's
method. This research used prediction
simulation (ex-ante simulation) in the period from 2015 to 2020, based on the territory of the municipality and district in Central Java. The prediction simulation stages are: (1) predicting values of exogenous variables using stepwise Autoregressive method (STEPAR) trend = 2, (2)
predicting endogenous variables using
simultaneous equation model in the period from 2015 to 2020, and (3) comparing the results of basic simulation and prediction simulation in the period of 2015-2020. Analysis of prediction simulation of expenditure of education, health, and infrastructure on Human Development Index for district and municipality area, period of 2015-2020 was as follows: (1) combination of policy of education and helath expenditure
respectively were 100 billion IDR, (2)
Combination of policy of increase in education and infrastructure expenditure respectively are 100 billion IDR.
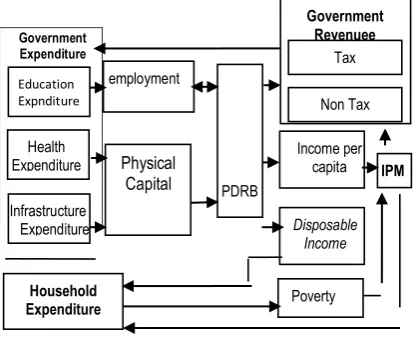
health and infrastructure expenditure can improve physical capital. The Increase in employment and physical capital can boost the improvement of the GDP, increase income per capita and Human Development Index. On the other hand the increase in the GDP also affected the increase in people's income (disposable income). Increase in revenue, encourage society to promote their household expenditures for education, health and other expenditure.
Figure 1. Model of Government and Household impact on Human Development Index.
Increased household expenditure is influential in reducing poverty. The decline number of poor people will increase the Human Development Index. Increased HDI is an indication of increased welfare, so as to encourage people to increase their household expenditures. Increased HDI also resulted in increased government revenue and encourage the government to increase the government
expenditure. Increased government
expenditure can stimulate the economy and improve HDI, and so they can affect each other simultaneously. Model can be seen completely in Figure 1.
RESULTS AND DISCUSSION
The result of equation of Human Development Index showed determination
coefficient (R2) of 2.3%. Endogenous variable in
the equation of Human Development Index was significantly affected by explanatory variablels that was simultaneously showed by F statistic on
significance standard (
) of 0.01 by the value of209,26. The estimated result of equation of Human Development Index showed that HDI was significantly affected by income per capita, poverty, and HDI in the past year by a sign that is suitable with hypotheisis. For further
explanation on equation of Human
Development Index, you may find it in the Table 1.
Table 1. . Estimated result of equation parameter of Human Development Index
Variabel Intersep 30.53099 0.0001
Income
Sources: Result of output SAS/ETS, version 9.2.
The effect of all independent variable is inelastics to HDI variable. In a short term, 10% increase in income per capita lead to the 0,1% increase in HDI and every 10% poverty decline, there will be 0,1% increase in HDI. In a long term, 10% increase in income per capita lead to 0.3% increase in HDI and 10% poverty decline will lead to the 0,3% increase in HDI. This result is in line with the research conducted by (Cahyadhi, 2005), stating that economic development, allocation for social budget, ratio of education tools, ratio of health tools, the average householf
expenditure provides positive effect, while poverty provides negative effect on HDI achievement. It is also supported by research conducted by (Mirza, 2012), stating that economic growth provides positive effect, while poverty gives negative effect on HDI. In addition, (Hakim and Setiawan, 2013), also concludes that Gross regional domestic product provides positive effect on HDI.
This result is in line with the theory of
the circle of poverty, that the low society income will increase poverty. Poverty leads society to not be able to fulfill their needs properly (including education and health). Consequently, the low education and health will affect their productivity in working. The low productivity then leads to low income, hence poverty increase. Furthermore, poverty will cause society to not be able to fulfill their needs; and so on they will affect each other, roatate in circle without end. It is essential to have participation from all parties, who are government and society to break this vicious circle of poverty together. It is expected that government may increase social welfare and promote Indonesian citizen by budget policy and regulation that is in accordance with constitution mandate.
The improvements of society income
will ecourage increase in household
expenditure. The increase in household expenditure (the incrsea in social welfare) will reduce poverty. The decline number on poor people will increase HDI. Increase in HDI is an indicator that there is social welfare. It can be seen in Table 2, 3, and 4 describing the great effect of HDI on the increase in the household expenditure for health, education, and other consumption expenditures with great response (elastic).
The result of equation of household expenditure on health has determination
coefficient (R2) of 69.2%. Endogenous variable in
the equation of household expenditure on health
is significantly affected by explanatory
variablesthat is simulatneaously showed by F
statistic on significance standart of (
) 0.01 withvalue of 107.15. The result of equation of household expenditure on health can be seen completely in the Table. 2
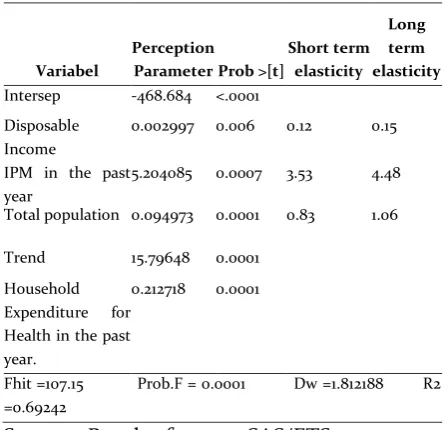
Table 2. Estimated result of equation parameter of Household Expenditure for Health
Variabel Intersep -468.684 <.0001
Disposable
Total population 0.094973 0.0001 0.83 1.06
Trend 15.79648 0.0001
Household Expenditure for Health in the past year.
0.212718 0.0001
Fhit =107.15 Prob.F = 0.0001 Dw =1.812188 R2 =0.69242
Sources: Result of output SAS/ETS
Household Exenditure for health is
significantly affected by disposable income, HDI
household expenditure for health. Every 10% increase of HDI in the past year, will increase the household expenditure for health by 35.3%. In a long term, 10% increase in HDI in the past year will increase household expenditure for health by 44.8%. Based on equation 1 and 2, it can be concluded that there is interplay relationship between HDI and household expenditure. This result is in line with the research conducted by (Pratowo, 2013), concluding that there is positive effect between non-food expenditure and HDI.
The equation of household expenditure for education has determination coefficient
(R2) of 68%. Endogeneous variable in the
equation of household expenditure for education is significantly affected by explanatory varables that is simultaneously showed by F statistic on significance standard
(
) of 0.01 with value of 101.3.Household Exenditure for educaton is
significantly affected by disposable income,
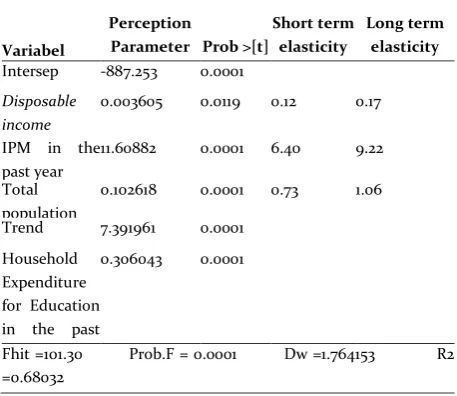
HDI in te past year, total population, trend of time, and household expenditure for education in the past year with a sign that is suitable with hypothesis. The result of equation of household expenditure on education can be seen completely in the Table. 3. It is the same with the equation of household expenditure for health, HDI in the past year provides elastic effect in increasing household expenditure for education, and even the effect is more elastic. Every 10% increase in HDI in the past year will increase the household expenditure for education by 64 %. In long term, 10% increase in HDI in the past year will increase household expenditure for education by 92.2%.
In shorth term, 10% increase in
disposable income lead to household
expenditure for education to be increased by 1.2%. 10% increase in total population will also increase the household expenditure for
education by 7.3%. In a long term, 10% increase
in disposable income lead to household
expenditure for education to be increased by 1.7%. 10% increase in total population will also increase the household expenditure for education by 10.6%.
Table 3. Estimated result of equation parameter of Household Expenditure for Education
Variabel
Perception
Parameter Prob >[t]
Short term elasticity
Long term elasticity Intersep -887.253 0.0001
Disposable
Sources: Result of output SAS/ETS
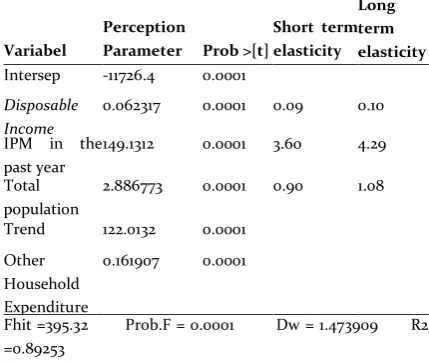
Other household expenditure in this research includes all of household expenditures except for education and health. The equation of other household expenditure has determination
coefficient (R2) of 89.2%. %. Endogeneous
variable in the equation of household expenditure for education is significantly affected by explanatory varables that is simultaneously showed by F statistic on significance standard (
) of 0.01 with value of 395.32.Other household expenditure is
significantly affected by disposable income, HDI
in the past year, total population, trend of time, and other household expenditure in the past year with a sign that is suitable with hypothesis
increasing other household expenditure. HDI increase means that society income more increases (social welfare). The increase in society income will boost the increase in household consumption. The result of equation of other household expenditure can be seen completely in Table.4
Table 4. Estimated result of equation parameter of Other Household Expenditure
Variabel
Perception
Parameter Prob >[t]
Short term elasticity
Long term elasticity Intersep -11726.4 0.0001
Disposable other household expenditure to be increased by 36%. 10% increase in total population will also increase other household expenditure by
9%. In long term, 10% increase in disposable
income lead to other household expenditure to be increased by 1%. 10% increase in HDI in the past year will lead to other household expenditure to be increased by 42.9%. 10% increase in total population will also increase other household expenditure by 10.8%.
The results show that the increase in education, health, and infrastructure provide positive impact in increasing regional output
(Gross Domestic Regional Product) income per capita, Human Development Index. In the same case, this result is the same with research conducted by (Pangastuti, 2015), stating that government expenditure for education provides positive effect and significance of 1.118658 on HDI in the District/Municipality of Central Java. Meanwhile, government expenditure for health provides positive effect and significance of 1.362280 on HDI in the District/Municipality of Central Java.
The increase in Gross Domestic Regional Product provides positive effect in increasing
disposable income. By the increase in income, the
society is encouraged to increase their household expenditure for education, health, and other expenditure. The increase in household expenditure (is an indication for the increase in social welfare) is significant to reduce poverty. When the number of poverty decline, then the number of Human Development Index will increase. Increase in HDI provides positive effect in increasing household expenditure (see Table 2, 3, and 4) the increase in HDI indirectly also provides positive effect in increasing tax revenue
and ecourage government to increase
government expenditure, either for municipality area (Table 5 and 6) or district area (Table 7 and 8) in Central Java. The impact of combination of policy of increase in education and health expenditure respectively is 100 billion IDR in the Municipality of Central Java on income per
capita, disposable income dan HDI can be seen
completely in Table 5.
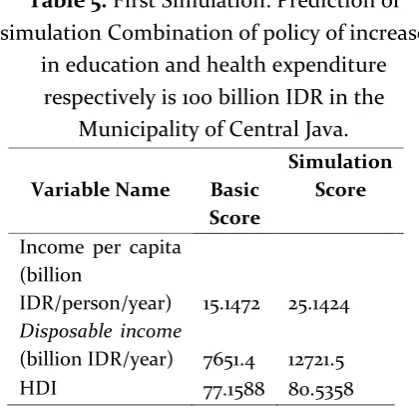
Table 5 describes that the increase in education and health expenditure respectively is 100 billion on HDI in municipality of Central Java leat the income per capita to be increased from
15.1472 million/person/year to 25.1424
million/person/year. Disposable income
billion/year. Menawhile, HDI increase from 77.1588 to 80.5358 or increased by 4.38%.
Table 5. First Simulation: Prediction of simulation Combination of policy of increase
in education and health expenditure respectively is 100 billion IDR in the
Municipality of Central Java.
Variable Name Basic Score
Simulation Score
Income per capita (billion
IDR/person/year) 15.1472 25.1424 Disposable income
(billion IDR/year) 7651.4 12721.5
HDI 77.1588 80.5358
Sources: Result of output SAS/ETS, version 9.2
Prediction of simulation Combination of policy of increase in education and health expenditure respectively is 100 billion IDR in the Municipality of Central Java cause income per capita to increase from 15.1472 billion/year
to 25.2067 billion/year. Disposable income
increases from 7651.4 billion/year to 12753.8 billion/year. HDI increases from 77.1588 to 80.5585 or increased by 4.41%, these results can be seen completely in Table 6.
Table 6. Second Simulation: Prediction of Policy Combination of Increase in
Education and Health Expenditure respectively is 100 billion in Municipality
of Central Java.
Variable Name Basic
Score
Simulation Score
Income per capita (billion
IDR/person/year) 15.1472 25.2067
Disposable income
(billion IDR/year) 7651.4 12753.8 HDI 77.1588 80.5585 Sources: Result of output SAS/ETS
Bsed on the case in the municipality of Central Java, it can be concluded that the second simulation (Table 6) results better score compared to the first simulation (Table 5). This result shows that combination policy of increase in education and infrastructure expenditure is preferably to combination policy of increase in education and health expenditure because it generates better performance improvements in income per capita, disposable income and HDI.
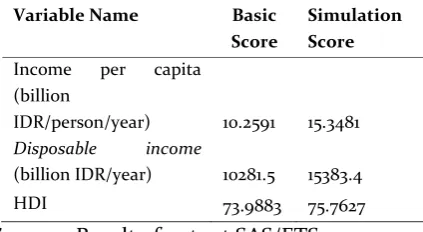
In the district area, simulation of increase in education and health expenditure is respectively of 100 billion in the districts of Central Java and it can be seen completely in Table 7.
Table 7. Third Simulation: Prediction of Policy Combination of Increase in Education
and Health Expenditure respectively is 100 billion in District of Central Java
Variable Name Basic
Score
Simulation Score Income per capita
(billion
IDR/person/year) 10.2591 15.3144 Disposable income
(billion IDR/year) 10281.5 15349.8
HDI 73.9883 75.7505
Sources: Result of output SAS/ETS, version 9.2
Table 5 describes that the simulation of increase ineducation and health expenditure, which respectively is 100 billion in District of Central Java can increase income per capita from
10.2591 million/person/year to 15.3144
million/person/year. Disposable income
increases from 10281.5 billion/year to 15349.8 billion/year. HDI increases from 73.9883 to 75.7505 or inceased by 2,38%
resources in the municipality are much better than the district.
The next simulation on prediction of policy combination of increase in education
and infrastructure expenditure which
respectively is 100 billion in the District of Central Java can be seen in Table 8.
Table 8. Fourth Simulation: Policy combination of increase in education and infrastructure expenditure which respectively is 100 billion in the District of Central Java
Variable Name Basic
Score
Simulation Score
Income per capita (billion
IDR/person/year) 10.2591 15.3481
Disposable income
(billion IDR/year) 10281.5 15383.4 HDI 73.9883 75.7627 Sources: Result of output SAS/ETS
The result of simulation of increase in education and infrastructure expenditure which respectively is 100 billion in the District leads to increase in income per capita from
10.2591 million/person/year to 15.3481
million/person/ year. Disposable income
increases from 10281.5 billion/year to 15383.4 billion/year. HDI increases from 73.9883 to 75.7627 or increased by 2.4%. If the second simulation (Table 6) is compared to the fourth simulation (Table 8) results in a better performance. These results show that with the same fiscal stimulus, the impact of performance improvement in municipality is better than the district area. It is the same
with municipality area, the policy
combination of increase in education and infrastructure expenditure generate better performance in increasing income per capita,
disposable income dan HDI compared to
policy combination of increase in education
and health expenditure in District area of Central Java.
CONCLUSION
Human Development Index is significantly affected by income per capita and poverty. Even tough its effect is relatively small (inelastic), income per capita brings positive effect on HDI, while poverty brigs negative effect to HDI. In the short term, every increase in income per capita and decline in poverty of 10%, then HDI will increase 0,1%.
Response on household expenditures for education, health, and other household expenditure are elastic (provide great effect) on HDI changes. Every 10% increase in HDI lead to the increase in household expenditure for education by 64%, household expenditure for health increased by 35%, and other household expenditure increased by 36%.
The policy combination of increase in
education and infrastrucure expenditure
generates better performance in increasing income per capita, disposable income and HDI compared to policy combination of increase in education and health expenditure, both in the municipality and district in Central Java. But the greatest development benefits are enjoyed by the municipality rather than the district.
million/person/year. Disposable income increases from 10281.5 billion/year to 15349.8 billion/year. HDI increases from 73.9883 to 75.7505 or inceased by 2,4%
Increase in education and health expenditure, which respectively is 100 billion on HDI in municipality in Central Java leads to the increase of income per capita from
15.1472 million/person/year to 25.1424
million/person/year. Disposable income
increases from 7651.4 billion/year to 12721.5 billion/year. Menawhile, HDI increase from 77.1588 to 80.5358 or increased by 4.38%. Menawhile, Increase in education and health expenditure, which respectively is 100 billion in District of Central Java can increase income per capita from 10.2591 million/person/year to 15.3144 million/ person/ year. Disposable income increases from 10281.5 billion/year to 15349.8 billion/year. IDM increases from 73.9883 to 75.7505 or increased by 2.38%.
REFERENCES
Albanesi, S., 2007. Inflation and inequality. J. Monet. Econ. 54, 1088–1114. doi:10.1016/j.jmoneco.2006.02.009
Amir, A., 2008. Sumber-sumber Pertumbuhan Ekonomi Indonesia. Fakultas Ekonomi, Universitas Jambi, Jambi.
Cahyadhi, P.E., 2005. Pelacakan Faktor-faktor yang Mempengaruhi Indeks Pembangunan Manusia (Tesis Magister). Universitas Indonesia, Jakarta. Central Bureau of Statistics, 2017. Provinsi Jawa Tengah
Dalam Angka 2017. CBS Central Java Province, Semarang.
Gould, F., 1983. The Development of Public Expenditures in Western, Industrialised Countries: A Comparative Analysis. Public Finance Financ. Publiques 38, 38–69.
Hakim, A., Setiawan, M.B., 2013. Indeks Pembangunan Manusia Indonesia. J. Econ. 9.
Hess, P., Ross, C., 1997. Economic Development: Theories, Evidence and Policies. Harcourt Brace College Publishers, Fort Worth.
Koutsoyiannis, A., 1977. Theory of Econometrics: An Introductory Exposition of Econometric Methods. MacMillan Press Ltd, London.
Landau, D., 1986. Government and Economic Growth in the Less Developed Countries: An Empirical Study for 1960-1980. Econ. Dev. Cult. Change 35, 35–75. doi:10.1086/451572
Mirza, D.S., 2012. Pengaruh Kemiskinan, Pertumbuhan Ekonomi dan Belanja Modal terhadap Indeks Pembangunan Manusia di Jawa Tengah Tahun 2006-2009. Econ. Dev. Anal. J. 1, 1–14.
Myers, C.A., 1963. Education, Manpower and Economic Growth. Acad. Manag. Proc. 1963, 69–70. doi:10.5465/AMBPP.1963.5068061
Nanga, M., 2006. Dampak transfer fiskal terhadap kemiskinan di Indonesia : suatu analisis simulasi kebijakan.
Novignon, J., Aboagye, E., Agyemang, O.S., Aryeetey, G., 2015. Socioeconomic-related inequalities in child malnutrition: evidence from the Ghana multiple indicator cluster survey. Health Econ. Rev. 5, 34. doi:10.1186/s13561-015-0072-4
Pangastuti, Y., 2015. Analisis Pembangunan Sumber Daya Manusia Di Provinsi Jawa Tengah Tahun 2009-2013. J. Ekon. Dan Kebijak. 8, 238–249.
Pratowo, N.I., 2013. ANALISIS FAKTOR-FAKTOR YANG BERPENGARUH TERHADAP INDEKS PEMBANGUNAN MANUSIA. J. Studi Ekon. Indones.
Ram, R., 1986. Government Size and Economic Growth: A New Framework and Some Evidence from Cross-Section and Time-Series Data. Am. Econ. Rev. 76, 191–203. doi:10.2307/1804136
Saunders, P., 1985. Public Expenditure and Economic Performance in OECD Countries. J. Public Policy 5, 1–21. doi:10.1017/S0143814X00002865
Sen, A., 2001. Development as Freedom. OUP Oxford. Siregar, H., Wahyuniarti, D., 2007. Dampak Pertumbuhan
Ekonomi Terhadap [WWW Document]. Scribd. URL
https://www.scribd.com/doc/90938063/Dampak-Pertumbuhan-Ekonomi-Terhadap (accessed 8.30.17).
Sitepu, R.K.-K., 2007. Dampak investasi sumberdaya manusia dan transfer pendapatan terhadap distribusi pendapatan dan kemiskinan di Indonesia. The impact of human resource investment and income transfer on income distribution and poverty in Indonesia.
Smith, D., 1985. Public Consumption and Economic Performance. Natl. Westminst. Bank Quartely Rev.
Sulistyowati, N., Harianto, H., Priyarsono, D.S., Tambunan, M., 2010. DAMPAK INVESTASI PENDIDIKAN TERHADAP PEREKONOMIAN DAN KESEJAHTERAAN MASYARAKAT KABUPATEN DAN KOTA DI JAWA TENGAH. J. Organ. Dan Manaj. 6, 158–170.
Sumas, S., 2012. Dampak kebijakan fiskal sektor pendidikan dan sektor kesehatan terhadap indeks pembangunan manusia di Indonesia. Todaro, M.P., Smith, S.C., 2006. Economic Development
9th Edition. Pearson Education Limited, United Kingdom.
United Nations Development Program, 2016. Human Development Report 2016: Human Development for Everyone. United Nations Development Program, New York.
Utami, D.R., 2007. Analisis Pengaruh Pengeluaran Pemerintah Daerah Kabupaten/ Kota di Bidang Pendidikan dan Kesehata terhadap Indeks Pembangunan Manusia (Tesis Magister). Universitas Indonesia, Jakarta.