Identification and Quantification of
Mineral Precipitation in Fe
0
Filings
from a Column Study
W I W A T K A M O L P O R N W I J I T ,† L I Y U A N L I A N G , *, † , ‡
G E R I L Y N N R . M O L I N E ,†
T O D D H A R T ,§ A N D O L I V I A R . W E S T† Environmental Sciences Division, Oak Ridge National Laboratory, P.O. Box 2008, Oak Ridge, Tennessee 37831-6036, Cardiff School of Engineering, Cardiff University, Queen’s Buildings, P.O. Box 925, Cardiff CF24 0YF, Wales, U.K., and Battelle Pacific Northwest National Laboratory, P.O. Box 999, Richland, Washington 99352
Thermogravimetric analysis (TGA) combined w ith X-ray
diffraction (XRD) w as used to identify mineral phases and
determine corrosion rates of granular iron samples from
a 2-yr field column study. Similar to other studies, goethite,
magnetite, aragonite, and calcite w ere found to be the
major precipitated minerals, w ith Fe
2(OH)
2CO
3and green
rust as minor phases. Based on TGA-mass spectrometry
(M S) analysis, Fe
0corrodes at rates of 0.5
-
6.1 mmol kg
-1d
-1in the high NO
3-
(up to 13.5 mM ) groundw ater; this
rate is significantly higher than previously reported. Porosity
reduction w as 40.6%
-
45.1% for the inlet sand/Fe
0interface
and 7.4%
-
25.6% for effluent samples of tw o test columns.
Normalized for treatment volumes, porosity loss values are
consistent w ith studies that use high levels of SO
42-but
are higher than those using low levels of corrosive species.
Aqueous mass balance calculations yield corrosion
rates similar to the TGA-M S method, providing an alternative
to coring and mineralogical analysis. A severely corroded
iron sample from the column simulating a 17-yr treatment
throughput show ed
>
75% porosity loss. Extensive porosity
loss due to high levels of corrosive species in groundw ater
w ill have significant impact on long-term performance
of permeable reactive barriers.
Introduction
Zerovalent iron (Fe0) has been widely used as a reactive medium in permeable reactive barriers (PRB) for treating organic (11) and inorganic contaminants (12). Knowledge of rates and products of Fe0corrosion and other biogeochemical reactions associated with long-term water flow within the PRB is of critical importance for efficient application of this technology (3-5,13). Precipitation of secondary minerals,
defined as phases not involved in containment of the contaminant (1), can lead to loss of iron reactivity (13), reduced hydraulic conductivity (1,14), and the development of preferential flow (15,16). The effects of these on the long-term performance of a PRB will depend on the type of minerals precipitated as well as the mass of precipitation over time. A wide range of mineral precipitates has been
identified in laboratory and field studies, including amor-phous iron oxyhydroxide (ferrihydrite), aragonite, calcite, crystalline iron (oxyhydr)oxide (akaganeite, goethite, mag-netite, hematite, lepidocrocite, etc.), green rust, siderite, and mackinawite (1-5, 8, 10). However, direct methods for
quantifying mineral precipitates and the long-term impact of these corrosion products on Fe0-PRB longevity are not well established.
Precipitates can be quantified using mass balance of pore water chemistry up- and down-gradient of a PRB, assuming that such precipitates (such as CaCO3) are the sink of aqueous species (9,14,17). Using mass balance approach to quantify iron-bearing precipitates, however, requires knowledge of iron corrosion rates because dissolved Fe from corrosion is concurrently removed by precipitation (9,18, 19) within the PRB. Published values of Fe0corrosion rate are sparse (6,20) and are not applicable to all types of iron and groundwater. Direct XRD quantification of iron-containing precipitates in core samples suffers from overwhelming interference of Fe0 that cannot be completely separated from corrosion products. Sequential chemical extraction, a common method for soil mineral analysis, is not suitable for Fe0samples because Fe0 dissolves in the extraction solution. An effective technique, therefore, must either permit the analysis of precipitates without separation from the Fe0 or be unaffected by the presence of Fe0.
Thermogravimetric analysis (TGA) has been widely used in the study of phase transformations at different temper-atures (21). In this technique, mineral phases are quantified by integrating weight changes during transformation. The use of mass spectrometry (MS) with TGA for off-gas analysis can confirm the presumed phase. Because Fe0is thermo-dynamically stable under inert or reducing conditions, it does not influence TGA results. With knowledge of phase stability and transformation at given temperatures, identification and quantification of some important mineral phases can be made without having to extract or separate precipitates from the Fe0media.
In this study, quantification of precipitates and derivation of Fe0corrosion rates were pursued using core samples from field columns subjected to∼2-yr treatment of groundwater containing up to 13.5 mM NO3-(16). TGA-MS combined with X-ray diffraction (XRD) and scanning electron micros-copy (SEM) were used to directly quantify precipitate compositions in iron core samples. Degrees of cementation and pore filling within Fe0were estimated for samples treated under both accelerated- and normal-flow conditions. This method is compared with a mass balance approach which uses pore water composition to estimate Fe0corrosion and precipitation. The impact of mineral precipitation on the performance of the PRB in terms of porosity reduction is assessed.
Experimental Methods
Materials.Iron core samples were collected from two large field columns (92-cm long, 15-cm diameter, see Plate 1, Supporting Information) that were operated for∼2 yrs at the Y-12 National Security Complex in Oak Ridge, Tennessee (16). The columns were oriented horizontally ∼70-ft up-gradient from an existing PRB (Figure 1 in ref22), using the same iron filings as the PRB. Two flow rates were used, yielding initial pore velocities of 9.4 m d-1in Column I and 0.33 m d-1in Column II. The slower flow was intended to simulate typical field conditions, while the faster flow was designed to simulate treatment of high throughput for a period of∼17 years. Insufficient residence time may not * Corresponding author phone: +44(0)29 2087 6175; e-mail:
†Oak Ridge National Laboratory. ‡Cardiff University.
§Battelle Pacific Northwest National Laboratory.
Environ. Sci. Technol.2004,38,5757-5765
adequately simulate high volume treatment if biogeochemical reactions do not reach completion. Nonetheless, the columns do appear to have captured major corrosion and precipitation reactions (16, 17) as indicated by high effluent pH and progressive removal of Ca and NO3-in pore water (Figure 1a,c) during the first two-month operation. Site groundwater was directly pumped into the columns; the composition varied due to seasonal changes, exhibiting 6.6-7.4 pH, 3.7
-6.4 mM alkalinity, 5.4-9.0 mM Ca, 0.8-13.5 mM NO3-, 0.6 -0.9 mM SO42-, 1.0-2.5 mM Cl-, and∼9µM dissolved O2. Figure 1 shows several snapshots of chemical profiles along the columns: homogeneous flow condition during the early stage (Figure 1a,c) and heterogeneous at later stage (Figure 1b,d). Description of column set up, operation, and the geochemical and hydrologic monitoring results are presented in detail elsewhere (16, 17).
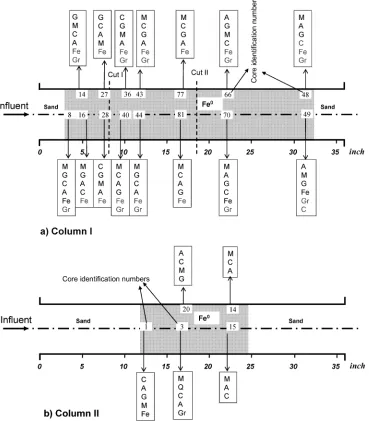
Column I was disassembled after 680-d operation, having treated 11.5 m3 groundwater (1336 pore volume). Pore volumes were calculated based on an initial porosity measured at 60% (16). Dissection required use of a hole-saw for the collection of core plugs (2.9-cm diameter by 4.1-cm long) under atmospheric conditions. Exposure time was minimized by immediate transfer of samples to plastic bags, which were stored in a closed PVC tube flushed with Ar gas at 5-psi pressure. The column was dissected in ∼5-cm sections, typically with 5 cores from each section (Figure 2, also see Plate 2, Supporting Information).
Column II was disassembled after 695 d, having treated 1.1 m3groundwater (∼150 pore volume). Sample collection was done easily with a spatula. Samples were collected and stored in Ar as done for Column I samples.
Sample Preparation and Analysis.Most of the iron core samples from Column I maintained the cylindrical shape of
the hole-saw. The surface of the core plug may be affected by drilling-induced heating and atmosphere exposure and was therefore removed prior to sampling for mineralogical analysis. Subsamples were used for XRD analysis and TGA-MS and SEM characterization. The XRD samples were sonicated for 1/
2 hour in acetone and then wet ground under Ar flow. Upon drying, samples were sieved through a #120 (125 µm) sieve and the finer fractions collected for XRD (Scintag XDS2000) analysis. Samples for TGA-MS and SEM analysis were dried anoxically before further prepara-tion.
TGA-MS analysis was performed on selected samples, including the following: (1) 0-4 cm from the inlet sand-Fe0 interface (CS-I-8, CS-II-1), (2) mid-span (CS-I-81, 37-41 cm
into Column I; CS-II-3, 37 cm into Column II), and (3) 0-4
cm from the effluent sand-Fe0interface (CS-I-49, CS-II-15). The term “CS” denotes “column sample”, roman numerals identify the columns, and integers identify samples (Figure 2). Stock iron filings were also analyzed. Samples (∼100 mg) were placed in pure alumina crucibles and heated to 900°C at a rate of 10°C min-1under He gas flow at a rate of 100 mL min-1. Analyses were performed using a Netzsch STA 409 TGA/DSC and a Pfeiffer QMS300 MS. After reaching 900
°C, 2% H2gas in He was passed through the furnace causing transformation of iron oxides to Fe0.
Results and Discussion
Visual Observation of Iron Corrosion. Column I. Iron
corrosion and cementation were extensive at the inlet sand-Fe0interface and reduced progressively in the column. Near the inlet, iron lost visible grains and showed heavy cementa-tion (see Plate 2a, Supporting Informacementa-tion). Rusty stain was visible throughout the iron cross-section and on sand grains near the inlet. Cementation extended ∼60 cm into the column, accounting for∼2/3 of the iron mass. Distinct iron grains were present∼14 cm into the column, on otherwise solidly cemented samples. In the same section, iron was more easily broken up in the bottom part of the horizontal-oriented column, implying less extensive cementation. Loose filings mixed with cemented samples were observed at 22 cm, near the bottom of the column, while the upper part of this section was completely cemented. From 22 to 60 cm, however, the bottom regions show heavy cementation. Rust stain was also seen at these cross-sections with less intensity than at the inlet interface (see Plate 2b, Supporting Information). Starting at∼60 cm, and extending to the effluent interface, loose but densely compacted dark gray to black filings predominated.
Column II. With one tenth of the volume treated in
Column I, cementation and corrosion were substantially less in this column than in Column I. Cemented samples were obtained at the inlet sand-Fe0 interface, as in Column I. However, cementation extended only∼2.5 cm into the Fe0 accounting for∼1/12 of iron mass. In the remainder of the column, filings were loose with no observable cementation. Rusty stain was observed at the influent and effluent sand-Fe0interfaces.
For both columns, a 1-2 mm gap was observed between
the media and the column casing across the entire length of the column, extending 6-7 cm in width along a∼120 degree
arc (see Plate 2, Supporting Information). The surfaces of the media facing this gap were completely coated with rusty deposits, the products of Fe0oxidation by O
chemistry over time (Figure 1a,b) suggest gradual develop-ment of preferential flow paths (16, 17). Additionally, hydraulic tracer tests in Column I showed homogeneous flow after 1.3-yr of simulated normal treatment but severe flow channeling after 3.9-yr simulation (16). Mass balance estimates indicate that 9-27.3 mM of precipitates formed in
∼3-yr of simulated treatment time (run time of 30 and 72 d in Table 1). We suggest that this precipitation at the inlet region caused hydraulic conductivity contrast between the gap and the bulk media and subsequently the diversion of influent through the gap.
Following influent diversion, groundwater redistributed beyond the heavily cemented region, reacting with Fe0and precipitating minerals nonuniformly into the column. The reduced groundwater flow through the lower part of the column may account for less cementation than in the top region. Thus, heterogeneous flow appears to be the main reason for the differing degrees of cementation across and along the columns (16).
Mineral Phase Identification Using XRD.Quantitative
use of XRD intensity normally requires proper standardiza-tion. However, change in intensity ratio of certain phase pairs implies change in mass ratio, provided samples have similar matrix and phase assemblage. In this study, changes in intensity ratios of two phase-pairs (calcite/aragonite and magnetite/goethite) were observed to elucidate the influence of pore waters on the phase formation. No attempt was made to quantify phases using XRD.
Figure 2 summarizes the mineral phases identified in cores, showing characteristic XRD signal intensities in descending order. All samples showed a similar suite of minerals but with different intensity ratios. The major phases are goethite (R-FeOOH), magnetite (Fe3O4), calcite, and
aragonite, with lesser amounts of Fe2(OH)2CO3and green rust. These phases were identified under field and laboratory conditions (1-5), with some exceptions. Siderite and sulfide
phases were not identified by XRD in this study but have been reported in the nearby PRB (5,7) and others (3). The amorphous phases (iron oxide in particular), indicated by broad peaks or raised background in XRD diffractograms, were observed in field core samples (7) but not in this column study. Furukawa (4) reported that XRD failed to detect ferrihydrite, an amorphous phase, despite its ubiquitous
existence shown by selected area electron diffraction of field core samples. The presence of an amorphous phase in the columns may therefore be possible but to a much lesser extent than the crystalline phases.
Distribution of predominant mineral phases in the columns is consistent with groundwater characteristics and known thermodynamic stability conditions for these phases (19, 21, 23). In Column I calcite and goethite generally predominated over aragonite and magnetite under conditions of lower pH and higher dissolved O2, NO3-, Ca, and alkalinity (i.e., near the influent region and adjacent to the column gap, Figure 2). Elsewhere in the column this predominance was reversed. In Column II goethite was detected only in samples at the sand-Fe0interface and regions adjacent to the gap. The distribution of iron (oxyhydr)oxide is consistent with previous findings that goethite precipitates in waters containing dissolved O2and lower pH, while magnetite is the predominant phase at alkaline pH and higher Fe2+
(23). Nonetheless, both goethite and magnetite may coexist when there is an oxidation potential gradient across the corrosion rind (5). During Fe0oxidation, iron oxide layers of different oxidation state commonly formed (24). Chemical equilibrium modeling showed that influent solutions were undersaturated with respect to CaCO3minerals, but that pore water solutions along the columns were supersaturated (Figure 2 in ref17). Calcite and aragonite were both detected, but calcite ap-peared to be abundant only where dissolved Fe was relatively low (Figure 1b), reflecting the inhibitory effect of ferrous and ferric ions on calcite precipitation (25,26).
The fact that columns with different flow rates contain the same mineral assemblage confirms that the residence time in the fast flow column (Column I) was sufficient for major minerals to precipitate. Thus, use of accelerated flow of high groundwater throughput can simulate mass pre-cipitation resulting from longer periods of “normal” flow, in this case 17 yrs within the 2-yr study period. However, certain minerals, such as siderite, although seen in field cores (3-5),
were not detected in column studies here or elsewhere (2). This may be due to slow kinetics and competition with the high Ca in groundwater (21, 28). The absence of sulfide minerals in the present study reflects limited microbial activity (16). Sulfide formation mediated by sulfate-reducing bacteria requires a long inoculation time in the presence of
TABLE 1. Precipitate Mass and Porosity Loss in Column I Based on the Mass Balance of Pore Water Aqueous Species, Modified from Ref
16
aAssum ed abiotic nitrate reduction prior to day 215, and biotic reduction afterw ard: abiotic reaction: 4Fe0+NO3-+7H2Of4Fe2++NH4+
+10OH-; biotic reaction: 5Fe0+2NO3-+6H2Of5Fe2++N2+12OH-.bThe porosity loss w as calculated using 60% initial porosity. The porosity
loss due to Fe3O4orR-FeOOH precipitation is separated by ‘/’ and has been corrected for any porosity gain from the loss of Fe0m ass due to
corrosion.cDistributing m ineral phases uniform ly throughout the Fe0m edium .dM ineral phases allocated to the first 50 cm of the iron m edium ,
high level SO42-(2). The presence of siderite and iron sulfide indicates that field PRBs encompass non-steady-state trans-port and reaction regimes (7, 10, 15), which may not be adequately simulated in column studies.
Using TGA-MS in Phase Quantification. Weight loss
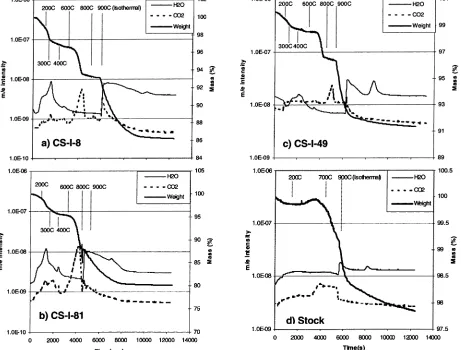
patterns obtained by TGA-MS are very similar among the core samples (Figure 3a-c) and are significantly different
from those of stock iron filings (Figure 3d). For all core samples, the normalized weight decreased gradually to∼200
°C and then decreased sharply corresponding to the detection of H2O(g) and CO2(g). Weight loss continued at a slower rate to 600°C and then dropped abruptly corresponding to a sharp increase in CO2. During the isothermal reduction period at 900°C, a weight drop accompanied by H2O production was observed; the weight approached an asymptotic value (80-91% of initial weight) at the end of the period. For
CS-I-8, the inlet core sample, a spike of CO2in addition to H2O was seen in the off gas (Figure 3a). The source of this CO2 peak is unclear but may be the remaining CO2from CaCO3 transformation at 600°C, which was flushed out by H2O.
The TGA-MS results for the stock iron filing (Figure 3d) show a slight increase in weight at>400°C, which is attributed
to the oxidation of Fe0with the surface-absorbed oxygen. The sample weight started to decrease at>600°C, with the
occurrence of CO2 in the off-gas. Because the stock iron contained a small amount of elemental carbon, heating could enhance C reacting with iron oxide to form Fe0and CO
2(24).
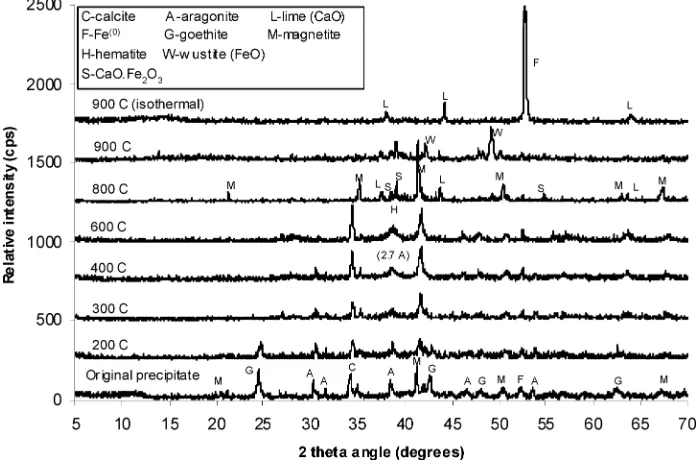
TGA-MS Analysis with XRD Identification.XRD analysis was performed on samples that had been heated to 200, 300,
400, 600, 800, and 900°C (Figure 4). No obvious phase change occurred at 200°C. The MS identified the presence of mainly atomic mass 18 and 17 in the off-gas, representing absorbed water (23) and its ionized product. A small quantity of CO2 was also detected. The goethite signal disappeared when samples were heated to 300 °C, but a small broad peak appeared at 2.7Å, coinciding with the strong line of hematite and aragonite. We attribute it to hematite because it persisted at 600°C. From 600 to 800°C, CaCO3transformed to CaO. The major phase at 800°C was Fe3O4, with minor components of CaO‚Fe2O3, CaO, and Fe2O3(Figure 4). At 900 °C, FeO,
CaO‚Fe2O3, and CaO were identified. At the end of the
isothermal reduction, the two major phases remaining were CaO and metallic iron.
The phase changes seen in the XRD analyses are con-sistent with existing high-temperature phase transformation data for carbonate and iron-containing minerals. For ex-ample, aragonite undergoes polymorphic transition to calcite at about 450 °C (21). At ∼700 °C, calcite loses CO2 and transforms into CaO (29). Based on stoichiometry, the CO2 mass can be used to quantify the original mass of CaCO3in the sample.
The transformation of iron-containing phases is more complex than that of CaCO3. Goethite usually loses its structural OH between 250 and 400°C (23), according to 2FeOOHfFe2O3+H2O. The transformation of Fe2(OH)2
-CO3under Ar atmosphere at 500°C is given by (30) FIGURE 3. TGA-M S results of w eight loss and off gas analysis for Column I core samples (a-c) and stock iron filings (d): (a) from inlet interface (CS-I-8), (b) from the center of the column (CS-I-81), and (c) from the effluent end of the column (CS-I-49). Note: for sample in (b), H2w as purged at 800 instead of 900°C.
3Fe2(OH)2CO3f2Fe3O4+H
No information is available on the thermo-induced phase transformation of amorphous iron oxide and green rust. Fe2O3 and Fe3O4can be quantified from the loss of O atoms during the isothermal reduction at 900°C by H2as follows (24):
Since reduction of Fe3O4to FeO occurs above 800°C, oxidized iron should be calculated based on the mass difference at 800°C and at the end of heating. Although losses from the oxidation of carbon in iron may occur, the percentage is small (<0.6%) based on the result from stock
iron. No sulfide compounds were detected by MS during heating. Comprehensive interpretation of the TGA results was limited by the complex nature of the samples and lack
of a complete database for all relevant phases. This neces-sitated some simplifying assumptions, as discussed here, to directly quantify the mass of major precipitates.
Precipitate Mass and Corrosion Rate.Weight loss data from TGA-MS combined with XRD analysis were used to estimate the mass of major phases including R-FeOOH,
CaCO3, total oxidized Fe (as Fe3O4, the stable phase of iron oxide at 800°C under the test condition), and initial Fe0in core samples from column study (Table 2). Precipitate mass was calculated as a percentage of the initial weight at 200°C, which excludes the absorbed water. Using the initial Fe0and oxidized iron mass, the corrosion rate was derived for the operation period. Since the effluents contained negligible dissolved (Figure 1) and particulate iron (16), it is assumed that Fe dissolution and precipitation was localized with no long-range transport. The calculated corrosion rates range 2.86-6.16 mmol kg-1d-1for Column I and 0.5-4.09 mmol kg-1d-1for Column II (Table 2). These rates are higher than the published rate (0.6 mmol kg-1d-1) for saline groundwater FIGURE 4. Phase identification of samples (mixtures of CS-I-8, -81, and -49) treated at different temperatures. No obvious phase transformation betw een the original sample and the sample heated to 200°C. Goethite signal disappeared betw een temperature of 200 and 300°C. From 600 to 800°C, CaCO3transformed to CaO. The major phase at 800°C w as Fe3O4, and, at much lesser intensities, CaO‚Fe2O3, CaO, and Fe2O3. At 900°C, FeO, CaO‚Fe2O3, and CaO w ere identified. After heating at 900°C (w ith 2% H2in helium), the tw o major phases remaining w ere
CaO and Fe0, the later resulting from total reduction of iron oxide to metallic iron.
TABLE 2. Precipitate Mass and Porosity Loss Derived from TGA-MS Data (Figure 3)
precipitates (mmol)
samples
asr-FeOOHb
(200-300°C)
as CaCO3
(600-800°C)
as Fe3O4c
(800-900°C)
initial Fe0d
(mmol)
precipitate (%)a
CaCO3+Fe3O4+ r-FeOOH
corrosion ratese
(mmol kg-1d-1)
porosity lossf(%)
stock iron 0.024 1.75
colum n I
CS-I-8 0.177 0.069 0.089 1.45 29.60 4.86 45.08
CS-I-81 0.223 0.167 0.097 1.25 41.71 6.16 77.57
CS-I-49 0.060 0.045 0.057 1.57 18.31 2.86 25.57
colum n II
CS-II-1 0.127 0.072 0.078 1.48 32.60 4.09 40.57
CS-II-3 0.024 0.017 0.032 1.66 10.16 1.50 12.10
CS-II-15 0.020 0.020 0.011 1.68 5.07 0.50 7.39
aTotal m ass percentage of all precipitates corrected for the initially oxidized m ass based on data from the reduction of stock iron filings.bThe
m ass ofR-FeOOH calculated using m ass of H2O during 200-300°C heating assum ing goethite is transform ed to hem atite (see Figure 4).cM ass
of total oxidized iron transform ed in this tem perature range, calculated as Fe3O4.dCalculated from the final w eight, less the m ass of CaO.eCalculated
from the m ass ratio of total oxidized iron to the initial Fe0, averaging over the experim ental run tim e (680 d for Colum n I, and 695 d for Colum n
II). For Colum n I the run tim e is equivalent to∼17-yr of sim ulated norm al flow in Colum n II.fPorosity loss calculated based on 60% initial porosity,
corrected for porosity gain from loss of iron due to corrosion using density values of 2.93 for CaCO3, 5.1 for Fe3O4, 3.8 forR-FeOOH, and 7.9 for
Fe0.
3Fe2O3+H
2f2Fe3O4+H2O
Fe3O4+H2f3FeO+H2O
FeO+H 2fFe
(6) but fall within the range of reported corrosion rates of 0.2-50 mmol kg-1d-1(20). In our study, the high corrosion rate is attributed to the high rate of reduction of NO3-via biotic and abiotic reactions (16,31).
Derived corrosion rates are generally higher in Column I than Column II (Table 2). Since∼10 times greater volumes of groundwater were treated in Column I, mass loading appears to control the higher rates observed in Column I (14). However, regardless of the volumes treated, the inlet regions exhibited similar corrosion rates (4.86 and 4.09 mmol kg-1d-1), demonstrating that the sand-Fe0interface is critical for PRB assessment (1, 4, 5, 9, 10,32, 33). At the influent interface, groundwater had the highest dissolved O2(1,16) and NO3-(Figure 1), which rapidly react with Fe0(18,33). Under ideal plug flow conditions, the reaction front will progress into the media as the upgradient iron becomes nonreactive. Thus, a moving reaction front in Fe0media could signal severe upgradient corrosion (16). In Column I, the NO3-front was at∼15 cm after 2.1-yr of simulated normal flow (Figure 1a) and advanced to ∼80 cm after 17-yr simulation (Figure 1b). A broader reaction front (∼15-20
cm) was also observed at the field PRB site where groundwater velocities were high (∼0.3 m d-1) compared to a narrower front (∼8 cm) with lower velocity (∼0.13-0.18 m d-1) at another PRB site (10).
Iron corrosion rates for these columns had previously been calculated by coupling stoichiometric NO3-reduction with Fe0oxidation (Table 1). Abiotic reactions were assumed to control nitrate reduction before 215 d, because significant N2gas production by denitrification was not observed until 215 d (16, 17). Using the pore water NO3- concentration, corrosion rates for the run period were calculated. Corrosion rates in the fast flow column were high (17 mmol kg-1d-1) during the first 30 d operation and decreased to∼2.5-mmol kg-1d-1after 666 d (i.e.,∼17-yr of simulated normal flow) (Table 1). The rates in Column II ranged 0.65-1.2 mmol kg-1 d-1(data not shown). Normalizing for the 20-times greater volume of water treated in Column I during the first 30 d, an average rate of 0.85 mmol kg-1d-1was derived, which falls within the range of Column II data. The lower corrosion rates at longer run times reflect decreasing iron reactivity over time. Reduction of reactive surface area due to pre-cipitates has been suggested to affect PRB performance (8, 13,19).
Averaging the precipitate mass (Table 1) over the entire operation period, the time-weighted average corrosion rate was calculated for Column I (4.3 mmol kg-1d-1). This value generally agrees with the corrosion rates derived by TGA-MS analyses (Table 2). The average corrosion rate for Column II (1.07 mmol kg-1d-1) is also within the TGA-MS results (0.5-4.09 mmol kg-1d-1). We note that the data from TGA-MS analysis represent discrete samples over the entire
operation period, while the aqueous mass balance calcula-tions are averaged over the entire medium for a given period. Nevertheless, the similar results obtained by these two methods suggest that the aqueous mass balance approach can provide an alternative to estimating corrosion rate in the absence of core analyses.
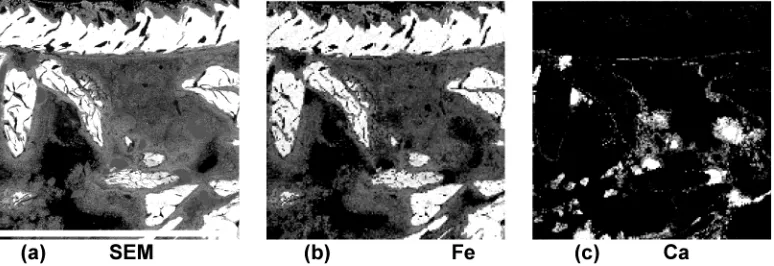
Degree of Cementation and Pore Filling.The remnants
of iron grains and pore spaces within a cemented sample were observed using SEM (Figure 5). The grains show wide ranging fine structures, including pits and intergranular pores, and the pores contain large quantities of precipitate (Figure 5a). Coatings on Fe0grains are thin (40µm) in some regions, but over 400µm in adjacent areas, completely filling pore spaces. The degree of cementation is much more extensive than the 10-50µM observed in a field sample (4). This is
understandable since the latter was subjected to 4-yr’s treatment, whereas the column was subjected to an equiva-lent treatment of∼17 yr. Samples from the nearby PRB show corrosion rinds of 10-150µm (5) after 1.5 years, reflecting
the effect of NO3-as seen in this study.
X-ray mapping images show Fe widely distributed in pore spaces, with Ca occurring as a thin layer close to the iron grains and clusters (Figure 5b,c). Thus, the iron-bearing minerals are the predominant pore fillers (4), whereas calcium appears to precipitate as a grain-coating mineral. At certain locations the pores are almost completely filled by precipitate (Figure 5), potentially isolating the pore waters from the bulk flow.
Porosity reduction was quantitatively estimated using two methods based on pore water chemistry (Table 1) and TGA-MS results (Table 2). Precipitate mass from the TGA-TGA-MS analysis was converted to volumes using the densities of the identified major minerals (2.93, 3.8, and 5.1 g cm-3for CaCO
3,
R-FeOOH, and Fe3O4, respectively). Based on TGA-MS results,
goethite contributes significantly to porosity loss, followed by CaCO3and then Fe3O4.
Calculation of mineral precipitate mass using the chemical profiles assumes that removal of dissolved Ca is balanced by CaCO3 (9, 16, 17) and all Fe produced from corrosion is precipitated as oxide/oxyhydroxide in the columns. In contrast to TGA-MS results, the proportions of Fe3O4and
R-FeOOH are unknown using the aqueous mass balance
porosity loss was 20.1-32.1%. The former high porosity
reduction agrees with SEM observation (Figure 5a) of cemented samples. The latter lower values are consistent with data from the less corroded effluent samples based on TGA-MS analysis (Table 2).
Fe0corrosion can be enhanced by several aqueous species, such as NO3-, SO42-, or HCO3-(1, 2,8,17,22), to different degrees (1, 6). Estimated porosity loss using different groundwater is expected to vary widely (9,19,33). Table 3 compares literature data on total porosity reduction, after normalizing the pore velocities used in these studies. For an equivalent 4-yr operation period, 6-18% porosity loss is
calculated for the current study. High porosity loss occurred using high levels of SO42-(15% in 6 months (2) and 3% per year (9), Table 3) in previous reports. In groundwater containing low levels of corrosive species, however, small porosity reduction (3.2-6.2%) was observed in 4 yr (10).
Accordingly, prediction of porosity reduction and long-term performance of PRBs should consider enhanced corrosion by site specific groundwater species and associated mineral phases.
In the column experiment, the microbial mass determined was small compared to the mineral solids. The biomass was 2425 pmol PLFA/g of Fe0at a location where most of the gas was produced. Using a cell conversion factor of 108pmol of PLFA/g dry weight of cells (34), the biomass equaled to 0.002% of the Fe0mass.
Implications.This column study captured the same major reaction products as those of field studies (1-5,7), but the
compositions of the major minerals vary considerably (see phase assemblages in Table 3). This is expected (9,17,19, 33) because of large variations in groundwater constituents in these studies. The coexistence of goethite/magnetite and aragonite/calcite pairs in the same sample reflects the changing pore water chemistry and flow pattern, supporting
previous observations of heterogeneous flow development (16). The lack of siderite and iron sulfide in the columns, as opposed to the observation in the nearby PRB (5,7), implies that the field system is inherently more heterogeneous and dynamic (4,10,15), which is difficult to replicate in column experiments. Nevertheless, considering the establishment of a steady-state reaction front (4,9,16,17) when groundwater first comes into contact with Fe0, the derived corrosion rate at the inlet interface of the columns may be applied to the upgradient interface at the nearby PRB (7).
As with corrosion processes, porosity loss is closely linked to the chemical composition and mass loadings. The estimate of 20-76% porosity reduction based on pore water mass
balance (Table 1) was verified by TGA-MS results (25-77%)
and visual observations of severe cementation at inlet interfaces. Normalized for the high treatment volumes equivalent to 17 yr, the porosity loss was calculated to be 1.5-4.5% per year. The high porosity loss (4.5% per year) at
the upgradient sand-Fe0interface is the main reason for the noticeable flow diversion within the first few years of treatment at the nearby field PRB (7). The corrosion rate and porosity reduction in this study were enhanced by high NO3 -concentrations, signifying the effect of groundwater chemistry on long-term PRB performance.
Column studies appear to produce greater porosity loss than field studies (Table 3). This may be due to the different constraints on mass fluxes through the two systems. Column experiments were conducted under constant flow conditions (1, 2,8,16) but with variable hydraulic heads. In contrast, flow in field PRBs is variable since it could bypass heavily cemented regions into the surrounding aquifer (7). Under forced-flow conditions, columns capture more treatment volume and are subject to greater porosity loss than field PRBs. In the field, the diverted flow may be recaptured by the PRB further downgradient if the Fe0is more permeable TABLE 3. Comparison of Mineral Phase Assemblages, Porosity Loss and Extent of Corrosion w ith Respect to Pore Velocity, Treatment Run Time, and Pore Water Chemistry for a Few Field and Laboratory Column Studiesh
total porosity loss in %
(corrosion rind inµm) selected chemical concentration in mM influent (effluent) source interfacea insideb
[4,10] lepidocrocite, m agnetite, aragonite, iron carbonate hydroxide, and/or siderite, carbonate-green-rust, iron m onosulfide, ferrous hydroxide
[9] siderite, aragonite, brucite, m agnetite, hem atite, m aghem ite, m arcasite, other iron sulfide [5] iron oxyhydroxide, akaganeite, siderite, iron sulfide
[8] prim arily m agnetite and carbonate green rust
[1] ferrous hydroxide, siderite (low alkalinity), CaCO3(high alkalinity)
[2] lepidocrocite, aganeite, m ackinaw ite, m agnetite, m aghem ite, goethite, siderite, am orphous ferrous sulfide this study m agnetite, goethite, calcite, aragonite, green rust, Fe2(OH)2CO3
aCore sam ples from upgradient interface.bCore sam ples from iron m edium inside a PRB or a colum n, aw ay from the interface.cCalculated
as HCO3-based on the reported dissolved inorganic carbon.dSee ref7.eNot available.fBased on pore w ater chem istry.gBased on tracer or
than the surrounding aquifer. Additional information on hydraulic capture of field flow is needed when applying column results to the prediction of the long-term perfor-mance of in situ PRBs.
Acknow ledgments
We thank M. Fox for helping with field coring and Dr. Y. Roh and Mr. E. E. Kenik for helping with mineral identification and SEM study. Funding for this research was supported by the Subsurface Contaminants Focus Area of the Office of Science and Technology, U.S. Depart-ment of Energy, under contract DE-AC05-00OR22725 with Oak Ridge National Laboratory, which is managed by UT-Battelle, LLC.
Supporting Information Available
Field columns during groundwater treatment in the field, showing the configuration of sampling and pressure ports in Column I (Plate 1) and end views of Column I disassembly (Plate 2). This material is available free of charge via the Internet at http://pubs.acs.org.
Literature Cited
(1) Mackenzie, P. D.; Horney, D. P.; Sivavec, T. M.J. Hazard. Mater. 1999,68, 1-17.
(2) Gu, B.; Phelps, T. J.; Liang, L.; Dickey, M. J.; Roh, Y.; Kinsall, B. L.; Palumbo, A. V.; Jacobs, G. K.Environ. Sci. Technol.1999,33, 2170-2177.
(3) Roh, Y.; Lee, S. Y.; Elless, M. P.Environ. Geol.2000,40, 184-194. (4) Furukawa, Y.; Kim, J. W.; Watkins, J.; Wilkin, R. T.Environ. Sci.
Technol.2002,36, 5469-5475.
(5) Phillips, D. H.; Gu, B.; Watson, D. B.; Roh, Y.; Liang, L.; Lee, S. Y.Environ. Sci. Technol.2000,34, 4169-4176.
(6) Reardon, E. J.Environ. Sci. Technol.1995,29, 2936-2945. (7) Moline, G.; Liang, L.; Kamolpornwijit, K.; West, O. R.J. Contam.
Hydrol. (revised)2004.
(8) Vikesland, P. J.; Klausen, J.; Zimmermann, H.; Roberts, A. L.; Ball, W. P.J. Contam. Hydrol.2003,64, 3-33.
(9) Yabusaki, S.; Cantrell, K.; Sass, B.; Steefel, C.Environ. Sci. Technol. 2001,35, 1493-1503.
(10) Wilkin, R. T.; Puls, R. W.; Sewell, G. W.Ground Water2003,41, 493-503.
(11) Orth, W. S.; Gillham, R. W.Environ. Sci. Technol.1996,30, 66 -71.
(12) Blowes, D. W.; Ptacek, C. J.; Jambor, J. L.Environ. Sci. Technol. 1997,31, 3348-3357.
(13) Farrell, J.; Kason, M.; Melitas, N.; Li, T.Environ. Sci. Technol. 2000,34, 514-521.
(14) Fryar, A. E.; Schwartz, F. W.J. Contam. Hydrol.1998,32, 333 -351.
(15) Eykholt, G. R.; Elder, C. R.; Benson, C. H.J. Hazard. Mater.1999, 68, 73-96.
(16) Kamolpornwijit, W.; Liang, L.; West, O. R.; Moline, G. R.; Sullivan, A. B.J. Contam. Hydrol.2003,66(3-4), 161-178.
(17) Liang, L.; Sullivan, A. B.; West, O. R.; Kamolpornwijit, W.; Moline, G. R.Environ. Eng. Sc.2003,20(6), 635-653.
(18) Matheson, L. J.; Tratnyek, P. G.Environ. Sci. Technol.1994,28, 2045-2053.
(19) Liang, L.; Korte, N.; Gu, B. H.; Puls, R.; Reeter, C.Adv. Environ. Res.2000,4, 273-286.
(20) Bokermann, C.; Dahmke, A.; Steiof, M. InChemical Oxidation and Reactive Barriers - Remediation of Chlorinated and Recalcitrant Compounds; 2000; pp 433-439.
(21) Mackenzie, R. C.Differential Thermal Analysis Vol. 1 Funda-mental Aspects; Academic Press: London, 1970.
(22) Gu, B.; Watson, D. B.; Phillips, D. H.; Liang, L. InGroundwater Remediation of Trace Metals, Radionuclides, and Nutrients, with Permeable Reactive Barriers; Naftz, D. L., Morrison, S. J., Davis, J. A., Fuller, C. C., Eds.; Academic Press: 2002; pp 305-342. (23) Cornell, R. M.; Schwertmann, U.The iron oxides: structure,
properties, reactions, occurrences and uses; Weinheim: New York, 1996.
(24) Bogdandy, L. V.; Engell, H. J.The Reduction of Iron Oxides; Springer: New York, 1971.
(25) Takasaki, S.; Parsiegla, K. I.; Katz, J. L.J. Crystal Growth1994, 143, 261-268.
(26) Wada, N.; Yamashita, K.; Umegaki, T.J. Crystal Growth1995, 148, 297-304.
(27) Deer, W. A.; Howie, R. A.; Zussman, J.An Introduction to the Rock-Forming Minerals; Longman: Hong Kong, 1983; Vol. 14th impression.
(28) Berner, R. A.Principles of chemical sedimentology; McGraw-Hill: New York, 1971.
(29) Kamolpornwijit, W.Feasibility Study to Extract Iron Chromium from Chromium Contaminated, Soils; New Jersey Institute of Technology, 2000.
(30) Erdos, V. E.; Altorfer, H.Werkstoffe Korrosion1976,27, 304 -312.
(31) Sclicker, O.; Ebert, M.; Fruth, M.; Weidner, M.; Wust, W.; Dahmke, A.Ground Water2000,38, 403-409.
(32) Blowes, D. W.; Jambor, J. L.; Hanton-Fong, C. J.; Lortie, L.; Gould, W. D.Appl. Geochem.1998,13, 687-705.
(33) Mayer, K. U.; Blowes, D. W.; Frind, E. O.Water Resour. Res. 2001,37, 3091-3103.
(34) Balkwill, D. L.; Leach, F. R.; Wilson, J. T.; McNabb, J. F.; White, D. C.Microb. Ecol.1988,16, 73-84.
Received for review October 1, 2003. Revised manuscript received August 12, 2004. Accepted August 17, 2004.
![FIGURE 1. Chemical changes along Column I (a and b) and Column II (c and d), showing pH (]Heterogeneous flow appeared during later stage operation (b and d), where higher concentrations at down gradient location are due tomixing with preferentially transpo](https://thumb-ap.123doks.com/thumbv2/123dok/3763829.1820605/2.612.72.542.37.334/chemical-heterogeneous-operation-concentrations-gradient-location-tomixing-preferentially.webp)